
A very small range inside day leaves all Elliott wave counts unchanged.
Summary: Conditions are still suggesting a sustainable low may be in place although today the absence of any strength is concerning for this view. The next target is 3,120.
A new low below 2,822.12 would indicate a continuing deeper pullback as fairly likely. The first target would then be at 2,663.
The biggest picture, Grand Super Cycle analysis, is here.
Monthly charts were last published here, with video here. There are two further alternate monthly charts here, with video here.
ELLIOTT WAVE COUNTS
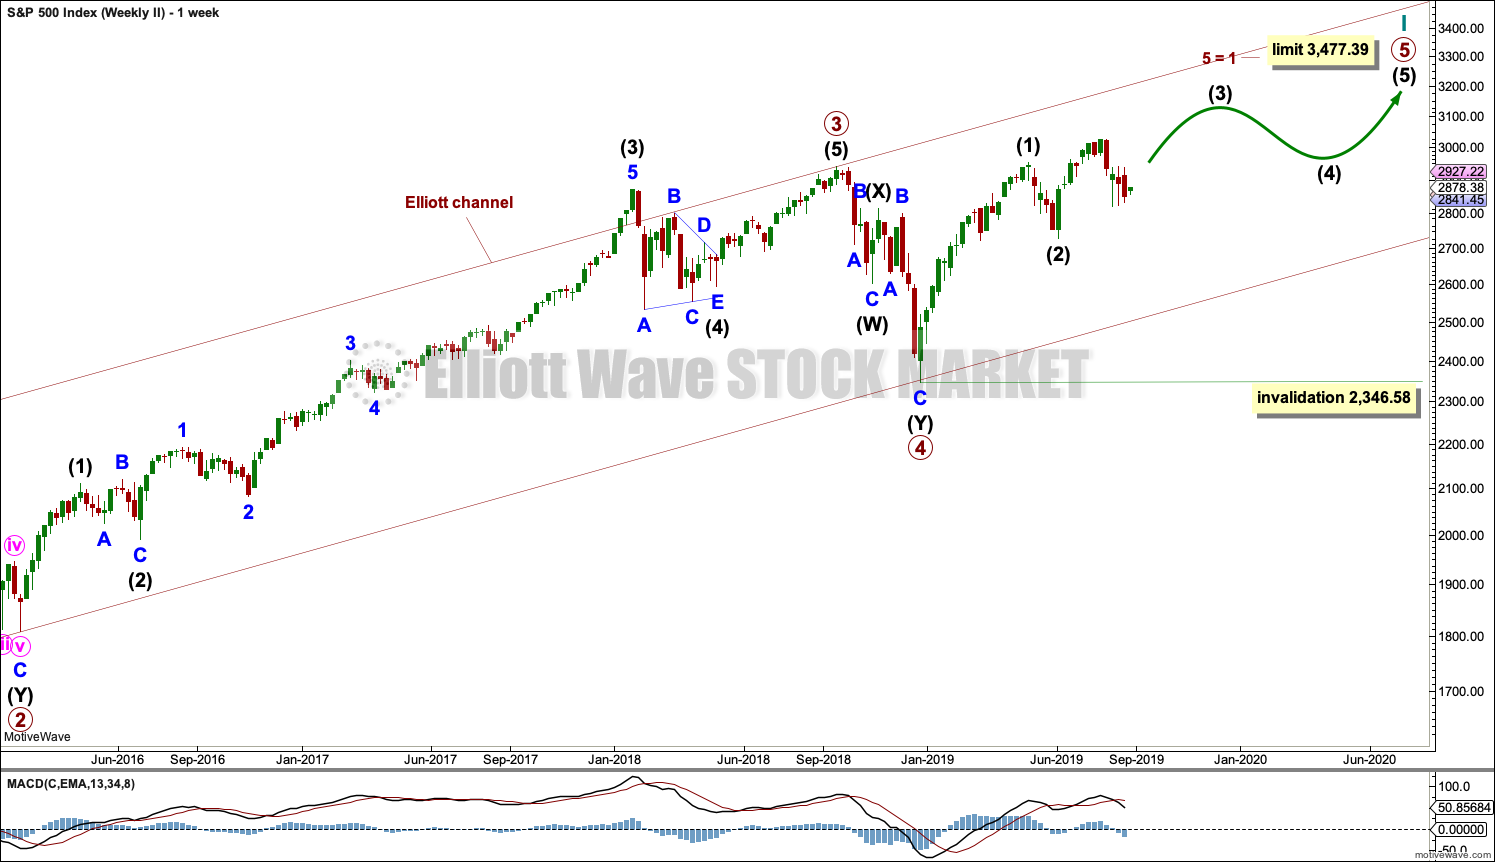
The two weekly Elliott wave counts below will be labelled First and Second. They may be about of even probability. When the fifth wave currently unfolding on weekly charts may be complete, then these two wave counts will diverge on the severity of the expected following bear market. To see an illustration of this future divergence monthly charts should be viewed.
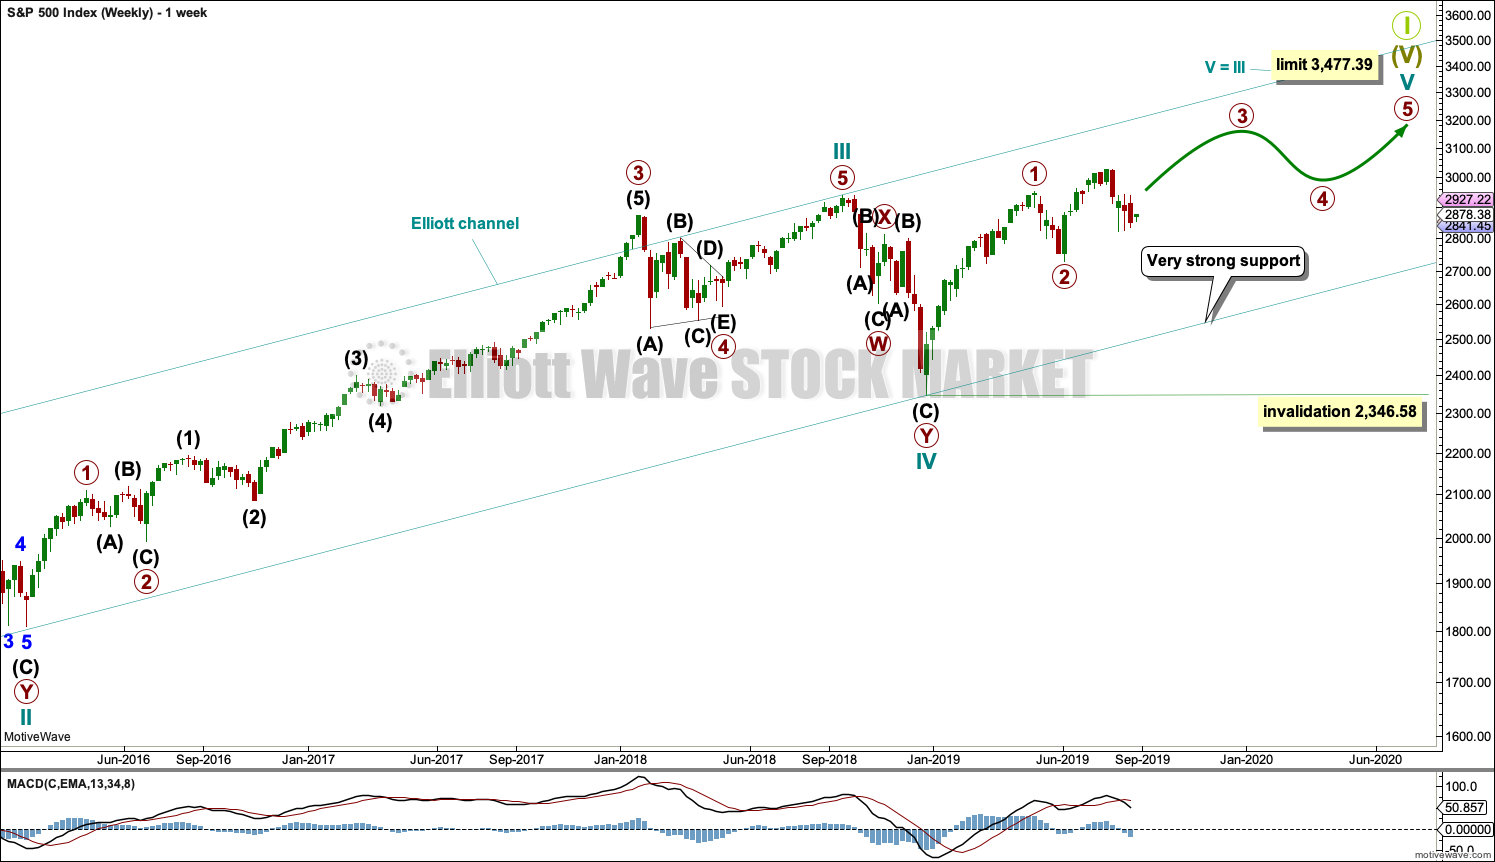
FIRST WAVE COUNT
WEEKLY CHART
Click chart to enlarge.
The basic Elliott wave structure consists of a five wave structure up followed by a three wave structure down (for a bull market). This wave count sees the bull market beginning in March 2009 as an incomplete five wave impulse and now within the last fifth wave, which is labelled cycle wave V. This impulse is best viewed on monthly charts. The weekly chart focusses on the end of it.
Elliott wave is fractal. This fifth wave labelled cycle wave V may end a larger fifth wave labelled Super Cycle wave (V), which may end a larger first wave labelled Grand Super Cycle wave I.
The teal Elliott channel is drawn using Elliott’s first technique about the impulse of Super Cycle wave (V). Draw the first trend line from the end of cycle wave I (off to the left of the chart, the weekly candlestick beginning 30th November 2014) to the end of cycle wave III, then place a parallel copy on the end of cycle wave II. This channel perfectly shows where cycle wave IV ended at support. The strongest portion of cycle wave III, the end of primary wave 3, overshoots the upper edge of the channel. This is a typical look for a third wave and suggests the channel is drawn correctly and the way the impulse is counted is correct.
Within Super Cycle wave (V), cycle wave III is shorter than cycle wave I. A core Elliott wave rule states that a third wave may never be the shortest. For this rule to be met in this instance, cycle wave V may not be longer in length than cycle wave III. This limit is at 3,477.39.
Cycle wave V may subdivide either as an impulse or an ending diagonal. Impulses are much more common. This main wave count expects that cycle wave V may be unfolding as an impulse.
The daily charts below will now focus on all of cycle wave V.
In historic analysis, two further monthly charts have been published that do not have a limit to upwards movement and are more bullish than this wave count. Members are encouraged to consider those possibilities (links below summary) alongside the wave counts presented on a daily and weekly basis.
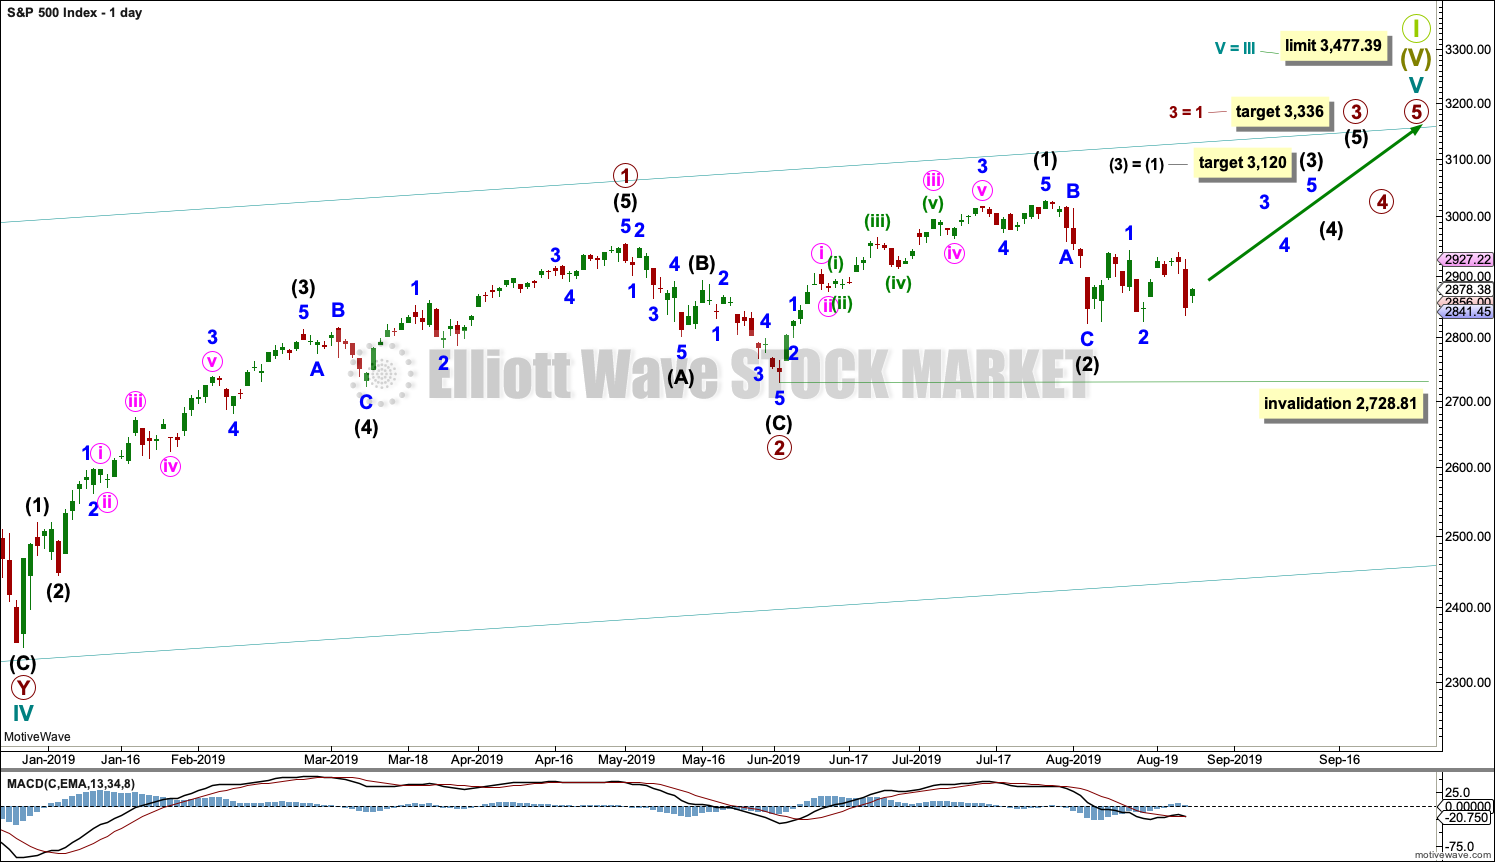
MAIN DAILY CHART
Click chart to enlarge.
There is enough support from classic technical analysis to consider this the main wave count.
Cycle wave V is seen as an impulse for this wave count.
Within cycle wave V, primary waves 1 and 2 may be complete. Primary wave 3 may have begun.
Primary wave 3 may only subdivide as an impulse. Within primary wave 3, intermediate waves (1) and (2) may be complete.
It is also possible that intermediate wave (2) may be incomplete and sideways movement of the last 15 sessions may be minor wave B within a zigzag for intermediate wave (2). If intermediate wave (2) continues lower, then it may not move beyond the start of intermediate wave (1) below 2,728.81.
Intermediate wave (3) may have begun. Intermediate wave (3) may only subdivide as an impulse.
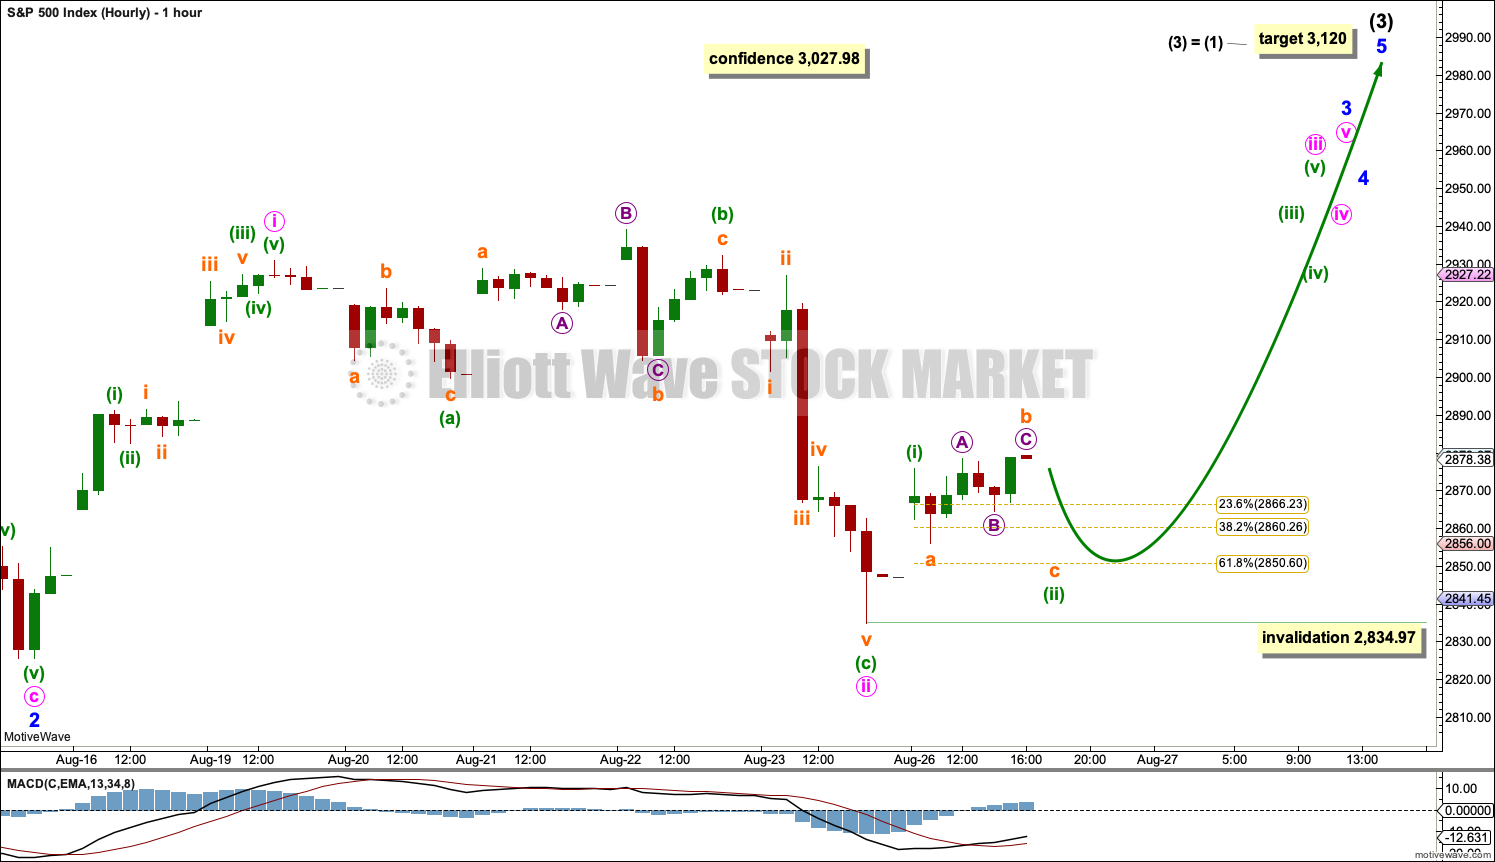
MAIN HOURLY CHART
Click chart to enlarge.
Intermediate wave (3) may only subdivide as a five wave impulse. Within intermediate wave (3), minor waves 1 and 2 may now be complete. Minor wave 3 may only subdivide as a five wave impulse.
Within minor wave 3, minute waves i and ii may be complete. Within minute wave iii, minuette wave (ii) may not move beyond the start of minuette wave (i) below 2,834.97.
Minute wave iii must move beyond the end of minute wave i. Minute wave iii must move far enough above the end of minute wave i to allow room for minute wave iv to unfold and remain above first wave price territory.
The next wave up for this wave count may then exhibit an increase in momentum as a third wave at four degrees unfolds.
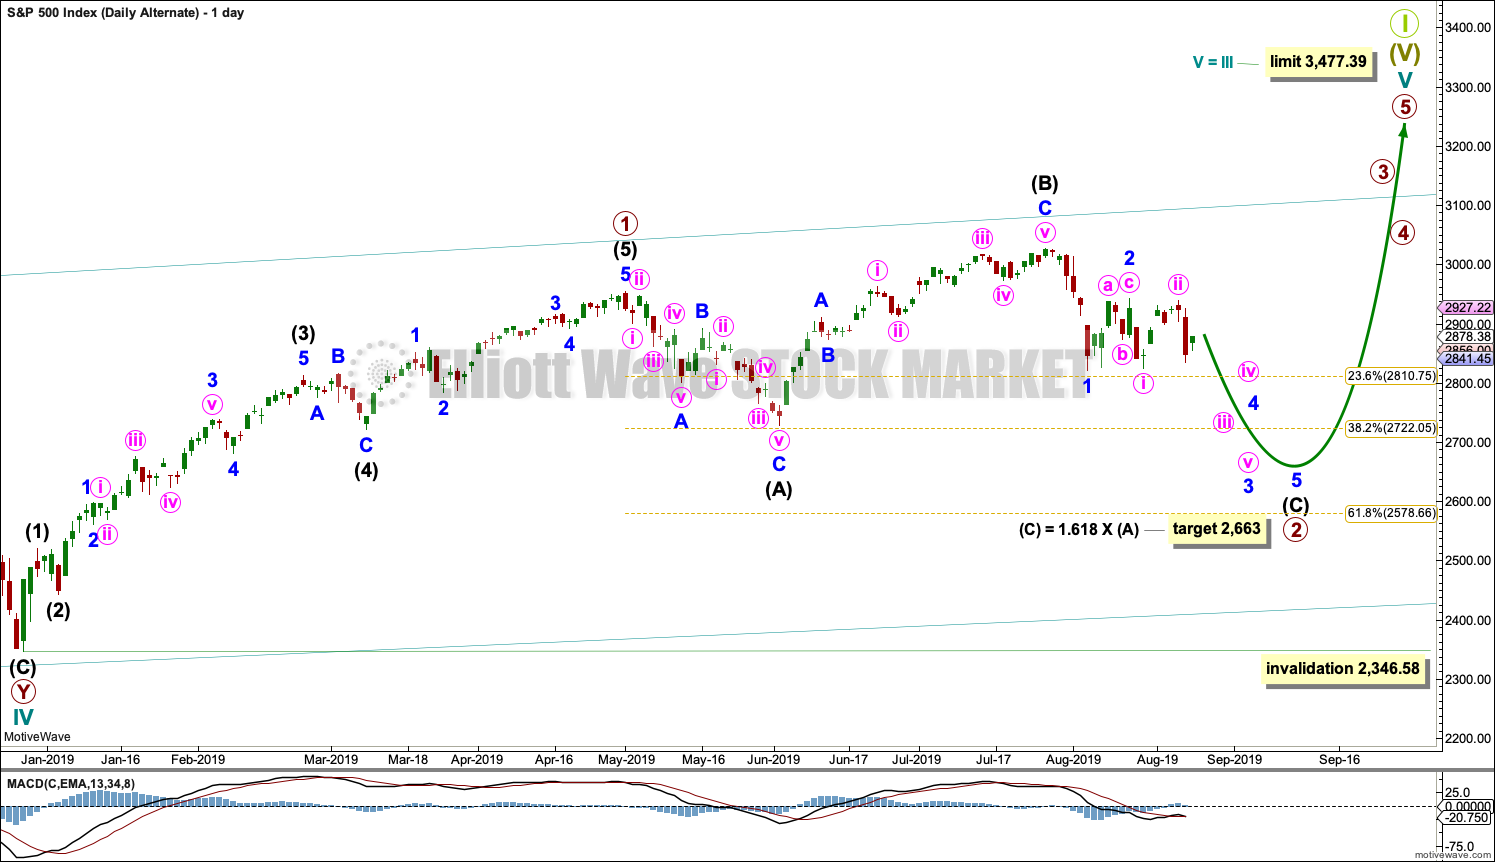
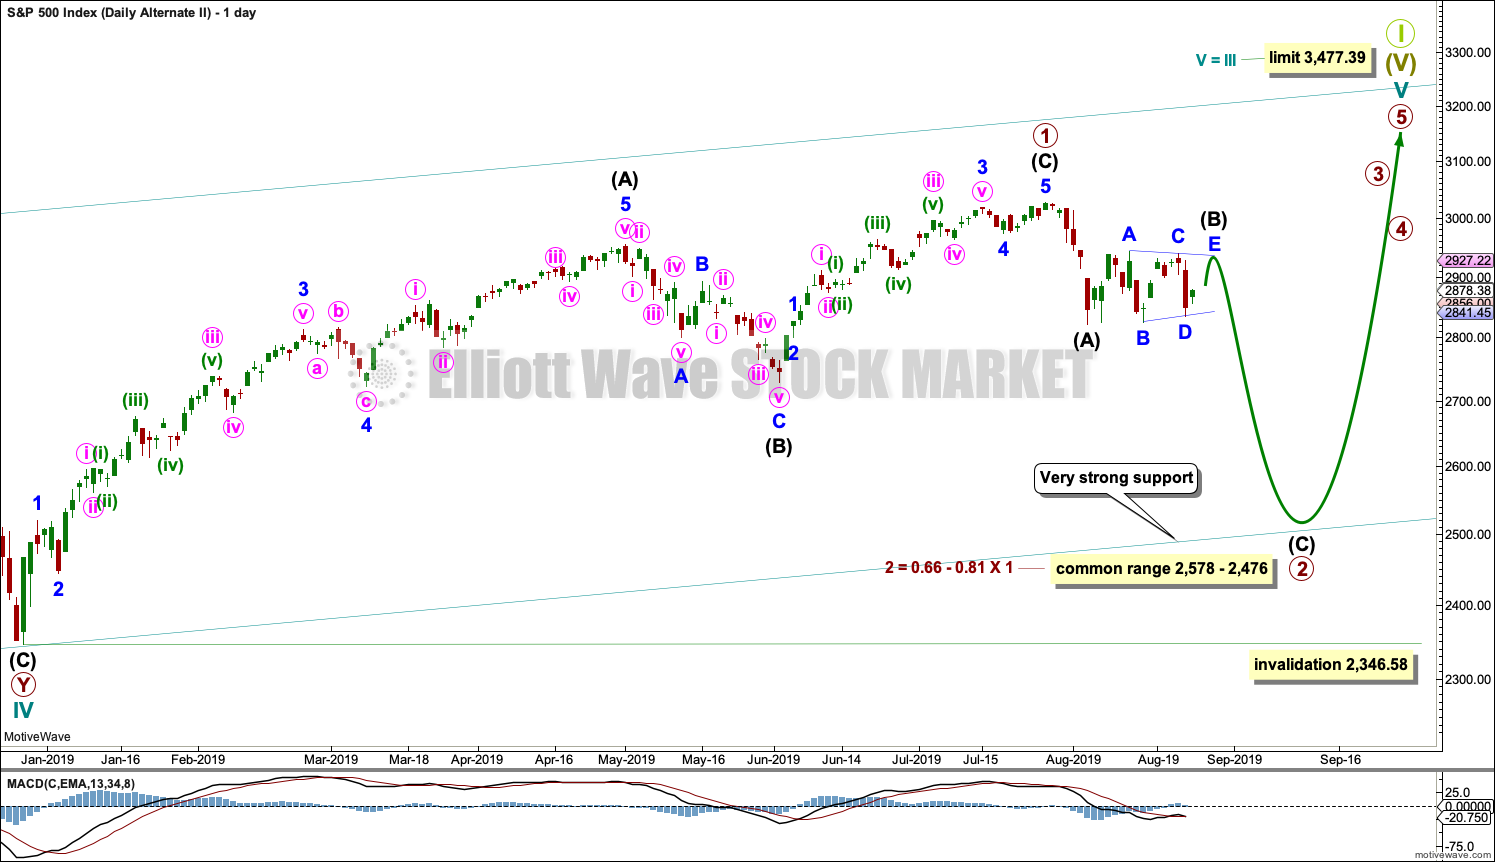
ALTERNATE DAILY CHART
Click chart to enlarge.
This first alternate wave count considers the possibility that cycle wave V may be unfolding as an impulse.
Cycle wave V must subdivide as a five wave motive structure. Within that five wave structure, primary wave 1 only may be complete.
Primary wave 2 may be unfolding as an expanded flat correction. These are reasonably common Elliott wave corrective structures. Flat corrections subdivide 3-3-5. Expanded flats have B waves which are 1.05 or more the length of their A waves. In this example for primary wave 2, intermediate wave (B) is a 1.33 length of intermediate wave (A). The target for intermediate wave (C) expects it to exhibit the most common Fibonacci Ratio to intermediate wave (A) within an expanded flat.
If price reaches the target at 2,663 and keeps falling, then the next target would be the 0.618 Fibonacci Ratio of primary wave 1 at 2,578.66.
Primary wave 2 may not move beyond the start of primary wave 1 below 2,346.58.
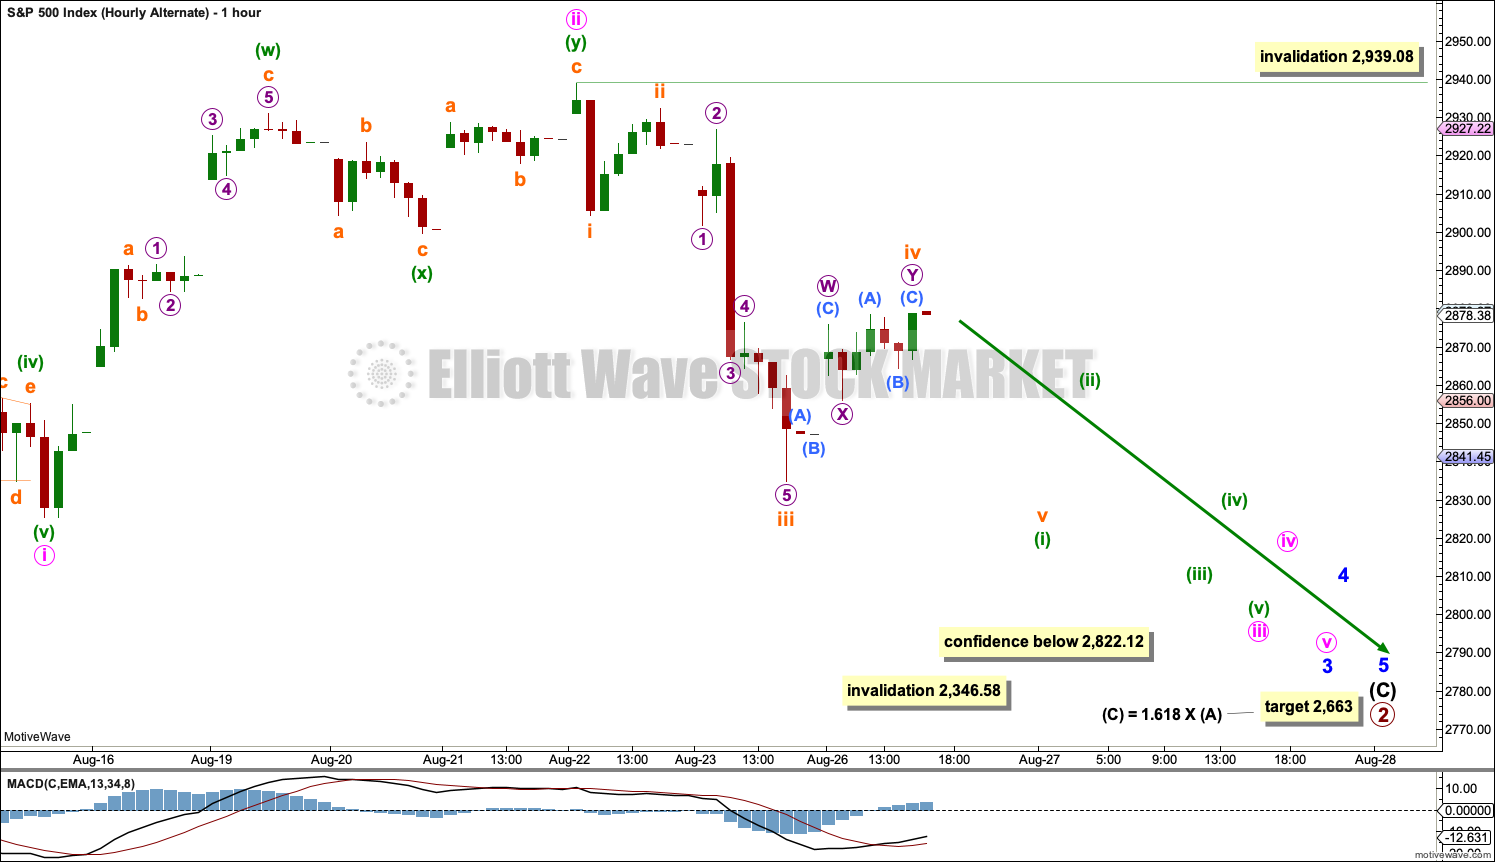
ALTERNATE HOURLY CHART
Click chart to enlarge.
Intermediate wave (C) must subdivide as a five wave motive structure for this wave count. Minor waves 1 and 2 may be complete within intermediate wave (C).
Minor wave 3 may only subdivide as an impulse. Minute waves i and ii may be complete within minor wave 3.
Minute wave iii may only subdivide as an impulse. Minuette wave (i) may be incomplete within minute wave iii. Minuette wave (ii) may not move into minuette wave (i) price territory above 2,939.08.
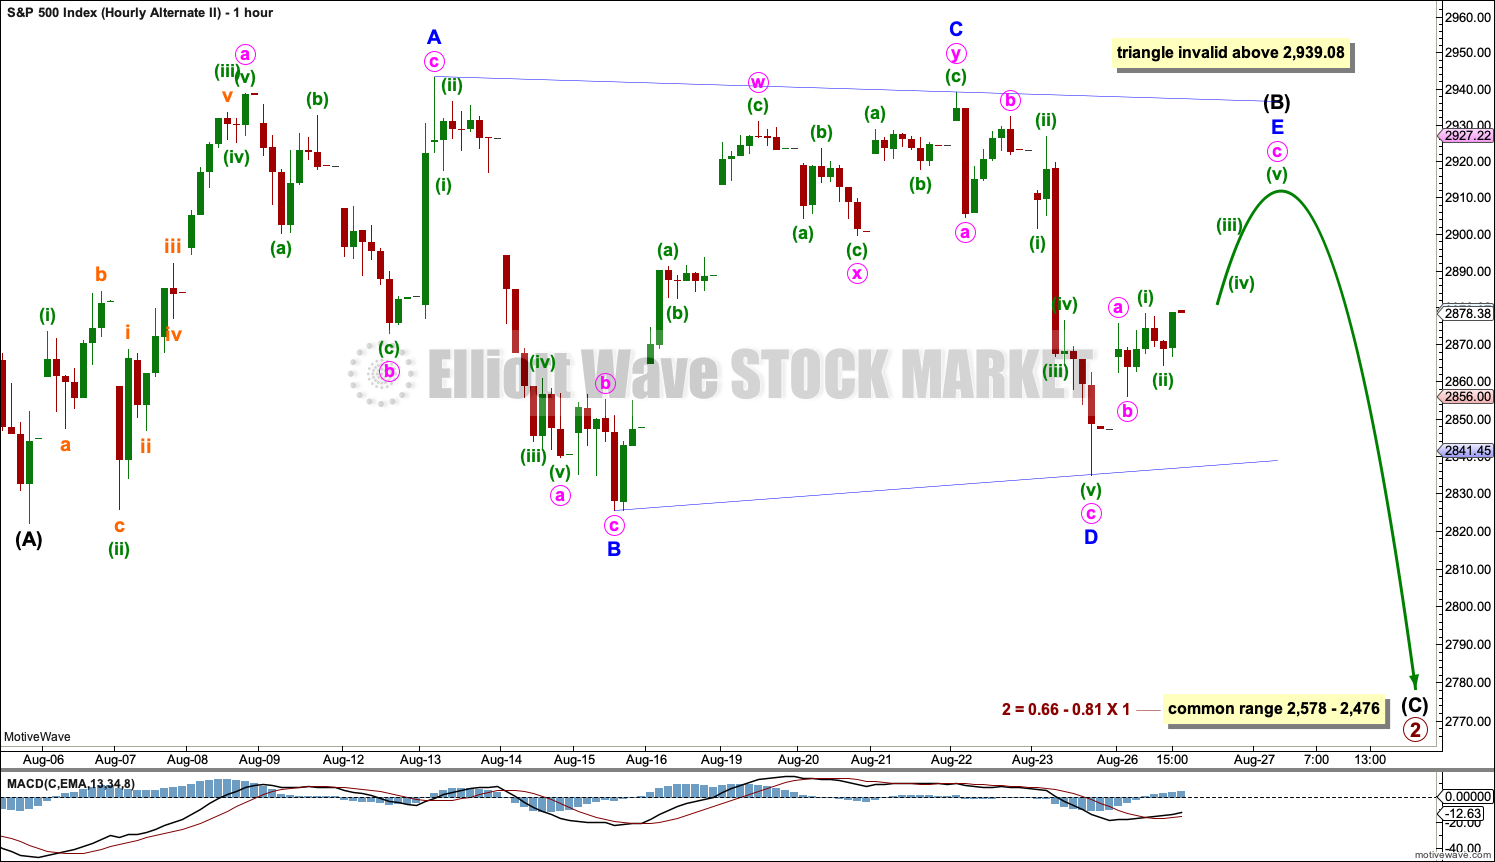
SECOND ALTERNATE DAILY CHART
Click chart to enlarge.
This second alternate daily chart considers the other structural possibility for cycle wave V, that of an ending diagonal.
All sub-waves within an ending diagonal must subdivide as zigzags. Primary wave 1 may have been complete as a zigzag at the last all time high on the 26th of July.
Primary wave 2 may be continuing lower as a zigzag. Within the zigzag, intermediate wave (B) may be completing as a sideways triangle.
Within diagonals, sub-waves 2 and 4 are normally very deep, ending within a range of 0.66 to 0.81 the prior wave. This range for primary wave 2 is from 2,578 to 2,476. Primary wave 2 may possibly come as low as the lower edge of the teal channel, which is copied over from the weekly chart.
Primary wave 2 may not move beyond the start of primary wave 1 below 2,346.58.
SECOND ALTERNATE HOURLY CHART
Click chart to enlarge.
Within the zigzag of primary wave 2, intermediate wave (B) may be subdividing as a regular contracting triangle. Only the final sub-wave of minor wave E may be needed to complete.
Minor wave E should subdivide as a single zigzag and would most likely fall short of the upper A-C trend line. Minor wave E may not move beyond the end of minor wave C above 2,939.08.
If the triangle is invalidated with a new high by any amount at any time frame above 2,939.08, then intermediate wave (B) may be completing as a double combination: zigzag – X – flat.
When the triangle is complete, then intermediate wave (C) downwards should begin.
SECOND WAVE COUNT
WEEKLY CHART
Click chart to enlarge.
This weekly chart is almost identical to the first weekly chart, with the sole exception being the degree of labelling.
This weekly chart moves the degree of labelling for the impulse beginning in March 2009 all down one degree. This difference is best viewed on monthly charts.
The impulse is still viewed as nearing an end; a fifth wave is still seen as needing to complete higher. This wave count labels it primary wave 5.
TECHNICAL ANALYSIS
WEEKLY CHART
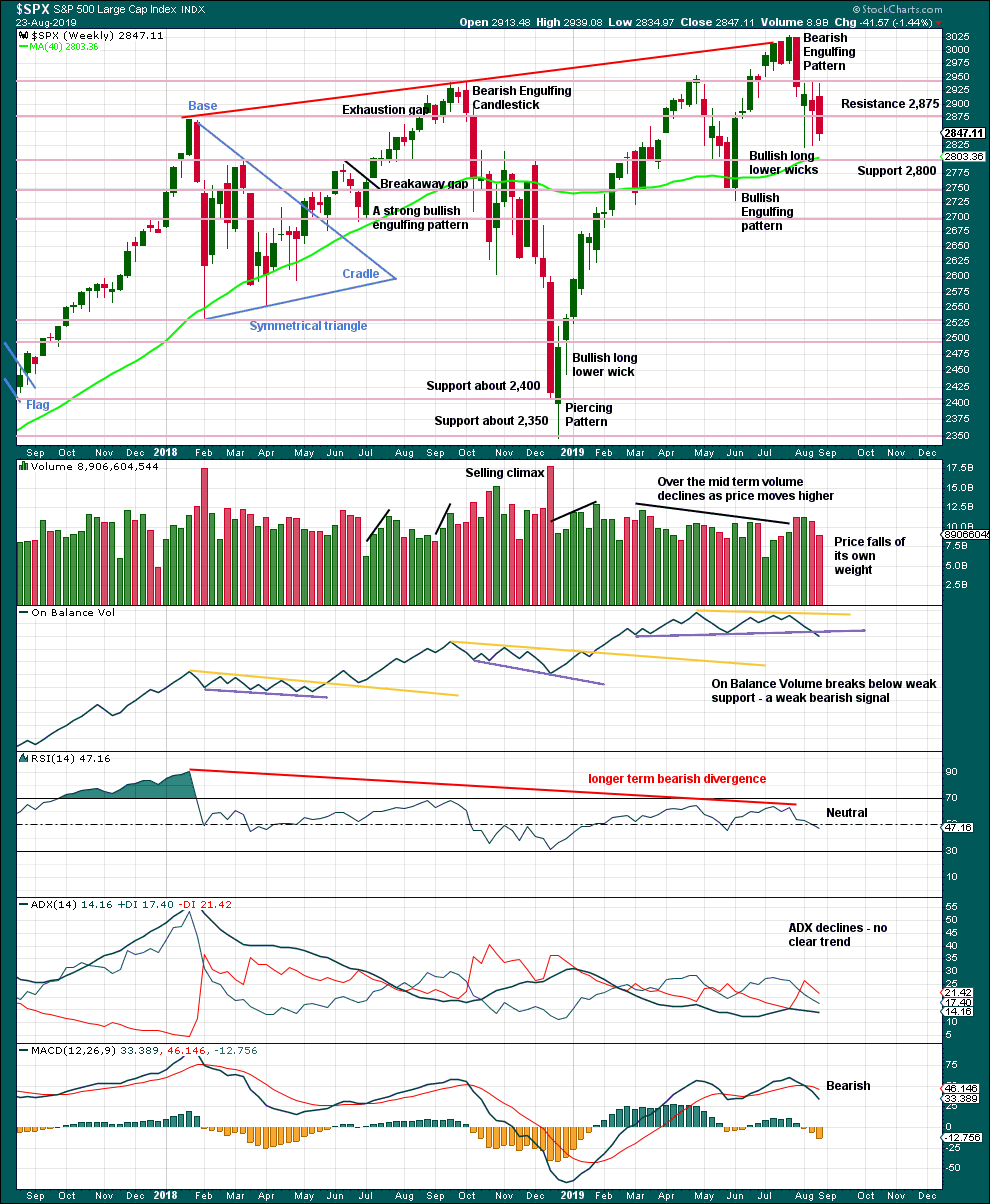
Click chart to enlarge. Chart courtesy of StockCharts.com.
Currently, price is range bound with resistance about 2,945 and support about 2,920.
The larger trend is up from the low in December 2018, with a series of higher highs and higher lows. This upwards trend should be assumed to remain while the last swing low at 2,728.81 remains intact.
The signal from On Balance Volume favours the alternate daily Elliott wave counts.
DAILY CHART
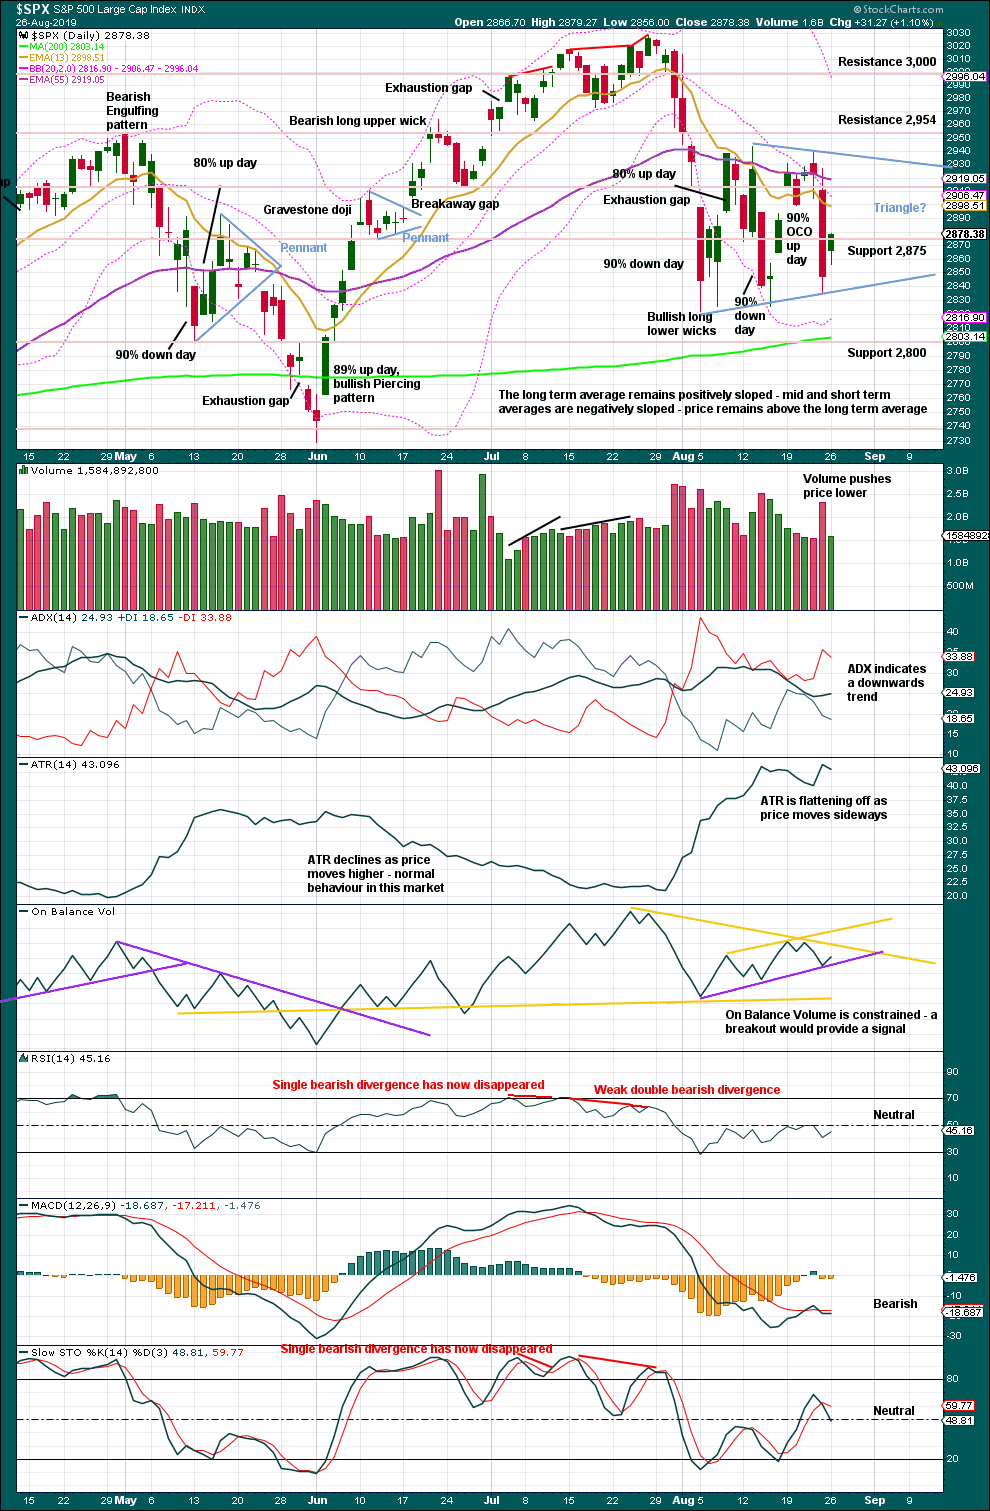
Click chart to enlarge. Chart courtesy of StockCharts.com.
The last low of the 15th of August was preceded immediately by a 90% downward day and followed immediately by a 90% OCO (Operating Companies Only) up day. This is a pattern commonly found at major lows, and it indicates a 180 degree shift in sentiment from bearish to bullish. This favours the main Elliott wave count.
However, today (six sessions later), the lack of any strength in upwards movement is concerning for this view.
A classic triangle may be completing. Classic triangles have an important difference to Elliott wave triangles. While Elliott wave triangles are always continuation patterns, classic triangles may be either continuation or reversal patterns. A breakout either above or below the triangle trend lines is required before the next direction can be known. At that stage, a target using the triangle width added to the breakout point may be calculated.
On Balance Volume trend lines are today adjusted.
BREADTH – AD LINE
WEEKLY CHART
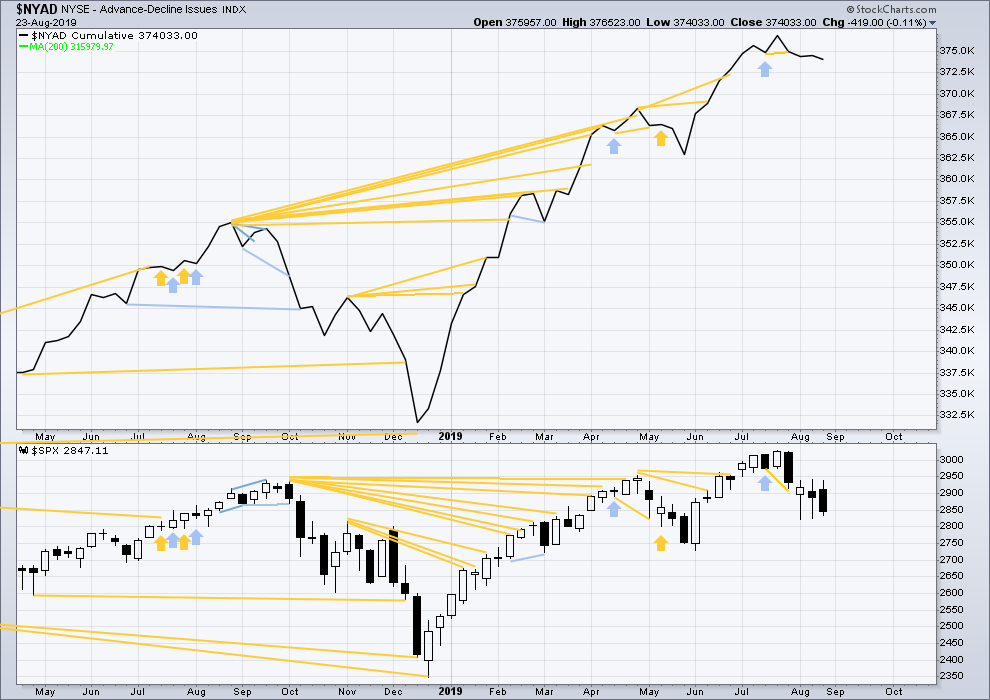
Click chart to enlarge. Chart courtesy of StockCharts.com. So that colour blind members are included, bearish signals
will be noted with blue and bullish signals with yellow.
Bear markets from the Great Depression and onwards have been preceded by an average minimum of 4 months divergence between price and the AD line with only two exceptions in 1946 and 1976. With the AD line making new all time highs again recently, the end of this bull market and the start of a new bear market is very likely a minimum of 4 months away, which is mid November 2019.
In all bear markets in the last 90 years there is some positive correlation (0.6022) between the length of bearish divergence and the depth of the following bear market. No to little divergence is correlated with more shallow bear markets. Longer divergence is correlated with deeper bear markets.
If a bear market does develop here, it comes after no bearish divergence. It would therefore more likely be shallow.
Last week price moved sideways with a red candlestick and the balance of volume downwards. The AD line has slightly declined. There is no new short-term divergence.
DAILY CHART
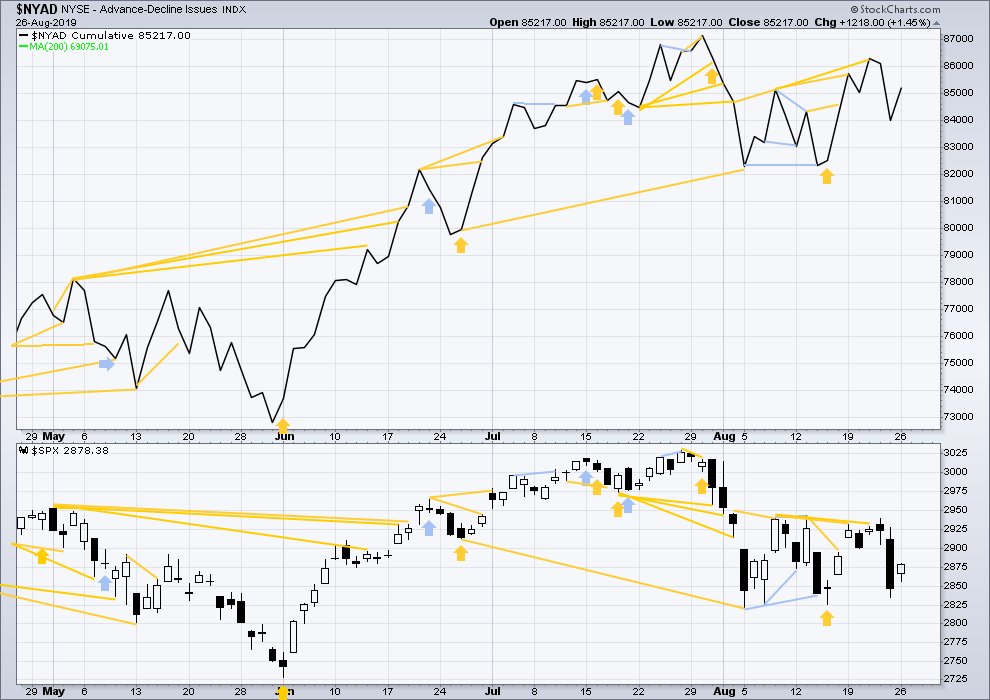
Click chart to enlarge. Chart courtesy of StockCharts.com. So that colour blind members are included, bearish signals
will be noted with blue and bullish signals with yellow.
Breadth should be read as a leading indicator.
The AD line has made another new high above the prior high of the 13th of August, but price has not. This divergence is bullish and still supports the main Elliott wave count.
Today both price and the AD line have moved slightly higher but neither have made new short-term swing highs. There is no new short-term divergence.
VOLATILITY – INVERTED VIX CHART
WEEKLY CHART
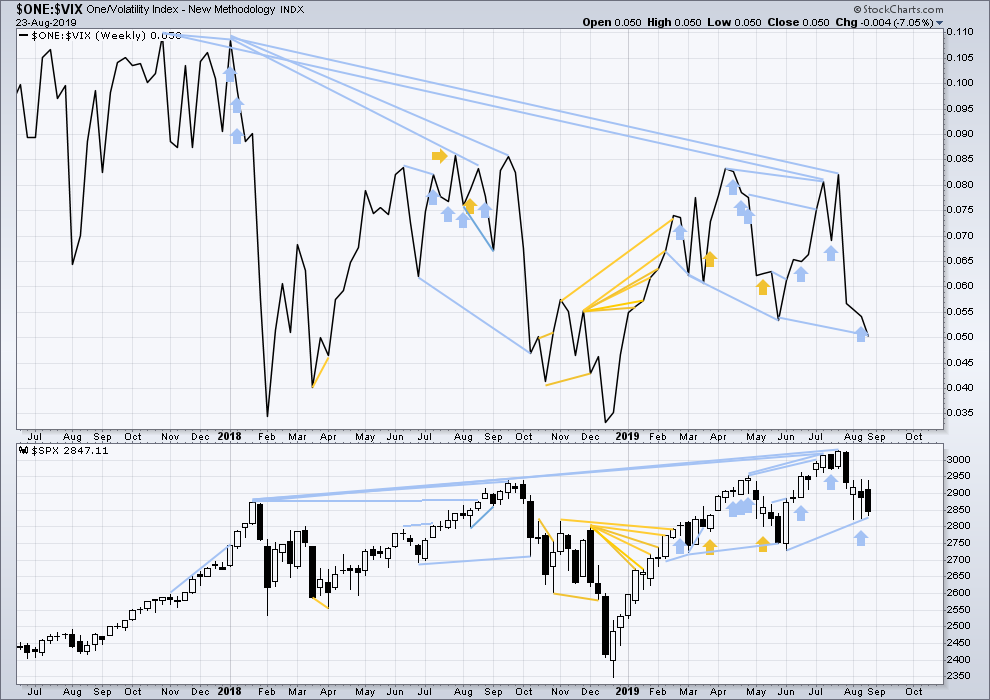
Click chart to enlarge. Chart courtesy of StockCharts.com. So that colour blind members are included, bearish signals
will be noted with blue and bullish signals with yellow.
The all time high for inverted VIX (which is the same as the low for VIX) was on 30th October 2017. There is now nearly one year and nine months of bearish divergence between price and inverted VIX.
The rise in price is not coming with a normal corresponding decline in VIX; VIX remains elevated. This long-term divergence is bearish and may yet develop further as the bull market matures.
This divergence may be an early warning, a part of the process of a top developing that may take years. It may not be useful in timing a trend change.
Last week price moved lower within the week. Inverted VIX has made a new swing low below the prior low of the week of the 28th of May, but price has not. This divergence is bearish and supports the alternate Elliott wave counts; but because it is not confirmed by the AD line, it is given little weight in this analysis. Note that this happened recently with prior divergence between swing lows, which was shortly after followed by upwards movement to the last all time high.
DAILY CHART
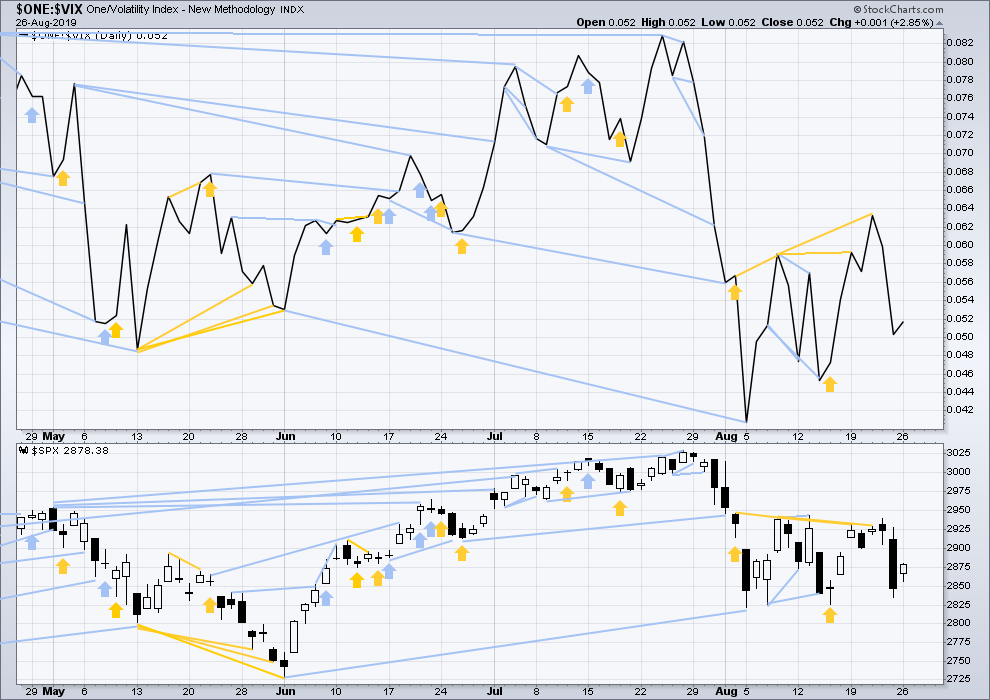
Click chart to enlarge. Chart courtesy of StockCharts.com. So that colour blind members are included, bearish signals
will be noted with blue and bullish signals with yellow.
Inverted VIX made a new high above the prior high of the 13th of August, but price has not. This divergence is still bullish and confirms the bullish signal from the AD line. This supports the main Elliott wave count.
Today both inverted VIX and price have moved slightly higher. Neither have made new short-term swing highs. There is no new divergence.
DOW THEORY
Dow Theory confirmed a bear market in December 2018. This does not necessarily mean a bear market at Grand Super Cycle degree though; Dow Theory makes no comment on Elliott wave counts. On the 25th of August 2015 Dow Theory also confirmed a bear market. The Elliott wave count sees that as part of cycle wave II. After Dow Theory confirmation of a bear market in August 2015, price went on to make new all time highs and the bull market continued.
DJIA: 23,344.52 – a close on the 19th of December at 23,284.97 confirms a bear market.
DJT: 9,806.79 – price has closed below this point on the 13th of December.
S&P500: 2,532.69 – a close on the 19th of December at 2,506.96 provides support to a bear market conclusion.
Nasdaq: 6,630.67 – a close on the 19th of December at 6,618.86 provides support to a bear market conclusion.
With all the indices having moved higher following a Dow Theory bear market confirmation, Dow Theory would confirm a bull market if the following highs are made:
DJIA: 26,951.81 – a close above this point has been made on the 3rd of July 2019.
DJT: 11,623.58 – to date DJT has failed to confirm an ongoing bull market.
S&P500: 2,940.91 – a close above this point was made on the 29th of April 2019.
Nasdaq: 8,133.30 – a close above this point was made on the 26th of April 2019.
Published @ 10:52 p.m. EST.
—
Careful risk management protects your trading account(s).
Follow my two Golden Rules:
1. Always trade with stops.
2. Risk only 1-5% of equity on any one trade.
—
New updates to this analysis are in bold.
second alternate hourly chart updated
for the triangle, minor E must be a single zigzag. It can’t be a double because only one triangle sub-wave may do that, and minor C already did.
also, minor E should fall short of the A-C trend line most likely, but not too short, it’s not high enough yet to have a normal look
first alternate hourly chart updated
TBH this upwards movement fits this count best, a double zigzag has best proportions
🙂
love it
Main hourly chart updated:
Look for smart VaR long traders to exit soon.
It will propel VIX past 22 when they start to unwind….or seriously hedge…
Current battle around former support shelf around 2875, now resistance.
An impulsive fall away from it will alert traders new lows on the way. A close above it is short term bullish…
Impulsive rejection in ES…. 🙂
Looks like we will have a bearish engulfing candle following an inside day stick.
Have a great evening everyone!
Very typical price action in move up to test area of filled gap…or am I missing somethin’…? 😀
The mercilessly beaten down VIX snake coiling for a strike…!
I don’t know. It’s a real ping-pong market here, and it may be time to go the other way. The 62% target for a little correction and pivot identified by Lara in the main was approached today and the pivot is in for the moment. I would not be surprised by ANY action over the remaining couple of days, with “most likely” being listless sideways type action. I don’t think this market is predictable at all right now. Reactive only and only very short term for me.
Charts are pretty clear…
Hi Verne
Good to have you back, but with all due respect, at this stage, no they’re not.
I dare say you both are correct! 🙂
We’re playing ping pong in a downward trend, with massive face-ripping counter trend rallies…
It’s nice to see this last rally did not take out ES 2882/SPY 288.20. Going back down now…
I am however a bit confused on why USOIL is up over 2% today? :-/
🙂
Another reason why I’m leaning on the alternate wave count here: my own count for RUT shows the intermediate 2 still incomplete, and more downward action needed to finish it up. And markets move together.
Well with SPX to go to 2660s RUT will drop below 1400, so if RUT stops at 1420, I think SPX can make a low in 2800 and turn or r u thinking that we break 2720 in SPX
I didn’t mean to imply with my positioning of the intermediate 2 labels that I expect the bottom there. Only that I expect price to “go deeper” to eventually complete that overall wave down. At the moment I don’t have projections/targets for the ultimate end of intermediate 2 (which might not be an intermediate 2 of course!! This all could be the beginnings of a bear market, not a correction in a bull market).
To put it simply, I don’t know where the lows overall are going to be. I’m focused on catching down swings is all here. And protecting my tail because the counter rallies will be viscous, and who knows, this could still be a bull market per the main.
Ok cool, great way
And great trading, closing at the lowd
I got in on the short side a bit earlier, Sept 30 high negative delta in the money puts (strike 299). We will see…
SPY puts I meant to say.
But along the way here today I took my profits in the SPY puts and moved my position to IWM puts, given RUT is weaker both today and in general than SPX. RUT likes 50% levels as pivots and one is approaching at 1444.
And the 62% retrace level in SPX at 2860 very likely to turn this market today, IMO, around the same time RUT hits 1444.
Bailed very close to the low. Sweet. Didn’t quite make it to my expected levels. Love hair ball infused intra-day trading…when the market goes my way!
Holding 295 strike puts. I rolled down from 305 strike puts snagged at the July 27 302 high after the lower daily high seemed to be signaling an C wave ED truncation.
Those October 18 305 strike puts traded for 8.45!!!! Truly amazing!
We didn’t even get to 2900… That’s pretty bearish. The reason I say that is because when the waterfall selling started on Friday, 2900 was the top range of a volume vacuum which started from 2900 all the way down to 2882.
Price “should have” easily gotten up to 2900 for that reason. It didn’t even do it in the ES overnight contracts… Bearish, bearish, bearish!
Speaking of bears, FAANG stocks about to get de-clawed! lol 🙂
It used to be that when price took more time to retrace (fib levels) a clearly impulsive decline one could be reasonably sure the upward move was corrective of the decline. CB intervention over the years grossly distorted price action and made such assumptions risky. We have all seen the interminable “slow grind” higher. Perhaps things may be heading back to normalcy…?
anyone else think SBUX is absurdly over priced after doubling in the last year? And might be a powerful short in the next market correction? I’m a-thinkin’ something like that. A fruit ripe for a fall. It’s overall 1 year price curve is exponential shaped, and it looks like it might be cooked now.
so I bought a very cheap ($19) unbalanced ‘fly, 89/90/92, for Sept 20. profit below 91.86, peak of $170 at 90, and $83 at anything under about 88.9. I like it. A good gamble.
Explain your fly pls . i looked at SBUX a week a go and I did an Oct Put spread 95 / 85
I used Sept 20 expiry puts. For each fly I bought, I:
– Sold 2 puts at strike 90.
– Bought 1 put at strike 89
– Bought 1 put at stroke 92
That’s an unbalanced (“broken wing”) butterfly. I lose what I paid ($19/fly) if price is above about 91.86 on Sept 20 close. I profit on anything below that, with the peak profit at a price of 90 on Sept 20.
I like that vertical you used, too.
got it thank you .
I am taking a more aggressive approach using round number S/R pivots.
I will hold 295 puts as long as price holds below 290 on a closing basis. Will roll to 285 on any close below 280….etc. ,
Yep. Look at how far beyond its 5 yearly EMA it’s trading…price level is going to see a nasty RTM decline…not IF, just WHEN….great swing short imho…
yea I’m gonna add something like Fred’s spread, but only after the very recent range is cracked to the downside. I want some confirming evidence of a downmove before adding risk. I like butterflies for more speculative plays because of their much lower risk/higher payoff structure.
Oops!
..
..
_
I saw your post about that CNBC article. Thanks for looking into that Kevin. I was just posting the headline, and I’m glad it has no merit.
This choppy action is starting to eerily resemble the December 10th week like you’ve been mentioning. I’m ready to short around 2910-2925 area if we get up there. I’m starting to favor the second alternate triangle count.
I’m still cautious though for an upwards breakout from nowhere… very tight stops! However volume should be lighter as the week approaches a 3 day Labor Day long wknd… if markets are gonna break,it’ll likely be next week.
Happy Tuesday 🙂