
Upwards movement remains below the short-term invalidation point. The Elliott wave counts are swapped over today after analysis of internal volume and breadth in the last two sessions.
Summary: Lowry’s data now shows Friday as a 90% OCO (Operating Companies Only) up day. Today is a near 80% up day. Conditions are now suggesting a sustainable low may be in place. The next target is 3,120. The wave counts are swapped over.
A new low below 2,822.12 would indicate a continuing deeper pullback. The first target would then be at 2,663.
The biggest picture, Grand Super Cycle analysis, is here.
Monthly charts were last published here, with video here. There are two further alternate monthly charts here, with video here.
ELLIOTT WAVE COUNTS
The two weekly Elliott wave counts below will be labelled First and Second. They may be about of even probability. When the fifth wave currently unfolding on weekly charts may be complete, then these two wave counts will diverge on the severity of the expected following bear market. To see an illustration of this future divergence monthly charts should be viewed.
FIRST WAVE COUNT
WEEKLY CHART
Click chart to enlarge.
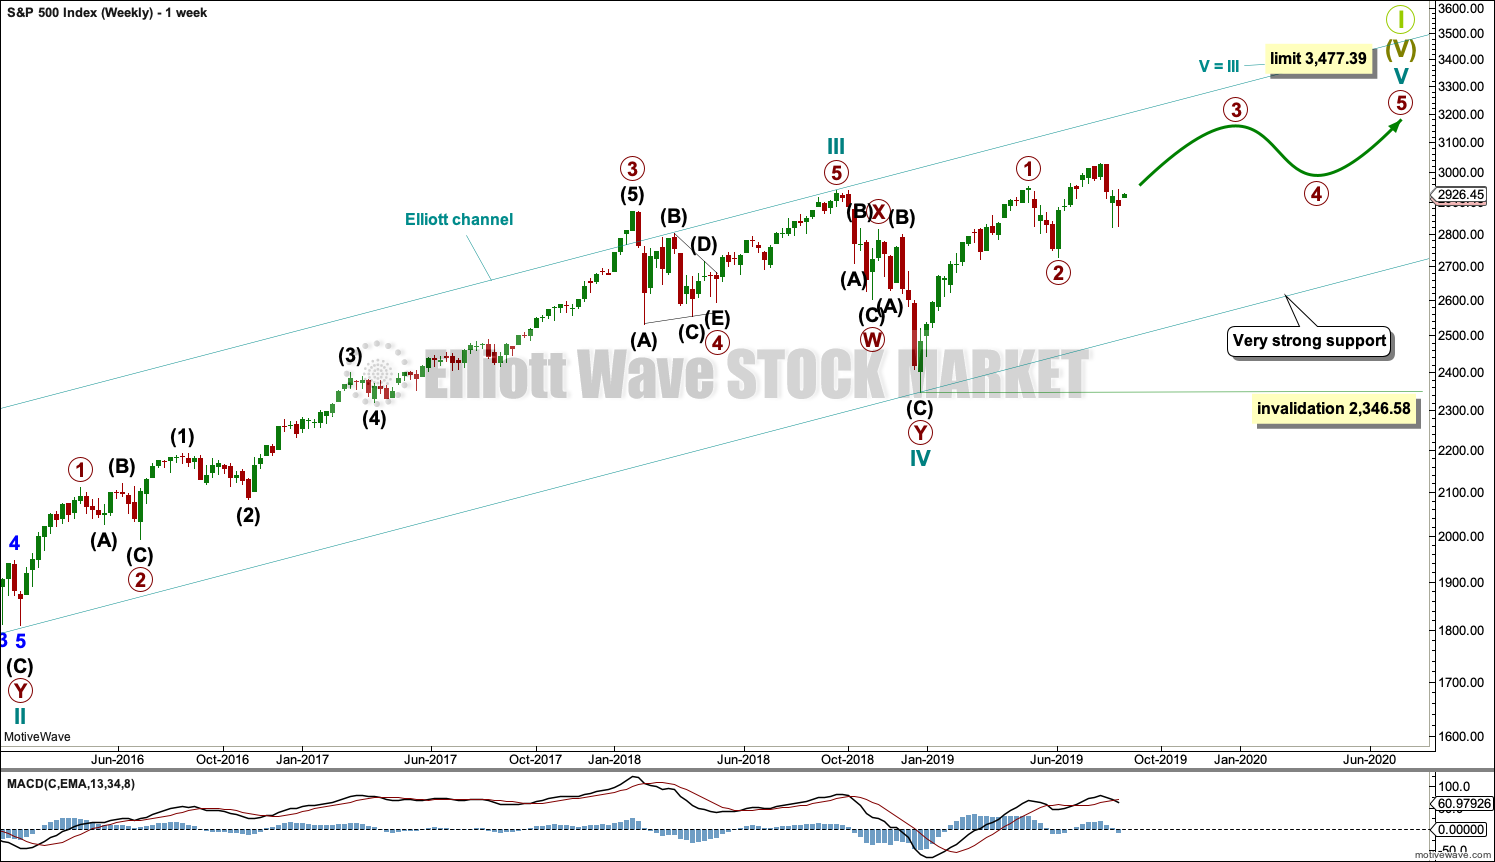
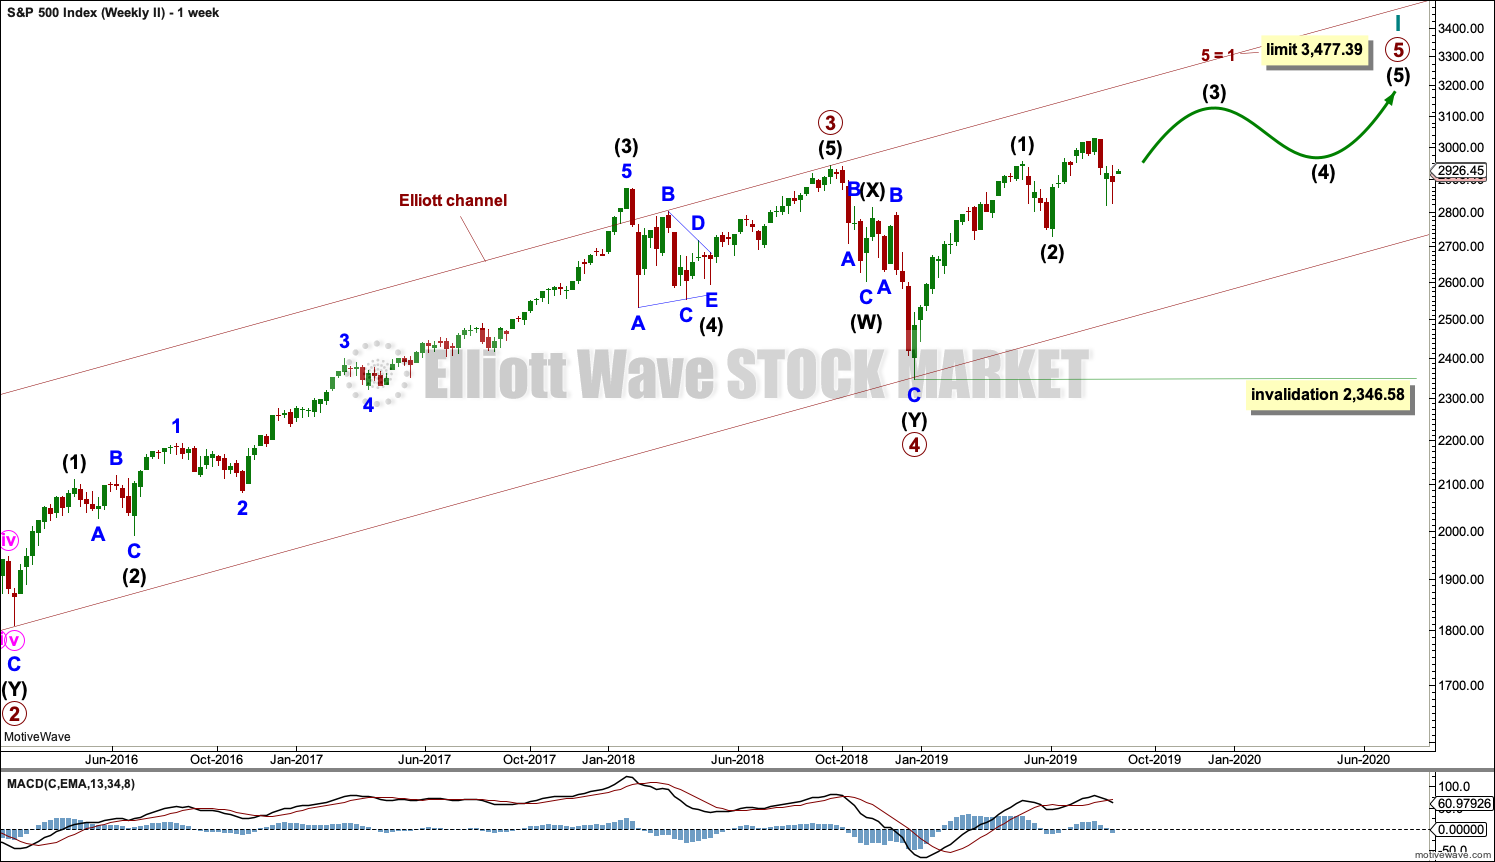
The basic Elliott wave structure consists of a five wave structure up followed by a three wave structure down (for a bull market). This wave count sees the bull market beginning in March 2009 as an incomplete five wave impulse and now within the last fifth wave, which is labelled cycle wave V. This impulse is best viewed on monthly charts. The weekly chart focusses on the end of it.
Elliott wave is fractal. This fifth wave labelled cycle wave V may end a larger fifth wave labelled Super Cycle wave (V), which may end a larger first wave labelled Grand Super Cycle wave I.
The teal Elliott channel is drawn using Elliott’s first technique about the impulse of Super Cycle wave (V). Draw the first trend line from the end of cycle wave I (off to the left of the chart, the weekly candlestick beginning 30th November 2014) to the end of cycle wave III, then place a parallel copy on the end of cycle wave II. This channel perfectly shows where cycle wave IV ended at support. The strongest portion of cycle wave III, the end of primary wave 3, overshoots the upper edge of the channel. This is a typical look for a third wave and suggests the channel is drawn correctly and the way the impulse is counted is correct.
Within Super Cycle wave (V), cycle wave III is shorter than cycle wave I. A core Elliott wave rule states that a third wave may never be the shortest. For this rule to be met in this instance, cycle wave V may not be longer in length than cycle wave III. This limit is at 3,477.39.
Cycle wave V may subdivide either as an impulse or an ending diagonal. Impulses are much more common. This main wave count expects that cycle wave V may be unfolding as an impulse.
The daily charts below will now focus on all of cycle wave V.
In historic analysis, two further monthly charts have been published that do not have a limit to upwards movement and are more bullish than this wave count. Members are encouraged to consider those possibilities (links below summary) alongside the wave counts presented on a daily and weekly basis.
MAIN DAILY CHART
Click chart to enlarge.
There is now enough support from classic technical analysis to again consider this the main wave count.
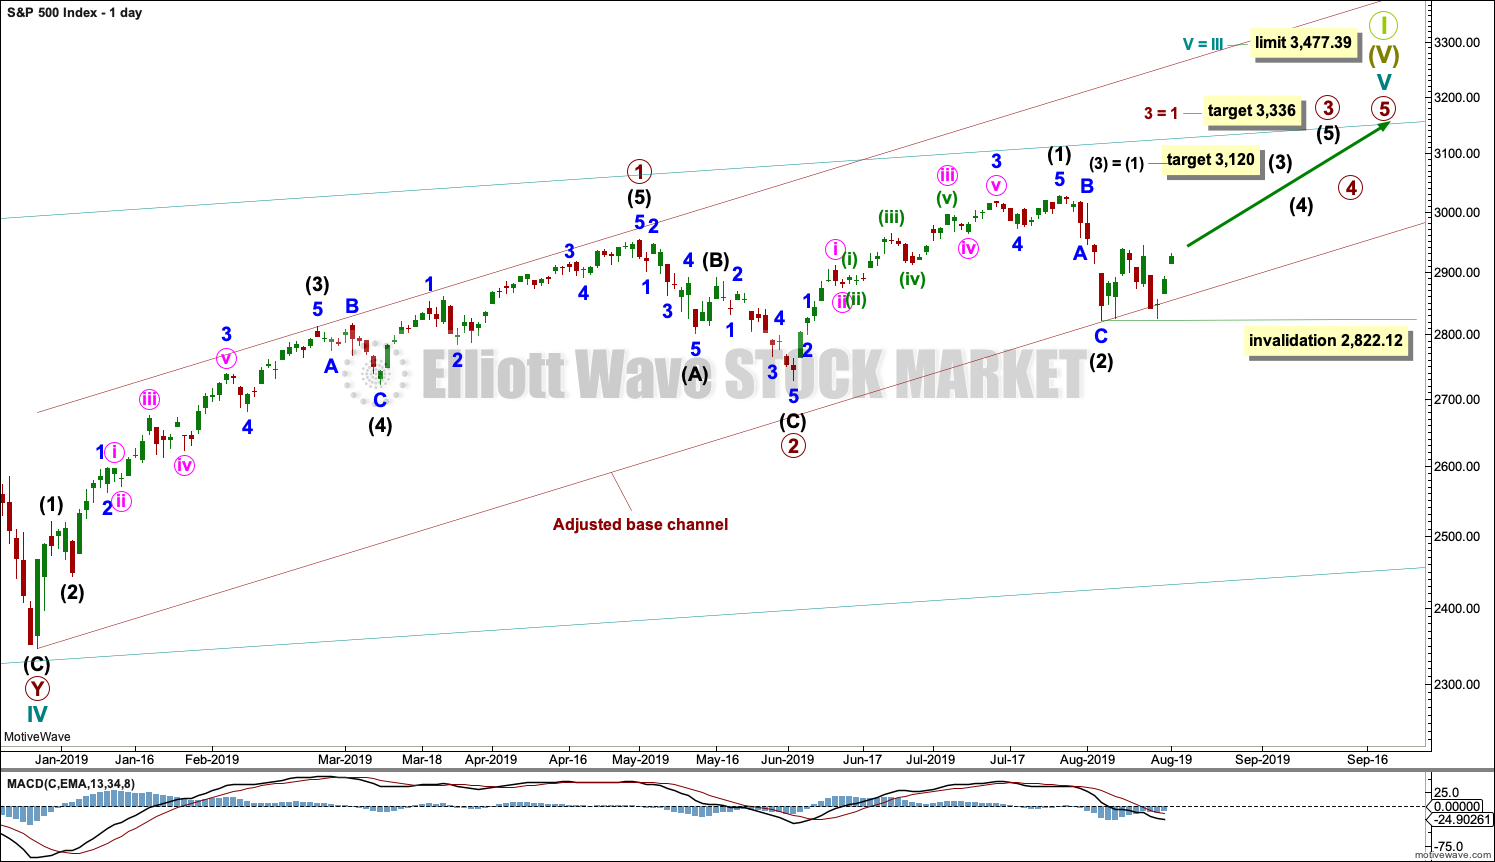
Cycle wave V is seen as an impulse for this wave count.
Within cycle wave V, primary waves 1 and 2 may be complete. Primary wave 3 may have begun.
Primary wave 3 may only subdivide as an impulse. Within primary wave 3, intermediate waves (1) and (2) may be complete.
Intermediate wave (3) may have begun. Intermediate wave (3) may only subdivide as an impulse. Within the impulse of intermediate wave (3), minor wave 2 may not move beyond the start of minor wave 1 below 2,822.12.
MAIN HOURLY CHART
Click chart to enlarge.
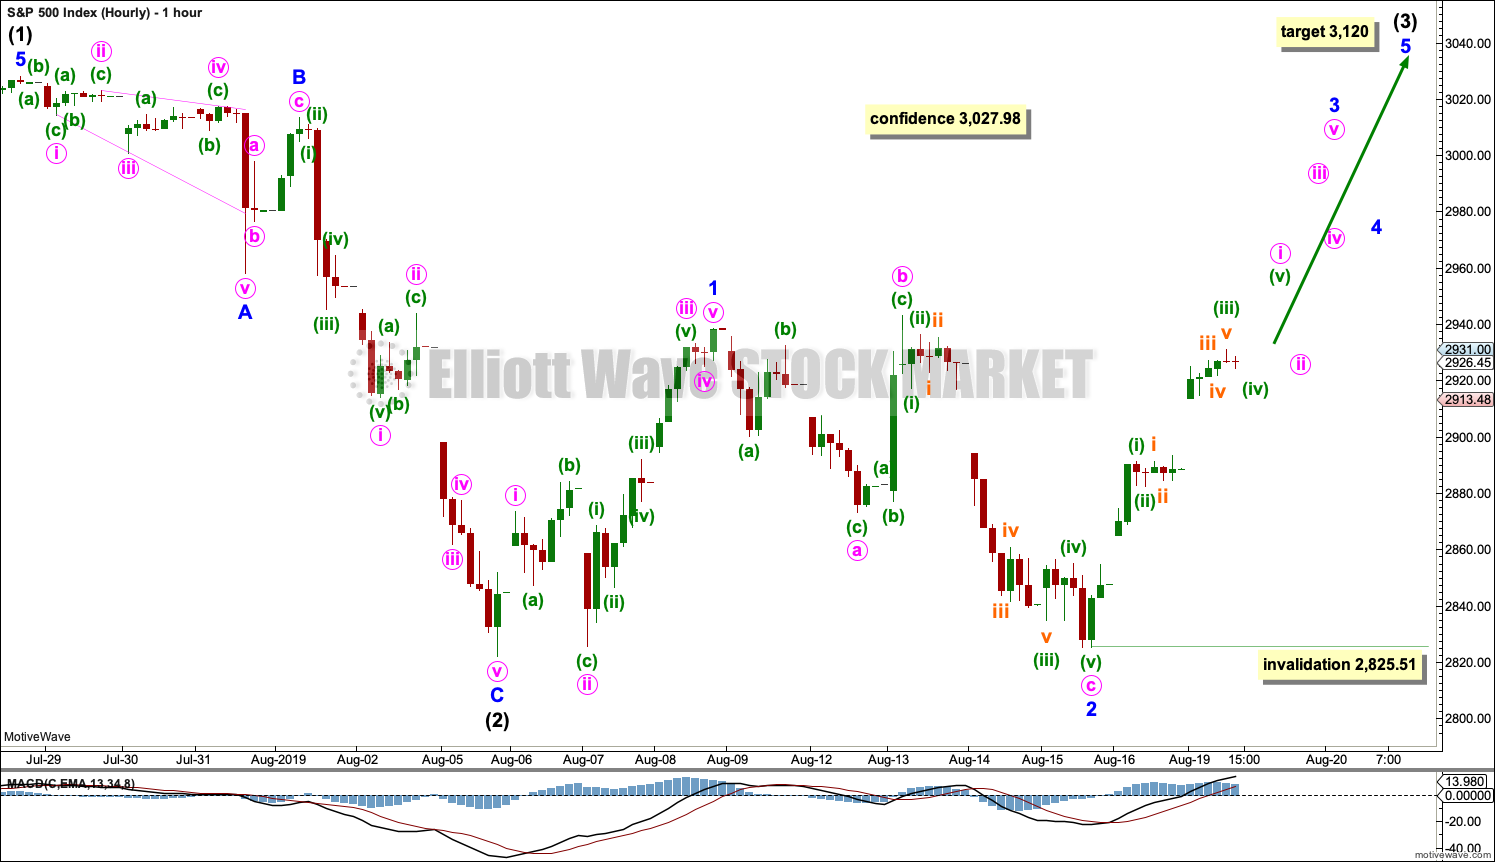
Intermediate wave (2) is shown as a completed single zigzag.
Intermediate wave (3) may only subdivide as a five wave impulse. Within intermediate wave (3), minor waves 1 and 2 may now be complete. Minor wave 3 may only subdivide as a five wave impulse. Within minor wave 3, minute wave ii may not move beyond the start of minute wave i below 2,825.51.
Minute wave iii must move beyond the end of minute wave i. Minute wave iii must move far enough above the end of minute wave i to allow room for minute wave iv to unfold and remain above first wave price territory.
ALTERNATE DAILY CHART
Click chart to enlarge.
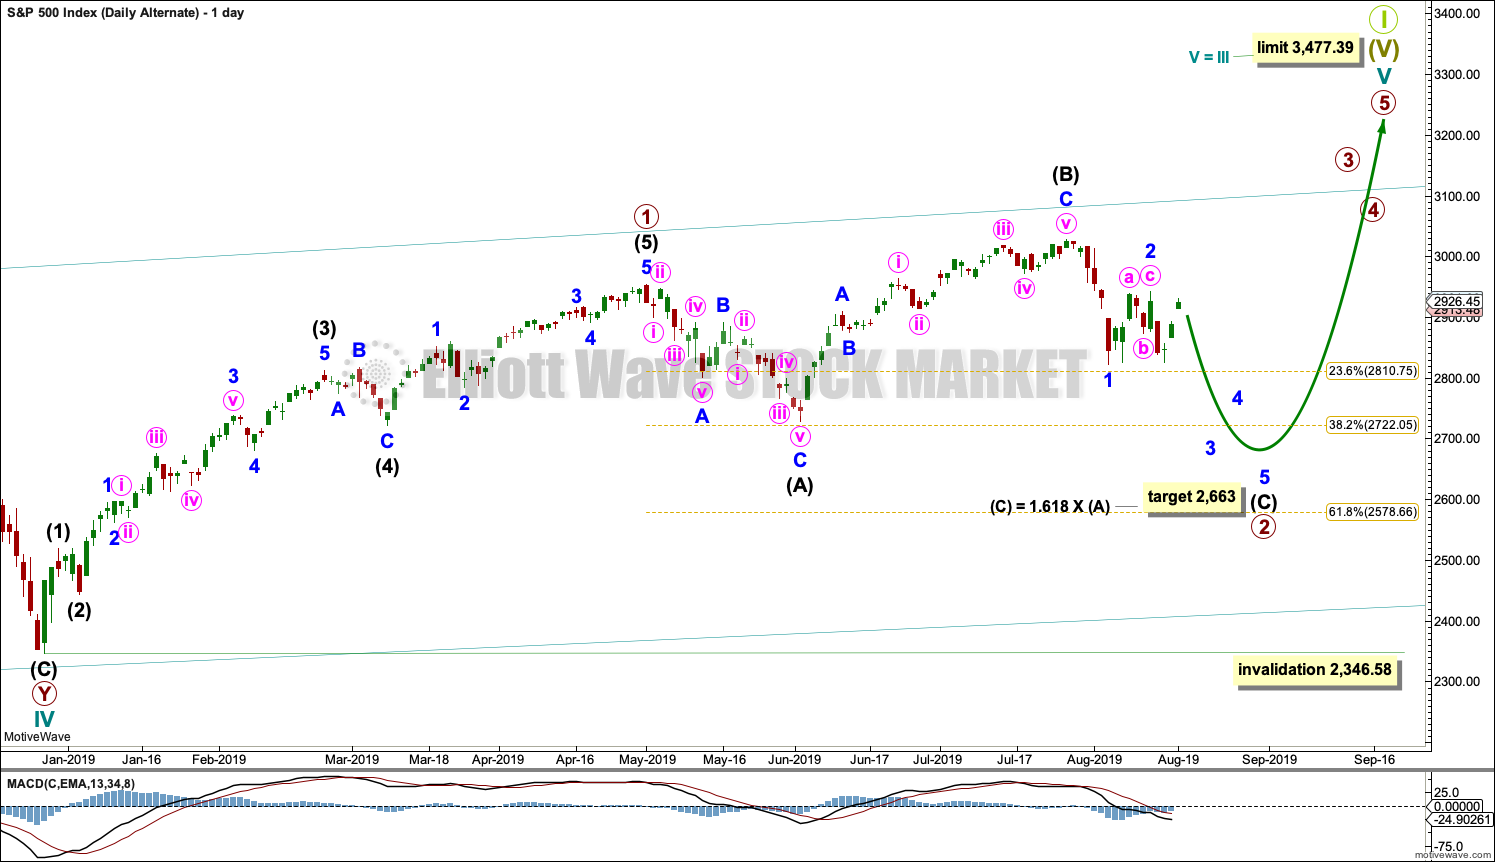
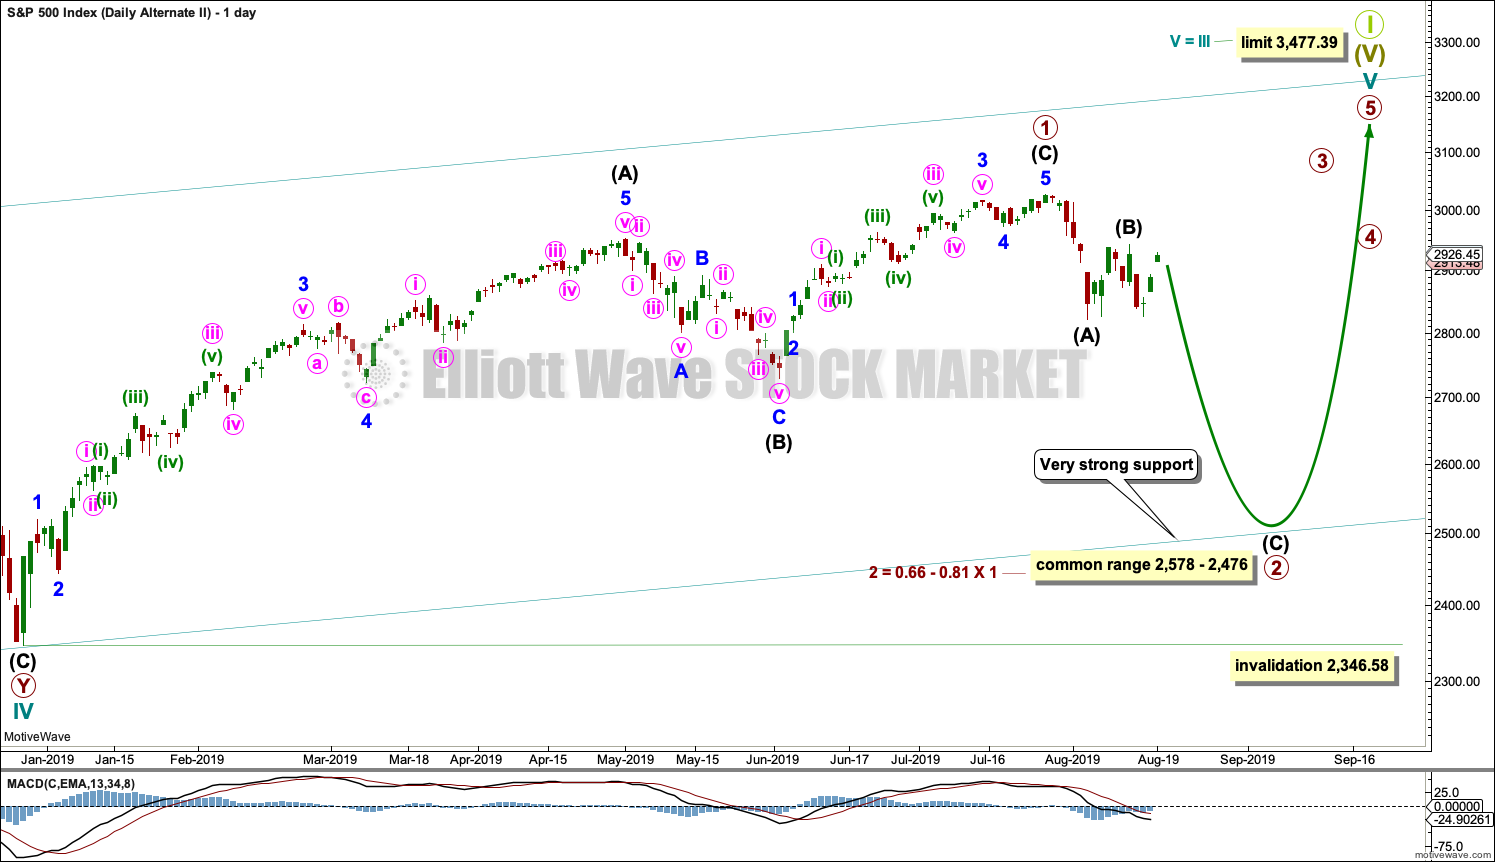
This first alternate wave count considers the possibility that cycle wave V may be unfolding as an impulse.
Cycle wave V must subdivide as a five wave motive structure. Within that five wave structure, primary wave 1 only may be complete.
Primary wave 2 may be unfolding as an expanded flat correction. These are reasonably common Elliott wave corrective structures. Flat corrections subdivide 3-3-5. Expanded flats have B waves which are 1.05 or more the length of their A waves. In this example for primary wave 2, intermediate wave (B) is a 1.33 length of intermediate wave (A). The target for intermediate wave (C) expects it to exhibit the most common Fibonacci Ratio to intermediate wave (A) within an expanded flat.
If price reaches the target at 2,663 and keeps falling, then the next target would be the 0.618 Fibonacci Ratio of primary wave 1 at 2,578.66.
Primary wave 2 may not move beyond the start of primary wave 1 below 2,346.58.
SECOND ALTERNATE DAILY CHART
Click chart to enlarge.
This second alternate daily chart considers the other structural possibility for cycle wave V, that of an ending diagonal.
All sub-waves within an ending diagonal must subdivide as zigzags. Primary wave 1 may have been complete as a zigzag at the last all time high on the 26th of July.
Primary wave 2 may be continuing lower as a zigzag.
Within diagonals, sub-waves 2 and 4 are normally very deep, ending within a range of 0.66 to 0.81 the prior wave. This range for primary wave 2 is from 2,578 to 2,476. Primary wave 2 may possibly come as low as the lower edge of the teal channel, which is copied over from the weekly chart.
Primary wave 2 may not move beyond the start of primary wave 1 below 2,346.58.
SECOND WAVE COUNT
WEEKLY CHART
Click chart to enlarge.
This weekly chart is almost identical to the first weekly chart, with the sole exception being the degree of labelling.
This weekly chart moves the degree of labelling for the impulse beginning in March 2009 all down one degree. This difference is best viewed on monthly charts.
The impulse is still viewed as nearing an end; a fifth wave is still seen as needing to complete higher. This wave count labels it primary wave 5.
TECHNICAL ANALYSIS
WEEKLY CHART
Click chart to enlarge. Chart courtesy of StockCharts.com.
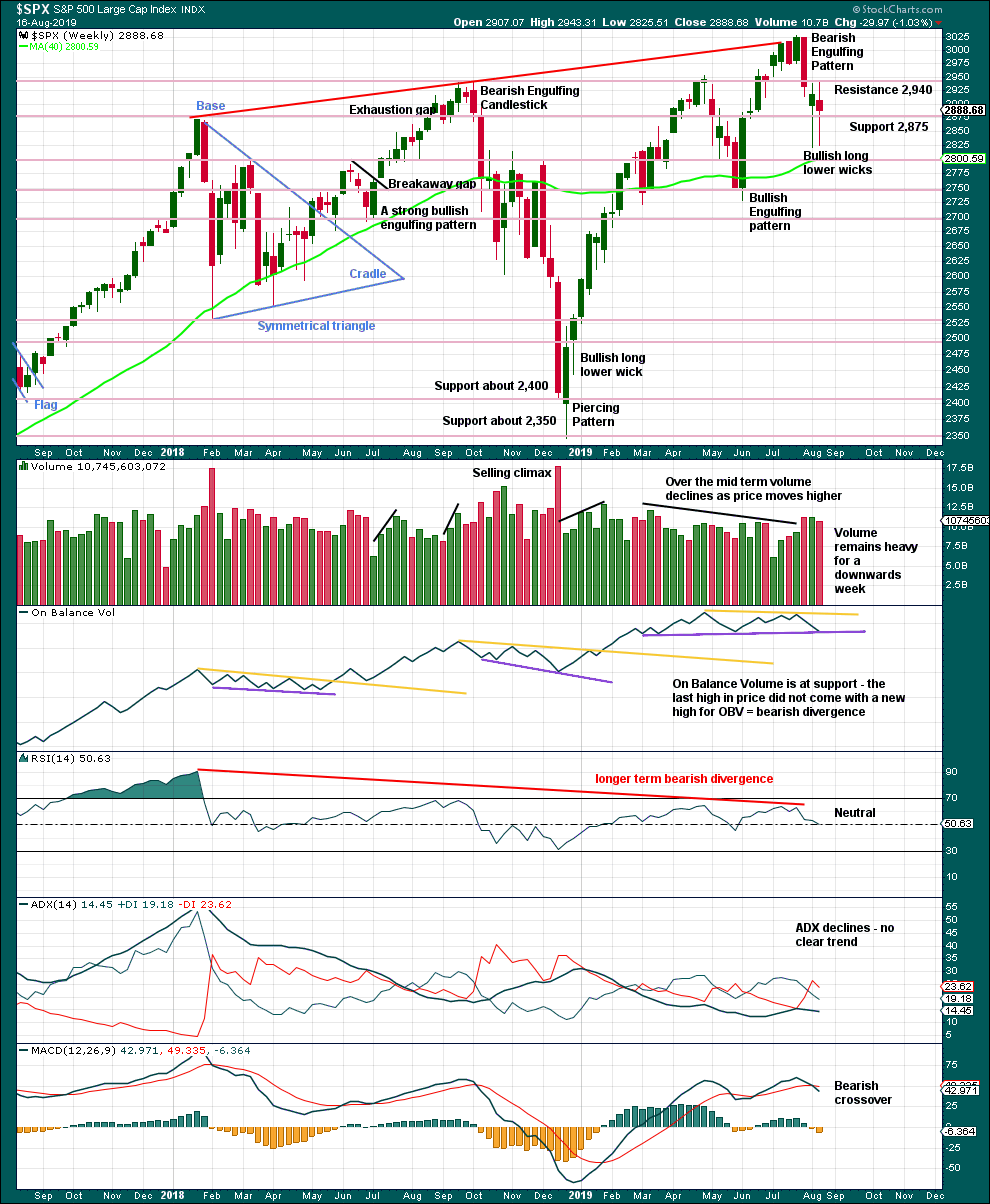
Last weekly candlestick completes an upwards week with a slightly higher high and a slightly higher low, but the balance of volume is down and the candlestick is red. Long lower wicks and On Balance Volume at support suggest the downside here may now be limited.
DAILY CHART
Click chart to enlarge. Chart courtesy of StockCharts.com.
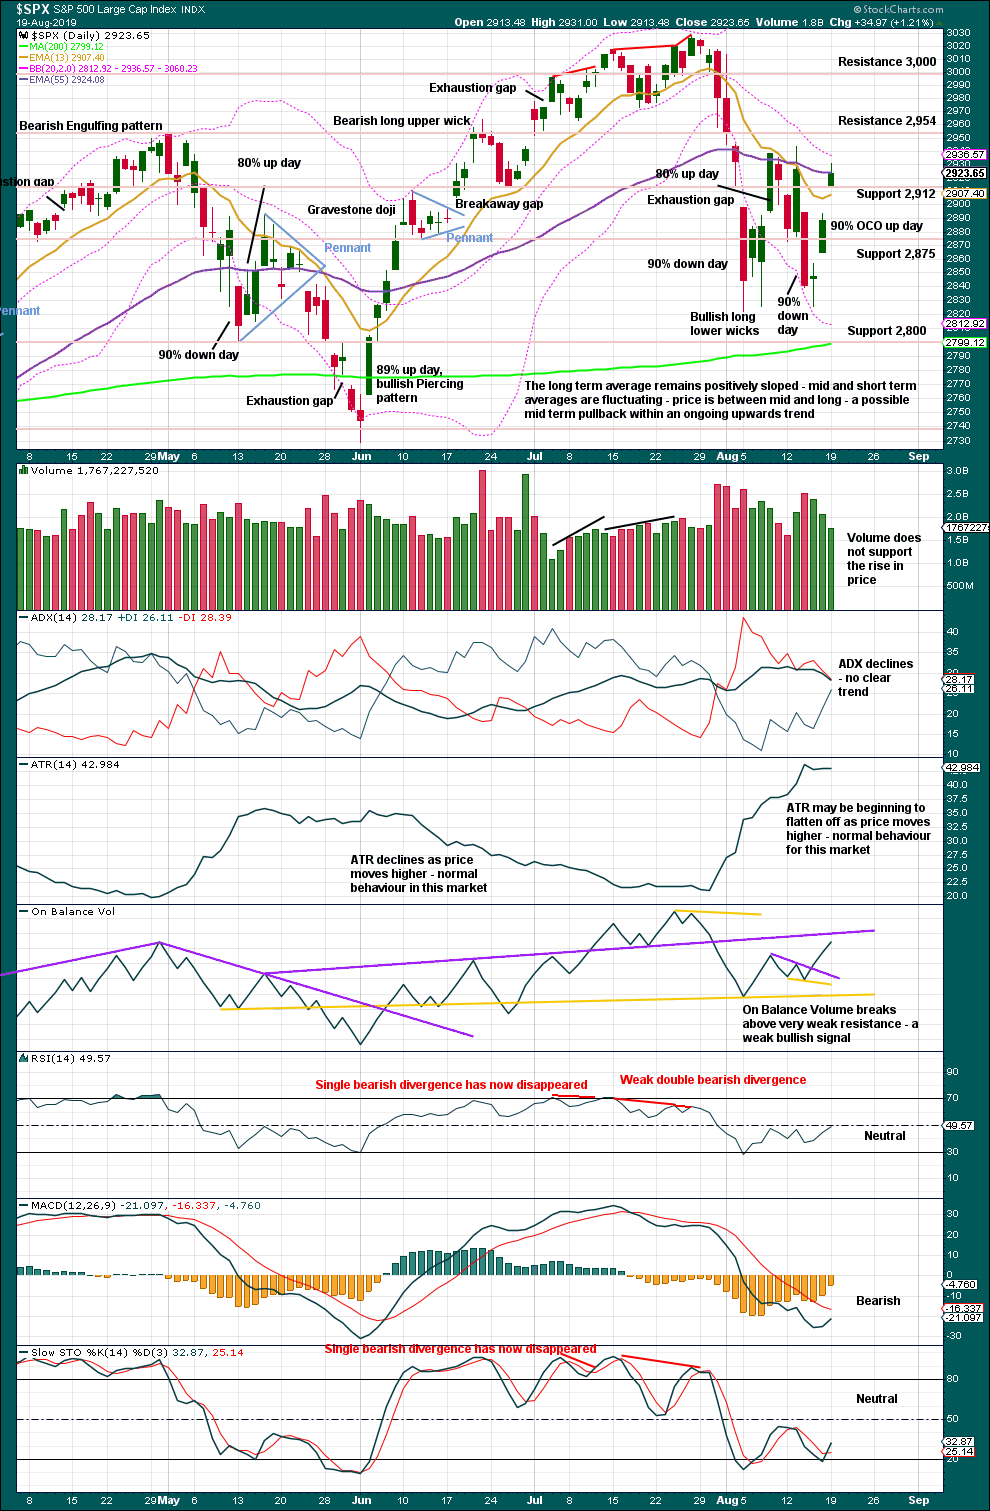
Lowry’s data now indicates Friday was a 90% OCO up day. Monday is a near 80% up day. Conditions for a sustainable low may now be in place, so a more bullish outlook is warranted.
The last two gaps may be pattern gaps as they occur so far within a consolidation zone which has resistance about 2,940 and support about 2,820.
A decline in volume is not of a concern. Price has been rising for years in this market on light and declining volume.
BREADTH – AD LINE
WEEKLY CHART
Click chart to enlarge. Chart courtesy of StockCharts.com. So that colour blind members are included, bearish signals
will be noted with blue and bullish signals with yellow.
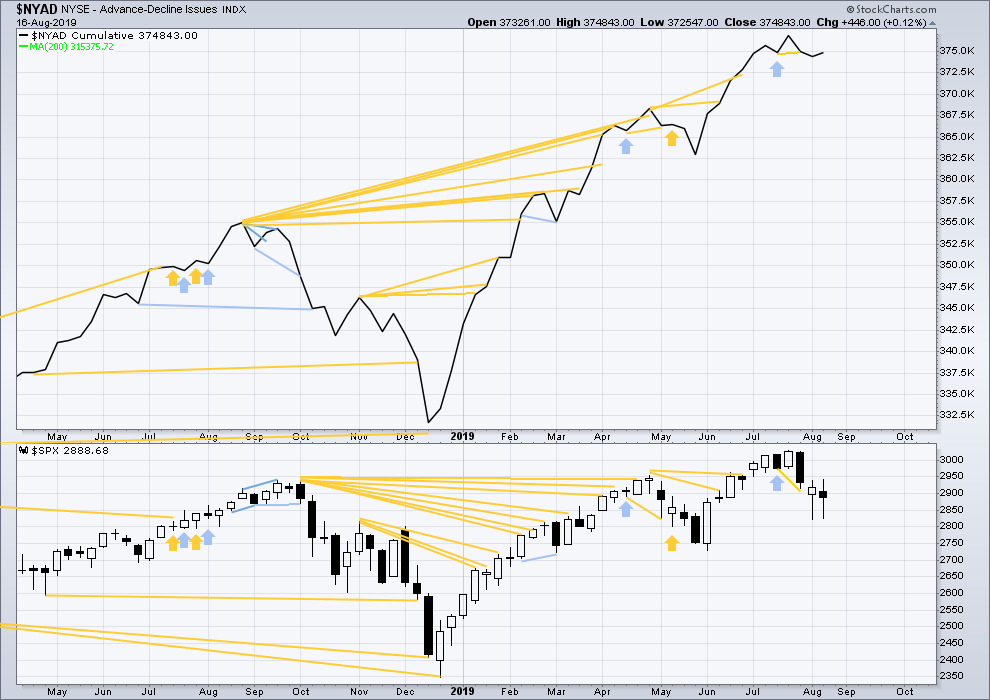
Bear markets from the Great Depression and onwards have been preceded by an average minimum of 4 months divergence between price and the AD line with only two exceptions in 1946 and 1976. With the AD line making new all time highs again this week, the end of this bull market and the start of a new bear market is very likely a minimum of 4 months away, which is mid November 2019.
In all bear markets in the last 90 years there is some positive correlation (0.6022) between the length of bearish divergence and the depth of the following bear market. No to little divergence is correlated with more shallow bear markets. Longer divergence is correlated with deeper bear markets.
If a bear market does develop here, it comes after no bearish divergence. It would therefore more likely be shallow.
Last week both the AD line and price have moved slightly higher. There is no new short-term divergence.
DAILY CHART
Click chart to enlarge. Chart courtesy of StockCharts.com. So that colour blind members are included, bearish signals
will be noted with blue and bullish signals with yellow.
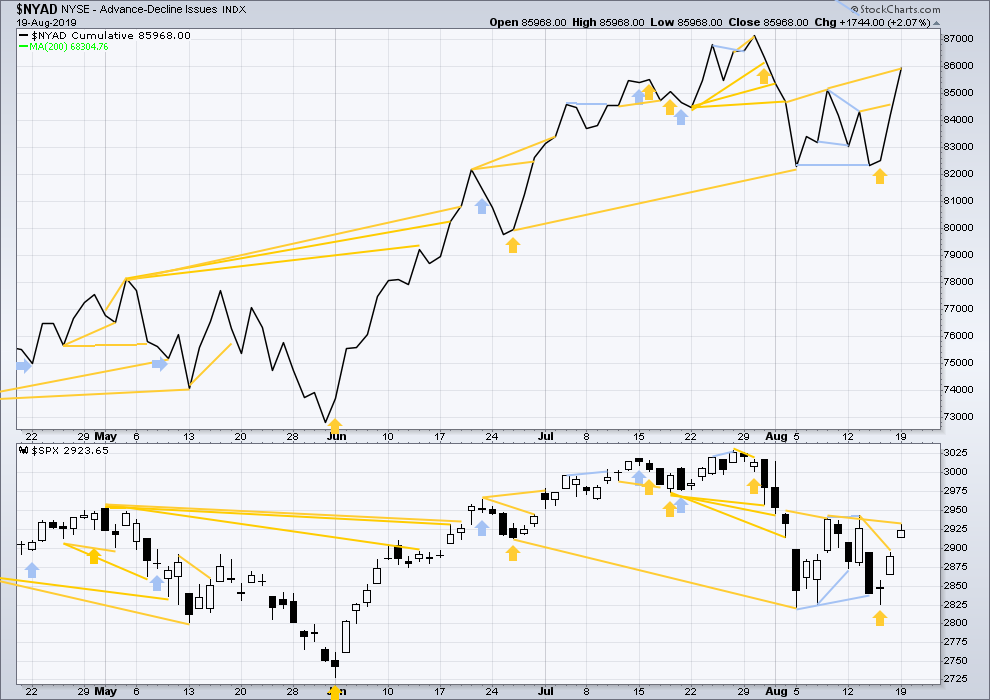
Breadth should be read as a leading indicator.
Bullish divergence noted in last analysis has been followed by upwards movement.
Today the AD line has made a new high above a prior swing high on the 8th of August, but price has not. This divergence is again bullish and supports the new main Elliott wave count.
VOLATILITY – INVERTED VIX CHART
WEEKLY CHART
Click chart to enlarge. Chart courtesy of StockCharts.com. So that colour blind members are included, bearish signals
will be noted with blue and bullish signals with yellow.
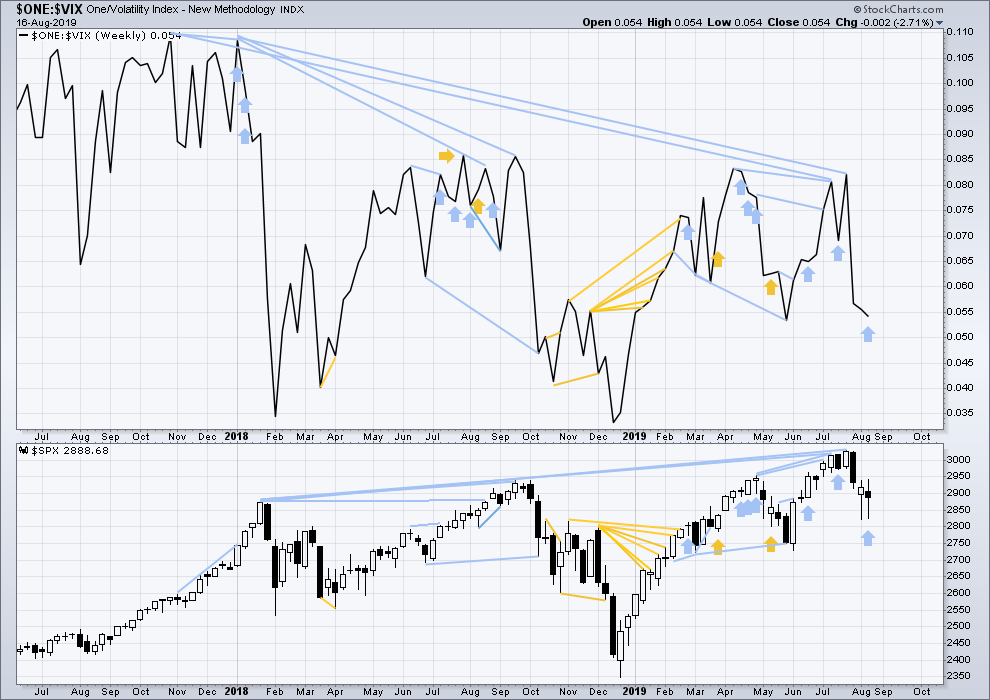
The all time high for inverted VIX (which is the same as the low for VIX) was on 30th October 2017. There is now nearly one year and nine months of bearish divergence between price and inverted VIX.
The rise in price is not coming with a normal corresponding decline in VIX; VIX remains elevated. This long-term divergence is bearish and may yet develop further as the bull market matures.
This divergence may be an early warning, a part of the process of a top developing that may take years. It may not be useful in timing a trend change.
Last week price has moved very slightly higher although the candlestick closed red, but inverted VIX has moved a little lower. This divergence is bearish, but it is contrary to the AD line and shall not be given weight in this analysis.
DAILY CHART
Click chart to enlarge. Chart courtesy of StockCharts.com. So that colour blind members are included, bearish signals
will be noted with blue and bullish signals with yellow.
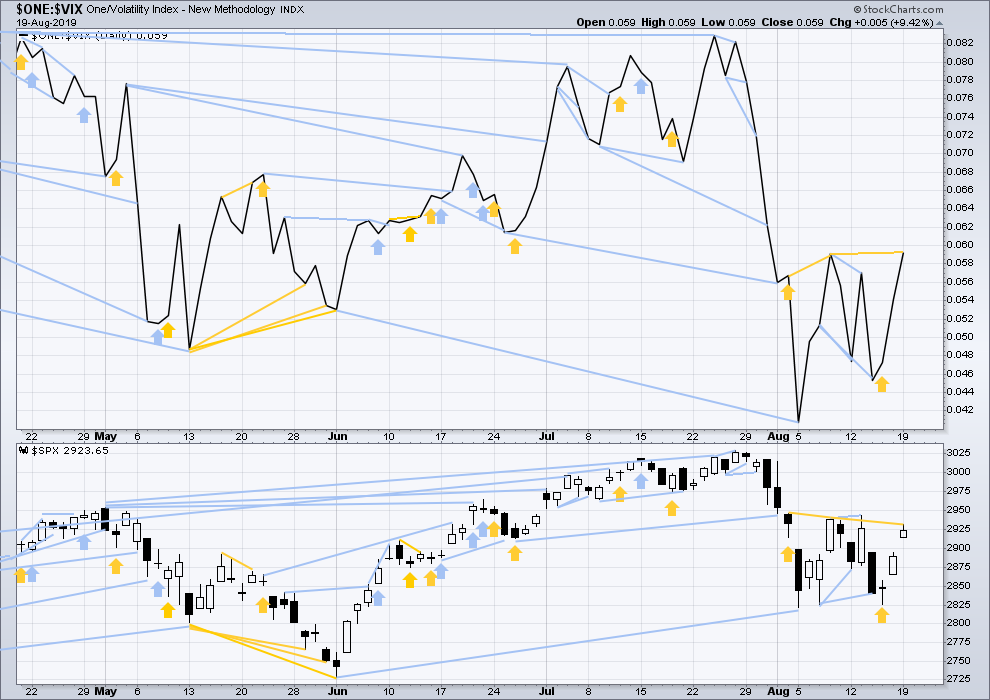
Today inverted VIX has made a slight new swing high above the prior high of the 8th of August, but price has not. This divergence is bullish for the short term and confirms the signal from the AD line today.
DOW THEORY
Dow Theory confirmed a bear market in December 2018. This does not necessarily mean a bear market at Grand Super Cycle degree though; Dow Theory makes no comment on Elliott wave counts. On the 25th of August 2015 Dow Theory also confirmed a bear market. The Elliott wave count sees that as part of cycle wave II. After Dow Theory confirmation of a bear market in August 2015, price went on to make new all time highs and the bull market continued.
DJIA: 23,344.52 – a close on the 19th of December at 23,284.97 confirms a bear market.
DJT: 9,806.79 – price has closed below this point on the 13th of December.
S&P500: 2,532.69 – a close on the 19th of December at 2,506.96 provides support to a bear market conclusion.
Nasdaq: 6,630.67 – a close on the 19th of December at 6,618.86 provides support to a bear market conclusion.
With all the indices having moved higher following a Dow Theory bear market confirmation, Dow Theory would confirm a bull market if the following highs are made:
DJIA: 26,951.81 – a close above this point has been made on the 3rd of July 2019.
DJT: 11,623.58 – to date DJT has failed to confirm an ongoing bull market.
S&P500: 2,940.91 – a close above this point was made on the 29th of April 2019.
Nasdaq: 8,133.30 – a close above this point was made on the 26th of April 2019.
Published @ 12:43 a.m. EST on August 20, 2019.
—
Careful risk management protects your trading account(s).
Follow my two Golden Rules:
1. Always trade with stops.
2. Risk only 1-5% of equity on any one trade.
—
New updates to this analysis are in bold.
Hourly chart updated:
Downwards movement today looks like a new wave from the last high, so I’m labelling minute i over and this as minute ii.
Hmmm, A down and now B up in SPX, all part of a corrective ii wave of some degree? I think so.
The correction at this point has a double bottom, lows around the 21-23% retrace level, and a great Fibonacci structure fit. “Could be it…” though nominally I’d expect the c down to continue on to the 38% giving us a complete zigzag, instead of this funky flat.
And if it does keep pushing down (leaning that way), here are my fitted targets. The one overlapped with the 38% at 2890, which would also be a retest of the broken down trend line, seems very attractive.
That’s where the gap close is from 1-2 days ago. Yes there should be at least some support there.
However, I’m not too convinced yet that this will turn into the bullish scenario just yet. We might take out the ES 2775 lows if we break 2820, which can happen quickly with this headline driven market.
There have been 80% up days and 90% down days.
Either scenario is about 50/50 IMHO. Financials and energy (XLF and XLE) are big parts of SPX and Russell 2000. And both look really weak…
Be careful out there everyone!
I continue to find S/R pivots quite helpful in providing guidance on likely near term price action. I think the bullish case requires reclaim of 2900 in the next 24 hours…I do think the failure of VIX to gap higher on the turn does pose a cautionary note to the immediate bearish case. An impulsive break of 2800 would imho confirm it.
omens vs. oscillators
my $0.02…pay attention to neither. Price action and price structure only. But I’m weird that way. I don’t bother with oscillators of any type on my charts anymore. Highly derived “information”, through which real information has been lost in the derivation. For example, NFLX. Price structure screams that a great long may be setting up right now, a hit and turn on a major 61.8% (the huge ’18 sell off hit and turned at a 61.8% too), and now an inverse head/shoulders structure forming on the hourly. Chart’s at the top of my Alerts page at http://www.specktrading.com. I am waiting for a buy trigger there right now. Obviously, NFLX will only go is the broader goes, and I’m generally bullish here.
I’ve taken a short on RUT using Sept high delta puts on IWM to capture some profit on this correction now in play. I’m bullish overall but expect RUT to pullback back at least 38% and maybe 62 or even 76-78% of the up move off the lows.
my RUT count
My targets based on fibonacci fitting for this move down in RUT (purple dashed lines). I left on the Fibonacci structure for one of the targets so you can see what it is I’m doing re “fitting”.
and how will I “know” the bottom is in? price breaks bullish symmetry is my #1 technique.
Nice trend-line. Move off the low does look to me like a corrective three. If correct we should see price bounce smartly off trend-line…
Very good. Thank you Lara. A return to the more bullish wave count along with the McClellan Oscillator buy signal confirmation. Time to re-establih my ling positions this week. BTW, I am #1 today.
#1 is that now 5 times in a row?
I hope your recovery is coming along well Rodney.
I’m also sorry to be flip flopping wave counts about. I don’t like doing that. But with Lowry’s now stating Friday as a 90% up day I really do need to swap them back.
Au contrare Lara, I at least very much appreciate your WILLINGNESS to use pure data to assess most likely forward looking models, and CHANGE THEM if and as the data changes. A lot of analysts won’t do that for ego reasons. A highly volatile market naturally will generate highly volatile models! So thank you for being a straight shooter.
Agreed, thanks. Especially in such a headline driven market. Reserve the right to change direction every day.
I am in complete agreement with Kevin. When the market is in consolidation with high volatility, it can produce competing wave counts. We can only use the data at hand as clues as to which wave count will ultimately play out. You must call it as you see it and if that means a period of switching back and forth, so be it. This is reality.
My recovery is coming along but it has been a very painful week or ten days since surgery. It gets better each day. Physical therapy will once again be the challenge to stay motivated. However, since this surgery has been on my dominant arm (right) I am thinking it will progress better than the first one. I am already experiencing some signs to indicate this. Monday I go an have 27 staples removed and get a release for phase 1 (4 weeks) of physical therapy. I am already pulling out my hair being confined to home. I guess I should be glad at my age to have hair to pull out!
Well, having hair at an older age is probably a blessing 🙂 I am glad to hear your recovering is coming along okay, and I hope the pain goes soon.
Thanks guys for understanding re the flip flopping. Yes, I can only make a judgement with the data I have. And markets change, so data changes.
I’m very focussed each day on trying to make an accurate call for tomorrow and further. I’m trying to be right, and trying to avoid any bias.
No apologies needed, Lara. So many of us stick around here because we know you’re the best there is. We understand that sometimes all anyone, even the best, can say is: “The market could go up (and here’s why) or it could go down (and here’s why).”
As I’ve come to understand over many years now, that EW analysis occasionally tells you exactly what *MUST* happen next. But those times are really quite rare.
We must trade the charts as we see them, according to our own personal trading rules and timeframes, and live with the results.
CORRECTION: The McClellan Oscillator closed at +16.21 yesterday short of the +20 needed for final confirmation of the buy signal triggered/begun a couple of weeks ago. Technically, I guess this is important. Practically, I don’t think so. What it is measuring is market breadth and momentum of breadth changes. What the signal is telling us is that from the 2822 low breadth is significantly improving and doing so in a manner to sustain a bull rally.