
Another downwards day closes green with a smaller range Doji. Analysis of volume within the session supports the Elliott wave counts.
Summary: Look out for a possible small counter trend bounce tomorrow up to about 2,871 or 2,898 but not above 2,943.31. Thereafter, the downwards trend may resume with strength. The target is now at 2,663.
An alternate wave count also expects more downwards movement. Its target zone is from 2,578 to 2,476.
A second alternate wave count requires price to not move below 2,822.12. This second alternate wave count expects strong upwards movement to a target at 3,120. This second alternate wave count now has very little support from classic technical analysis.
The biggest picture, Grand Super Cycle analysis, is here.
Monthly charts were last published here, with video here. There are two further alternate monthly charts here, with video here.
ELLIOTT WAVE COUNTS
The two weekly Elliott wave counts below will be labelled First and Second. They may be about of even probability. When the fifth wave currently unfolding on weekly charts may be complete, then these two wave counts will diverge on the severity of the expected following bear market. To see an illustration of this future divergence monthly charts should be viewed.
FIRST WAVE COUNT
WEEKLY CHART
Click chart to enlarge.
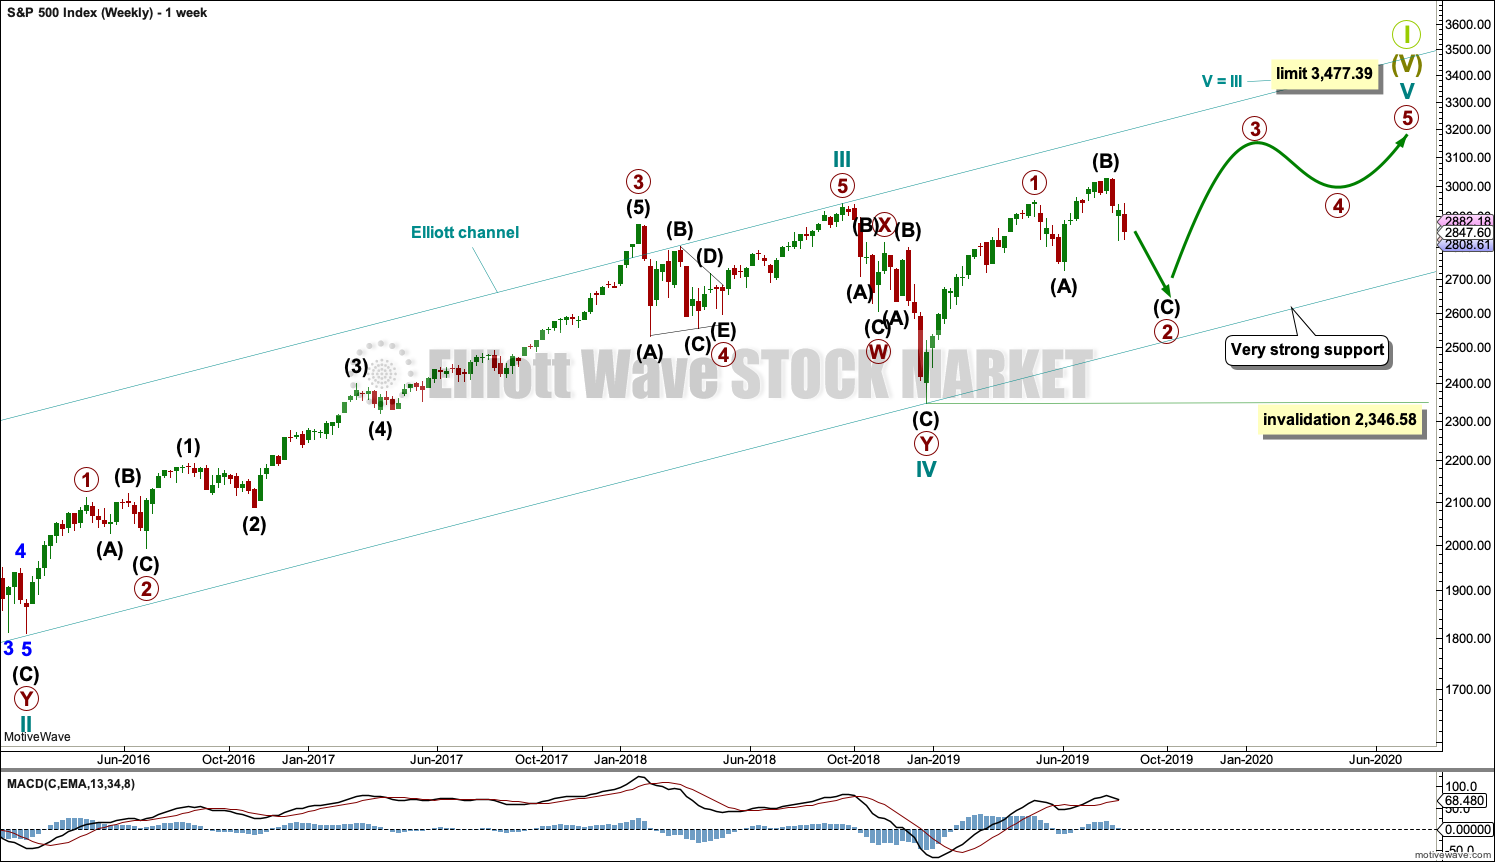
The basic Elliott wave structure consists of a five wave structure up followed by a three wave structure down (for a bull market). This wave count sees the bull market beginning in March 2009 as an incomplete five wave impulse and now within the last fifth wave, which is labelled cycle wave V. This impulse is best viewed on monthly charts. The weekly chart focusses on the end of it.
Elliott wave is fractal. This fifth wave labelled cycle wave V may end a larger fifth wave labelled Super Cycle wave (V), which may end a larger first wave labelled Grand Super Cycle wave I.
The teal Elliott channel is drawn using Elliott’s first technique about the impulse of Super Cycle wave (V). Draw the first trend line from the end of cycle wave I (off to the left of the chart, the weekly candlestick beginning 30th November 2014) to the end of cycle wave III, then place a parallel copy on the end of cycle wave II. This channel perfectly shows where cycle wave IV ended at support. The strongest portion of cycle wave III, the end of primary wave 3, overshoots the upper edge of the channel. This is a typical look for a third wave and suggests the channel is drawn correctly and the way the impulse is counted is correct.
Within Super Cycle wave (V), cycle wave III is shorter than cycle wave I. A core Elliott wave rule states that a third wave may never be the shortest. For this rule to be met in this instance, cycle wave V may not be longer in length than cycle wave III. This limit is at 3,477.39.
Cycle wave V may subdivide either as an impulse or an ending diagonal. Impulses are much more common. This main wave count expects that cycle wave V may be unfolding as an impulse.
The daily charts below will now focus on all of cycle wave V.
In historic analysis, two further monthly charts have been published that do not have a limit to upwards movement and are more bullish than this wave count. Members are encouraged to consider those possibilities (links below summary) alongside the wave counts presented on a daily and weekly basis.
MAIN DAILY CHART
Click chart to enlarge.
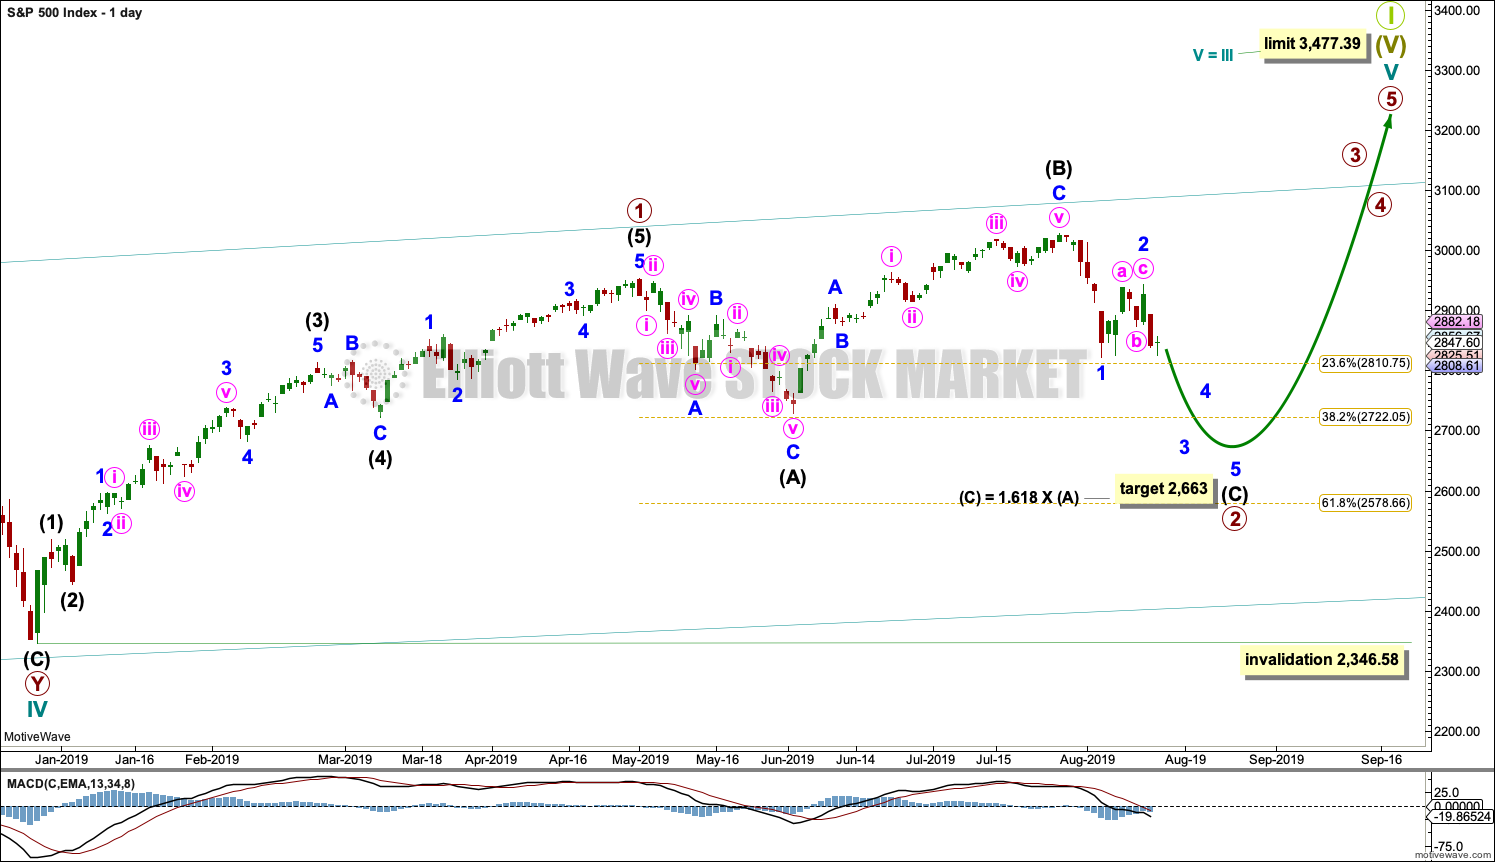
Cycle wave V must subdivide as a five wave motive structure. Within that five wave structure, primary wave 1 only may be complete.
Primary wave 2 may be unfolding as an expanded flat correction. These are reasonably common Elliott wave corrective structures. Flat corrections subdivide 3-3-5. Expanded flats have B waves which are 1.05 or more the length of their A waves. In this example for primary wave 2, intermediate wave (B) is a 1.33 length of intermediate wave (A). The target for intermediate wave (C) expects it to exhibit the most common Fibonacci Ratio to intermediate wave (A) within an expanded flat.
If price reaches the target at 2,663 and keeps falling, then the next target would be the 0.618 Fibonacci Ratio of primary wave 1 at 2,578.66.
Primary wave 2 may not move beyond the start of primary wave 1 below 2,346.58.
MAIN HOURLY CHART
Click chart to enlarge.
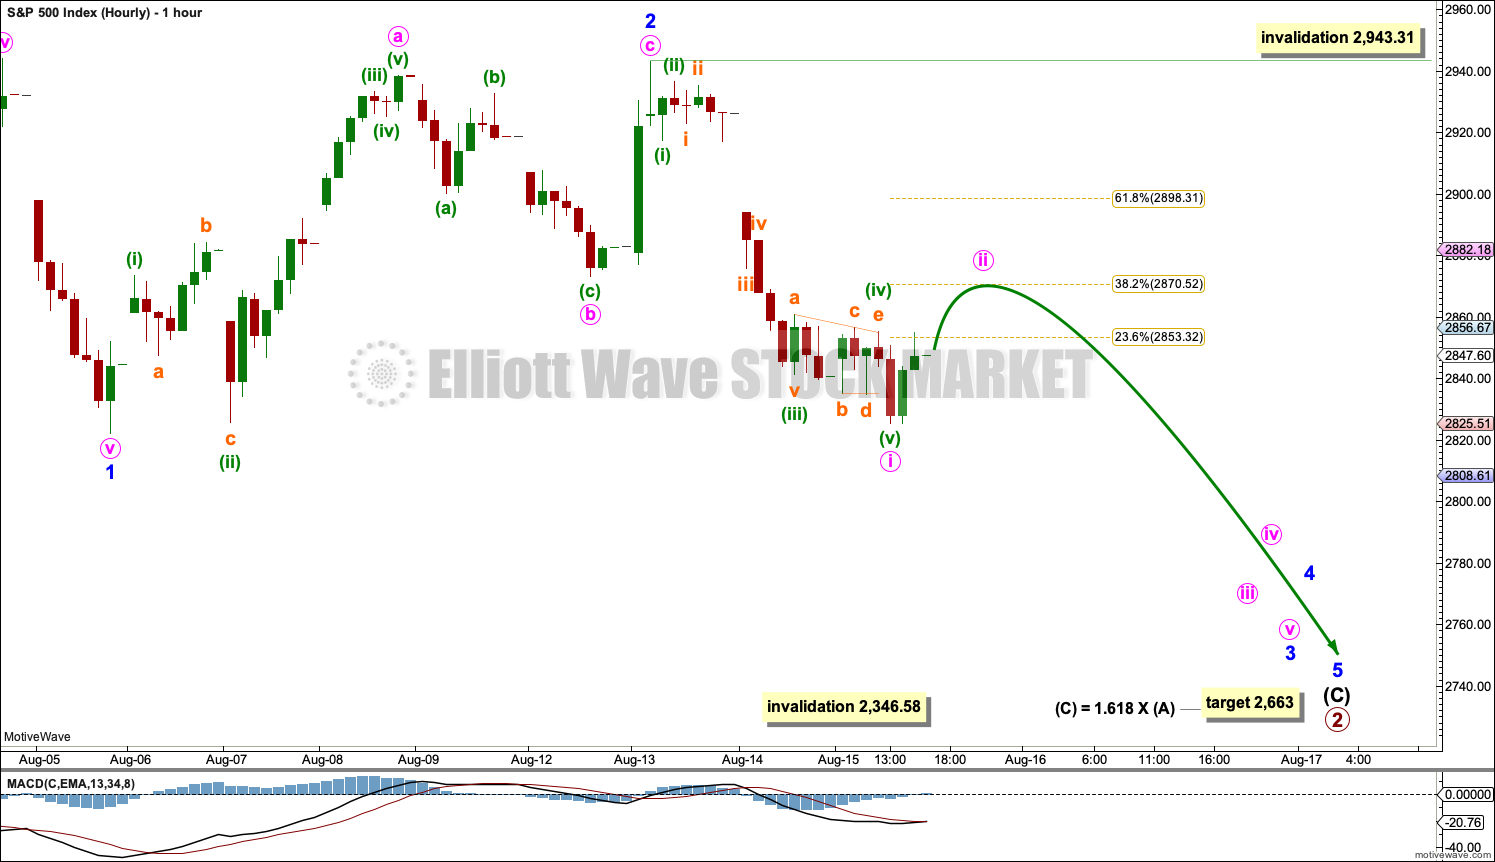
Intermediate wave (C) must subdivide as a five wave structure. Minor wave 1 may have been complete at the last low.
Minor wave 2 may be now a complete single zigzag.
Minor wave 3 may only subdivide as an impulse. Minute wave i within minor wave 3 may be complete. Minute wave ii should unfold over a day or so as a relatively brief bounce. Minute wave ii may not move beyond the start of minute wave i above 2,943.31.
Minute wave ii may be relatively brief and shallow due to the strong downwards pull of the middle of a third wave. The preferred target would be the 0.382 Fibonacci Ratio of minute wave i. If price keeps rising through this first target, then the next target would be the 0.618 Fibonacci Ratio.
ALTERNATE DAILY CHART
Click chart to enlarge.
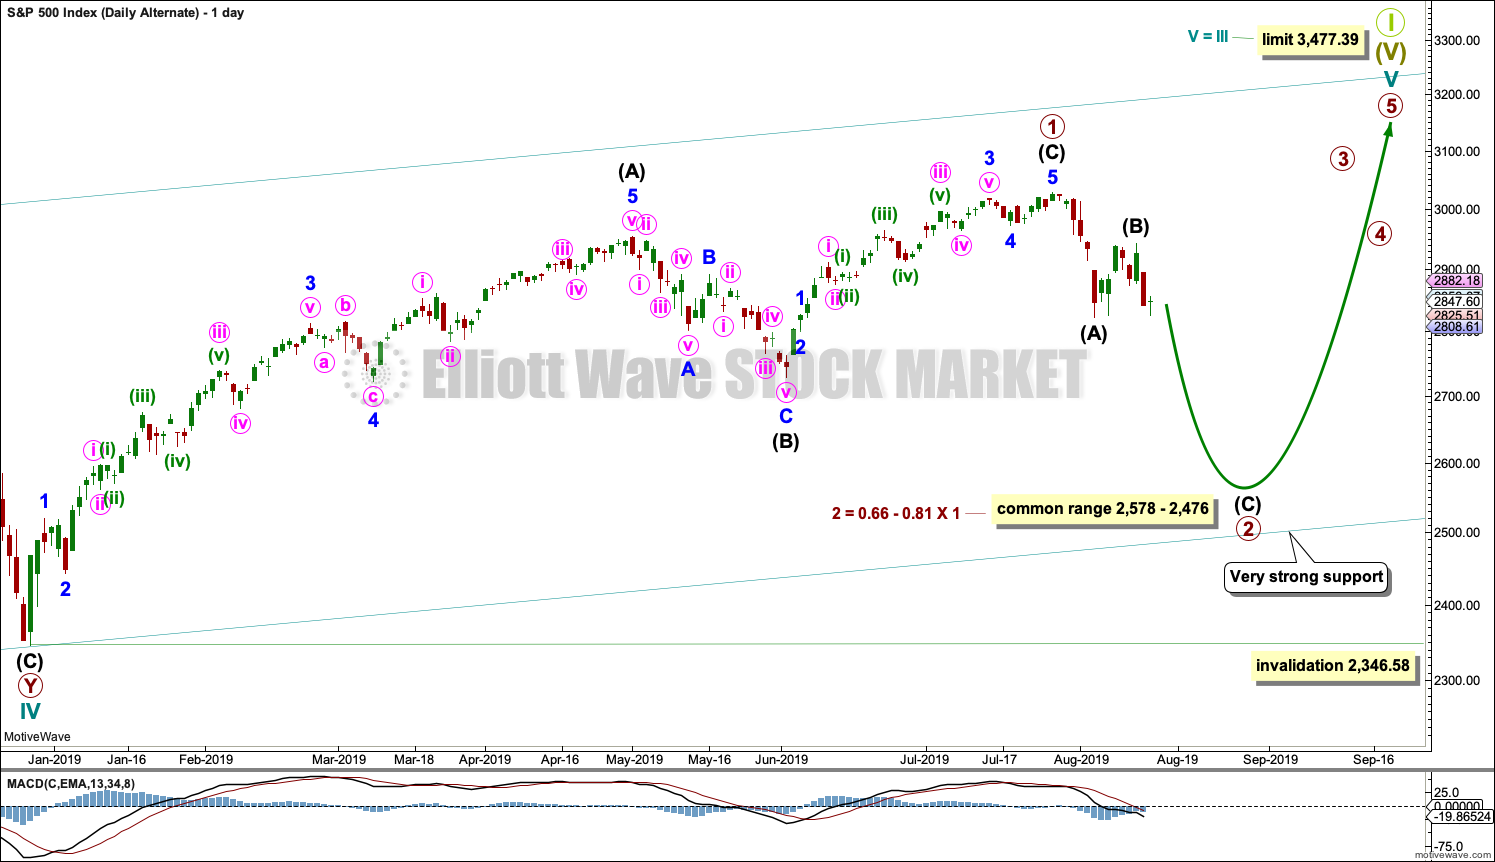
This first alternate daily chart considers the other structural possibility for cycle wave V, that of an ending diagonal.
All sub-waves within an ending diagonal must subdivide as zigzags. Primary wave 1 may have been complete as a zigzag at the last all time high on the 26th of July.
Primary wave 2 may be continuing lower as a zigzag.
Within diagonals, sub-waves 2 and 4 are normally very deep, ending within a range of 0.66 to 0.81 the prior wave. This range for primary wave 2 is from 2,578 to 2,476. Primary wave 2 may possibly come as low as the lower edge of the teal channel, which is copied over from the weekly chart.
Primary wave 2 may not move beyond the start of primary wave 1 below 2,346.58.
SECOND ALTERNATE DAILY CHART
Click chart to enlarge.
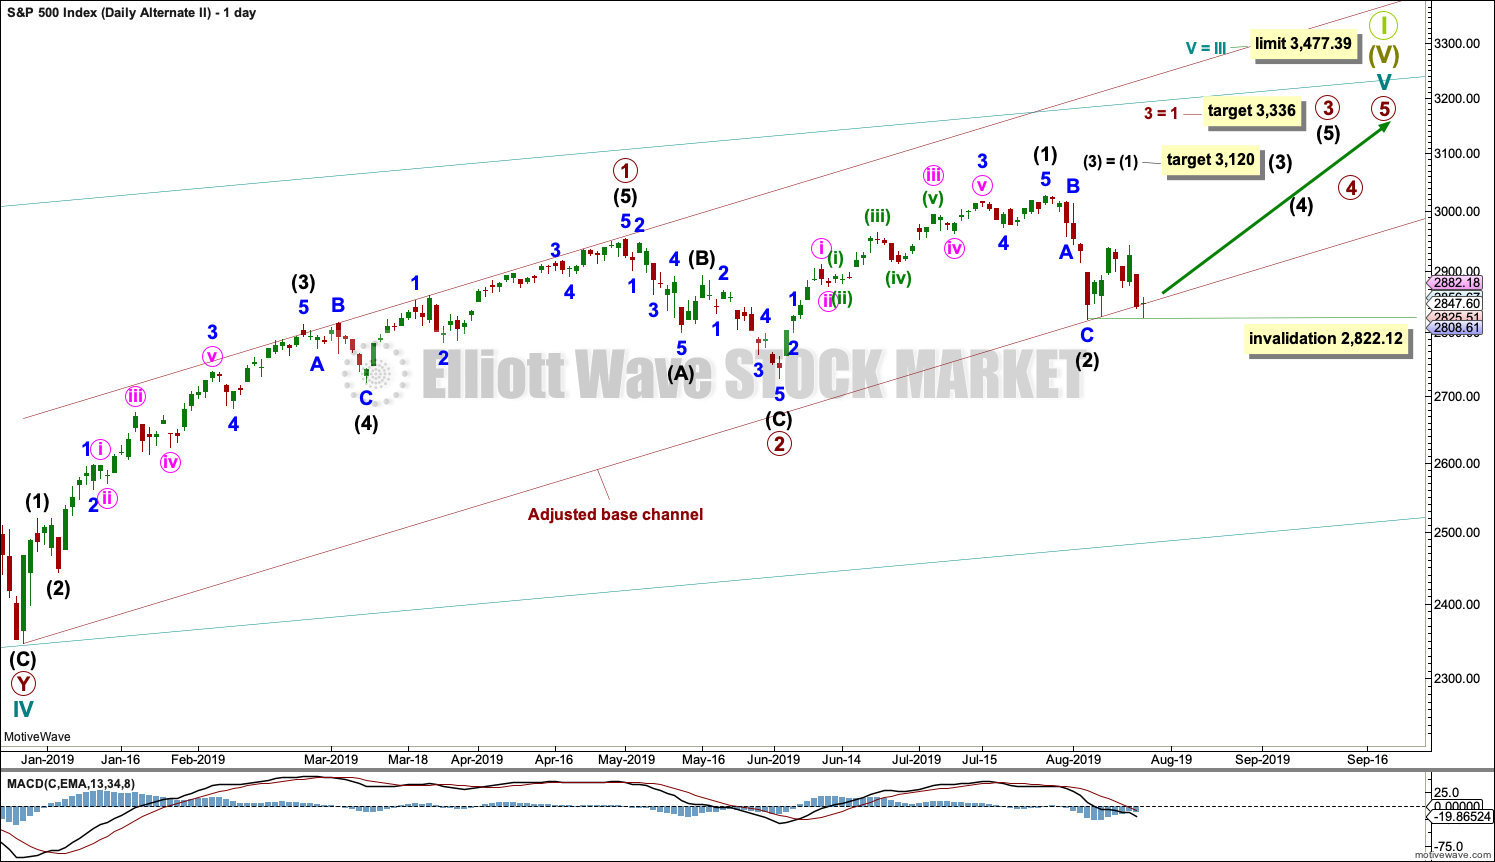
This second alternate daily wave count is now judged to be the least likely of all three daily charts published in this analysis.
Cycle wave V is seen as an impulse for this wave count.
Within cycle wave V, primary waves 1 and 2 may be complete. Primary wave 3 may have begun.
Primary wave 3 may only subdivide as an impulse. Within primary wave 3, intermediate waves (1) and (2) may be complete.
Intermediate wave (3) may have begun. Intermediate wave (3) may only subdivide as an impulse. Within the impulse of intermediate wave (3), minor wave 2 may not move beyond the start of minor wave 1 below 2,822.12.
SECOND WAVE COUNT
WEEKLY CHART
Click chart to enlarge.
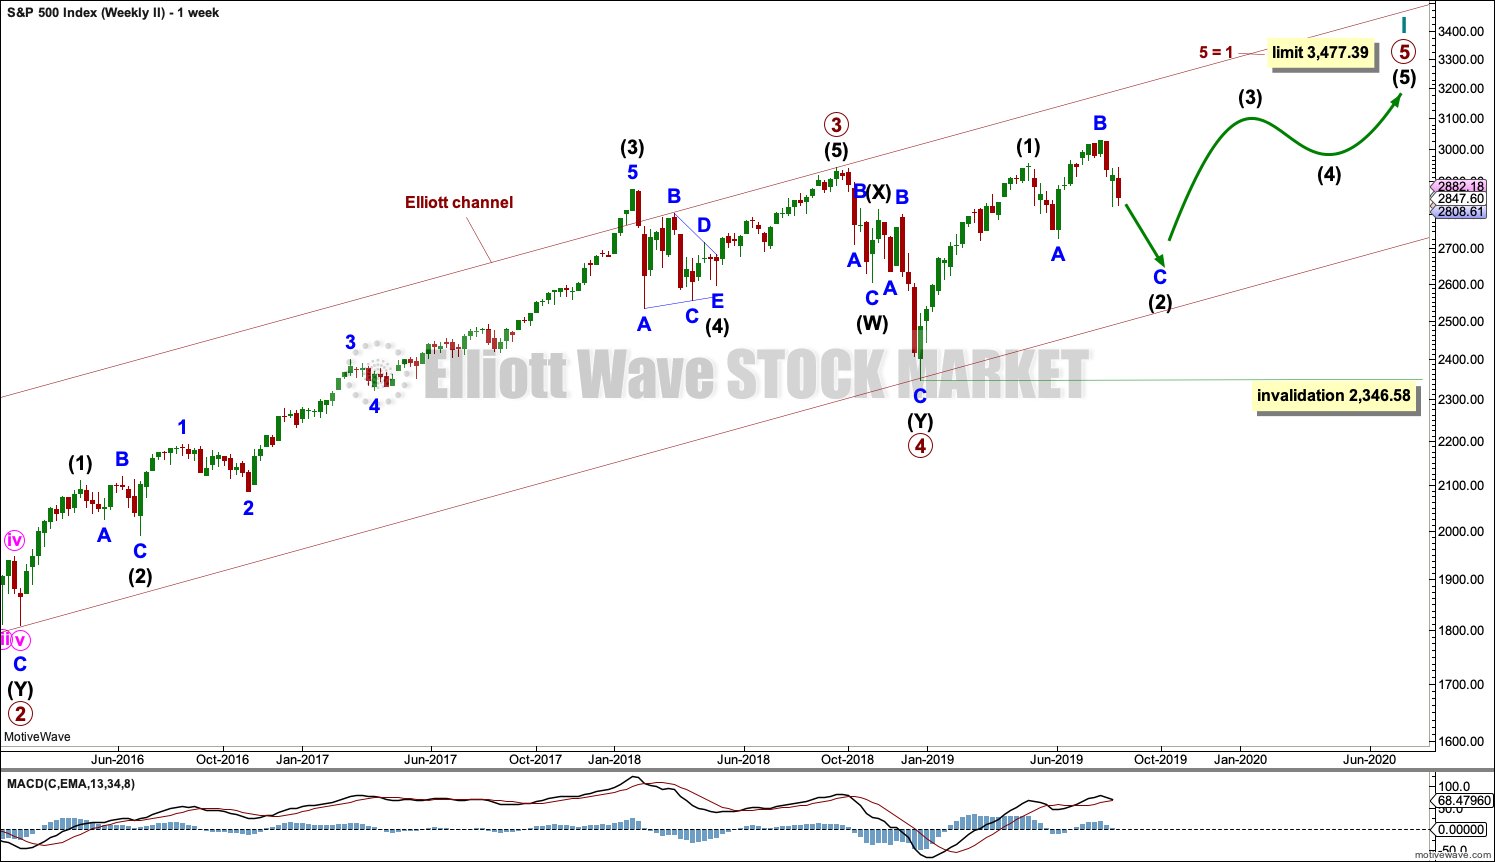
This weekly chart is almost identical to the first weekly chart, with the sole exception being the degree of labelling.
This weekly chart moves the degree of labelling for the impulse beginning in March 2009 all down one degree. This difference is best viewed on monthly charts.
The impulse is still viewed as nearing an end; a fifth wave is still seen as needing to complete higher. This wave count labels it primary wave 5.
TECHNICAL ANALYSIS
WEEKLY CHART
Click chart to enlarge. Chart courtesy of StockCharts.com.
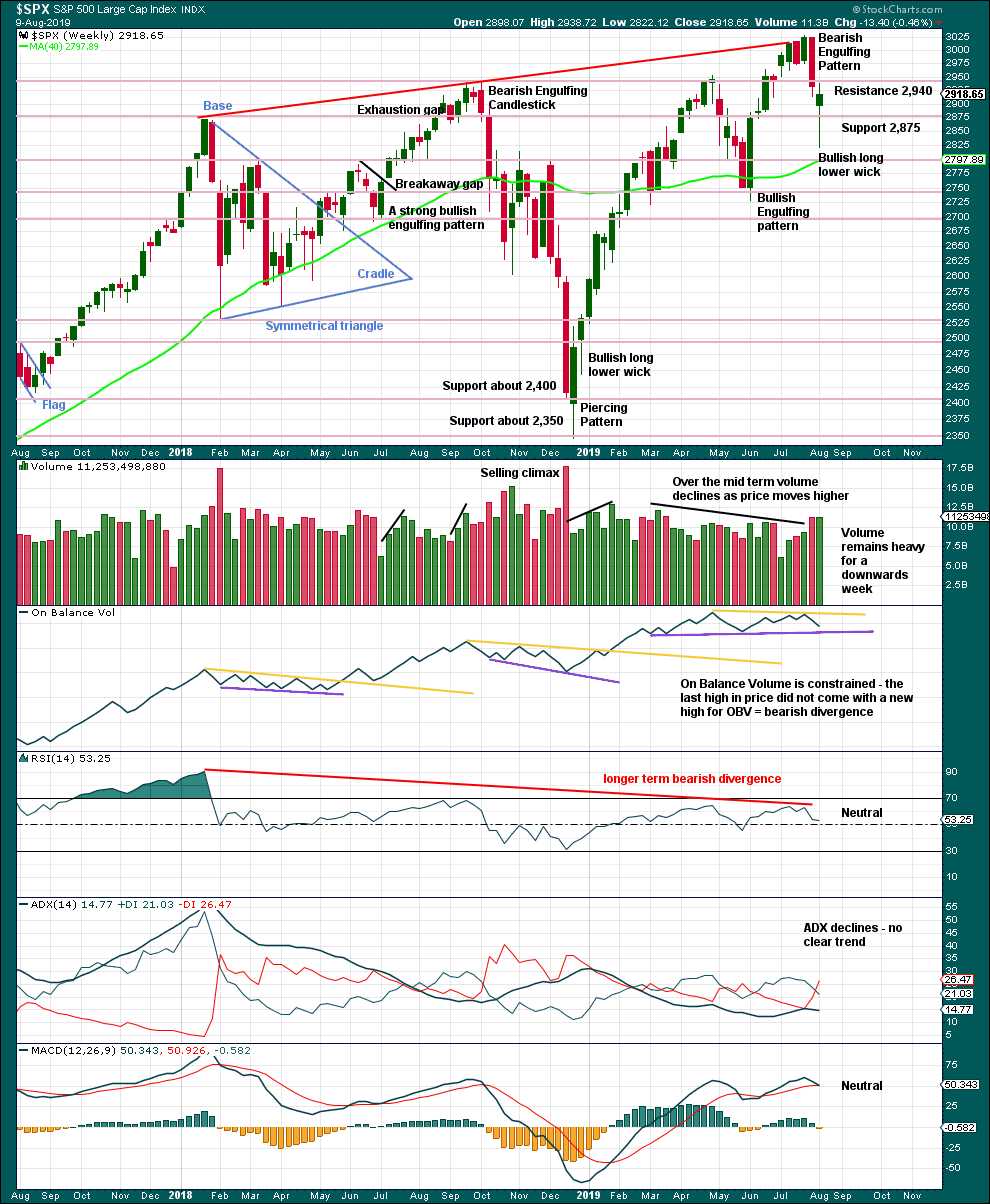
A Bearish Engulfing candlestick pattern has now been followed by a downwards week. It is possible now that the bearish reversal pattern may be resolved.
Last weekly candlestick has a bullish long lower wick. This suggests upwards movement this week.
DAILY CHART
Click chart to enlarge. Chart courtesy of StockCharts.com.
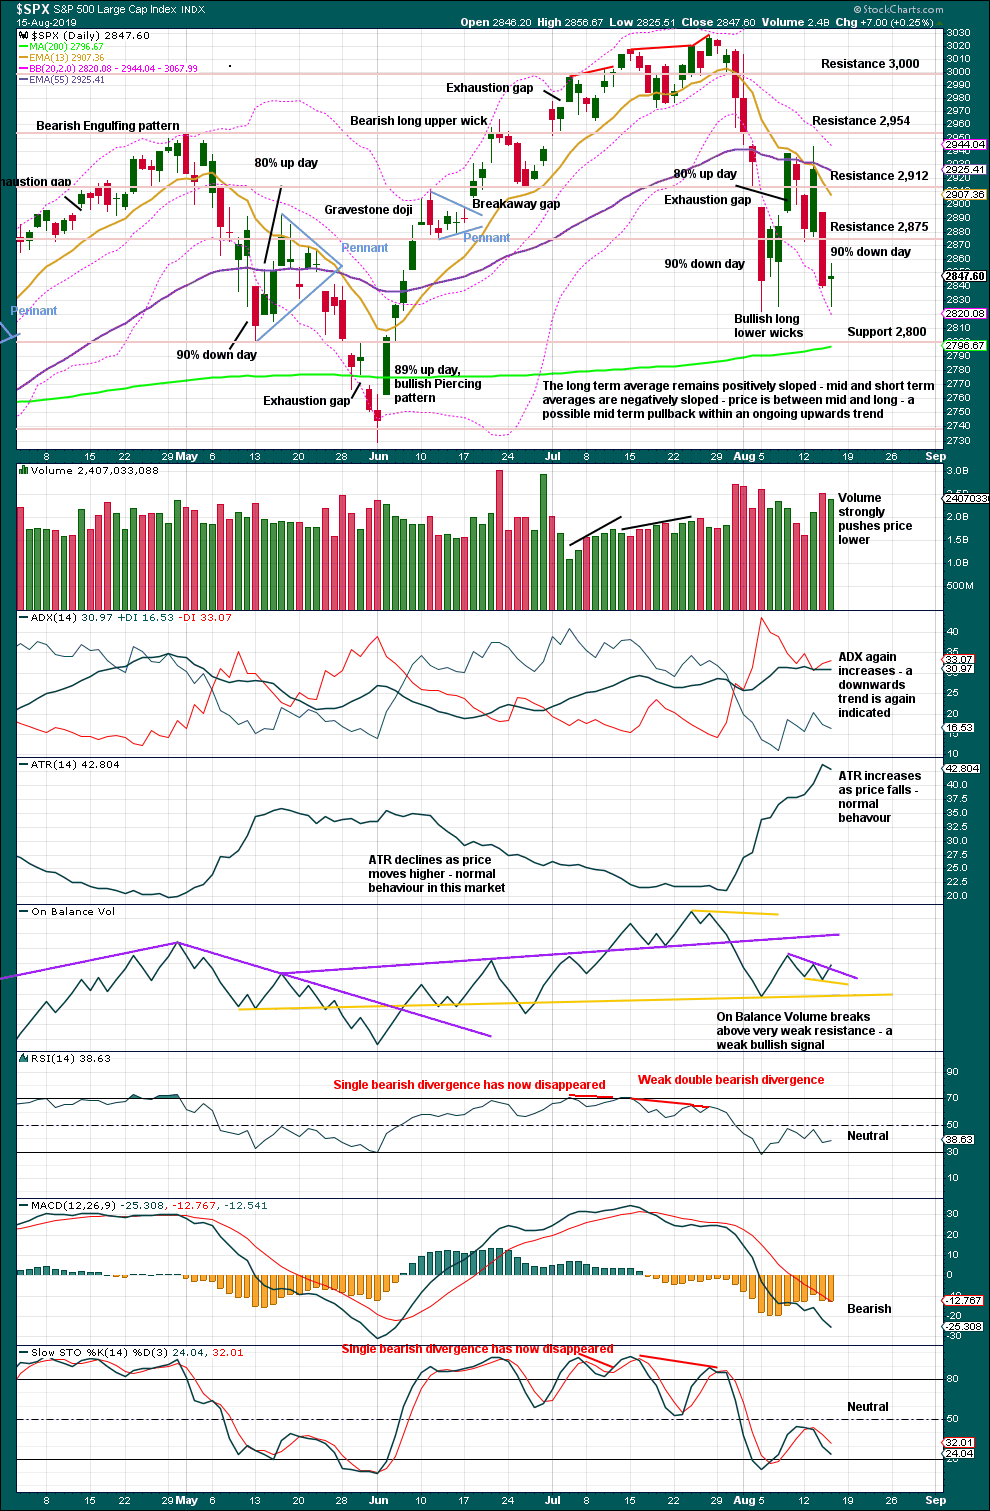
Lowry’s analysis of bear markets shows that “…market declines containing two or more 90% downwards days often generate a series of additional 90% downwards days, often spread apart by as much as 30 trading days. Therefore, it should not be assumed that investors can successfully ride out such a decline without taking defensive measures.” – quote from Lowry’s white paper titled: Identifying Bear Market Bottoms And New Bull Markets by Paul F. Desmond.
With the appearance of a second 90% downwards day, a bearish outlook for the short to mid term is now warranted. This downwards day also has a strong push from volume pushing price lower.
Neither RSI nor Stochastics are oversold. There is room for price to continue falling. Look for next support about 2,800.
Today’s candlestick moved price lower with a lower low and lower high, but the candlestick is green. Analysis of volume within the session shows down volume dominated with 62% of total down / up volume.
The signal from On Balance Volume is very weak because the resistance line breached is only just able to be drawn, is not long held, not often tested and has some slope. If On Balance Volume moves lower tomorrow, then this line may need to be adjusted.
BREADTH – AD LINE
WEEKLY CHART
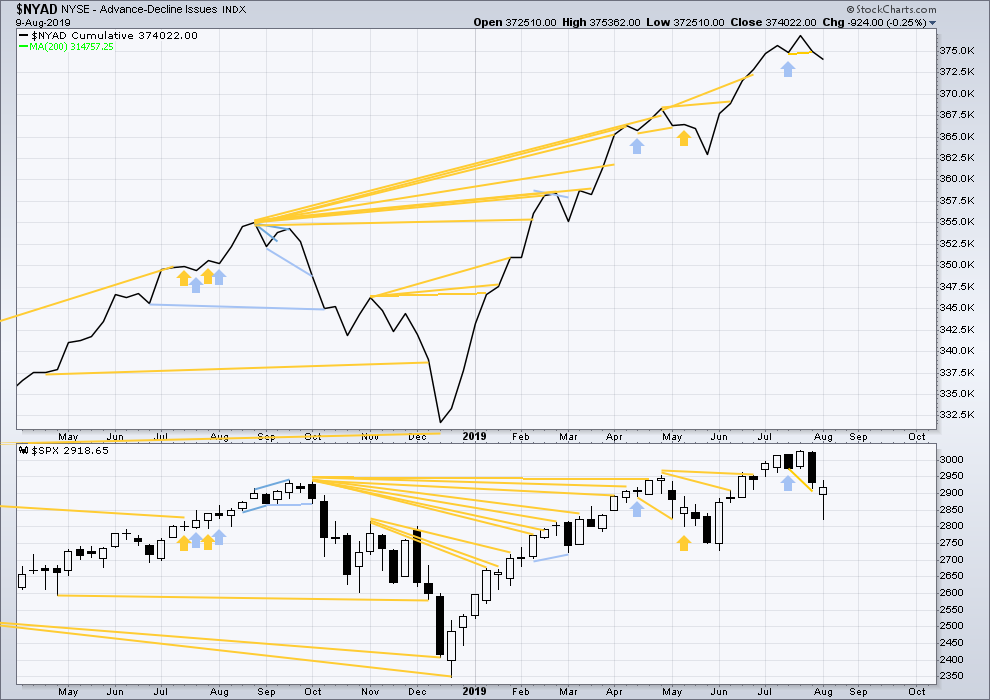
Click chart to enlarge. Chart courtesy of StockCharts.com. So that colour blind members are included, bearish signals
will be noted with blue and bullish signals with yellow.
Bear markets from the Great Depression and onwards have been preceded by an average minimum of 4 months divergence between price and the AD line with only two exceptions in 1946 and 1976. With the AD line making new all time highs again this week, the end of this bull market and the start of a new bear market is very likely a minimum of 4 months away, which is mid November 2019.
In all bear markets in the last 90 years there is some positive correlation (0.6022) between the length of bearish divergence and the depth of the following bear market. No to little divergence is correlated with more shallow bear markets. Longer divergence is correlated with deeper bear markets.
If a bear market does develop here, it comes after no bearish divergence. It would therefore more likely be shallow.
Last week both price and the AD line move lower. Short-term bullish divergence noted in last weekly analysis has not been followed by upwards movement. It may have failed.
There is no new short-term divergence.
DAILY CHART
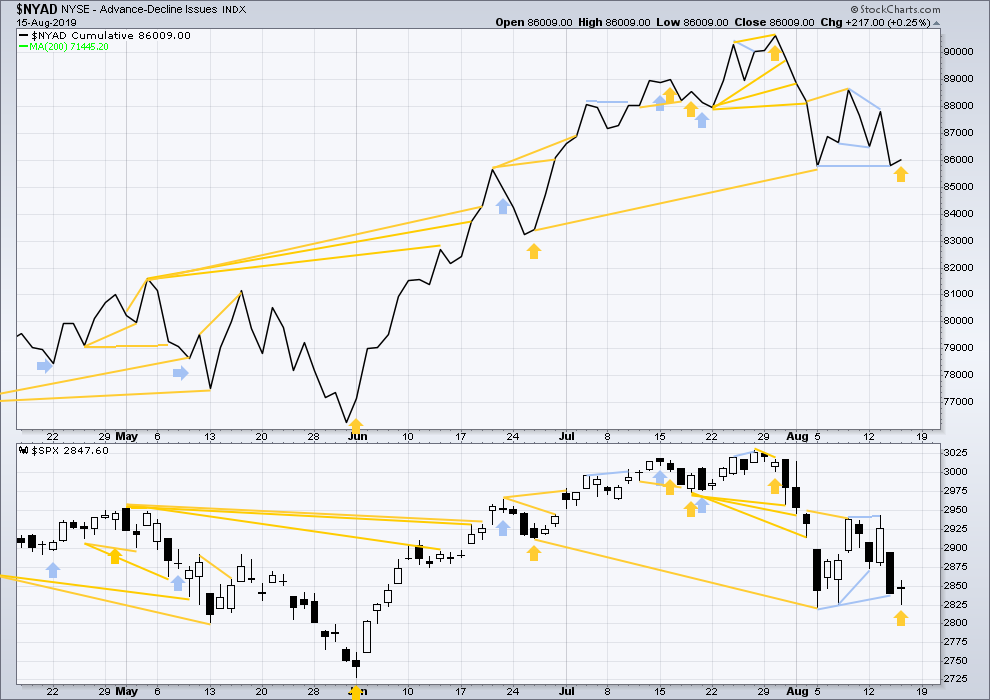
Click chart to enlarge. Chart courtesy of StockCharts.com. So that colour blind members are included, bearish signals
will be noted with blue and bullish signals with yellow.
Breadth should be read as a leading indicator.
There remains a cluster of three bearish signals from the AD line.
Today price moved lower with a lower low and a lower high, but the AD line has slightly increased. This divergence is bullish for the very short term, but it is tempered by Lowry’s data showing advances today were 51% of total advance + decline issues.
VOLATILITY – INVERTED VIX CHART
WEEKLY CHART
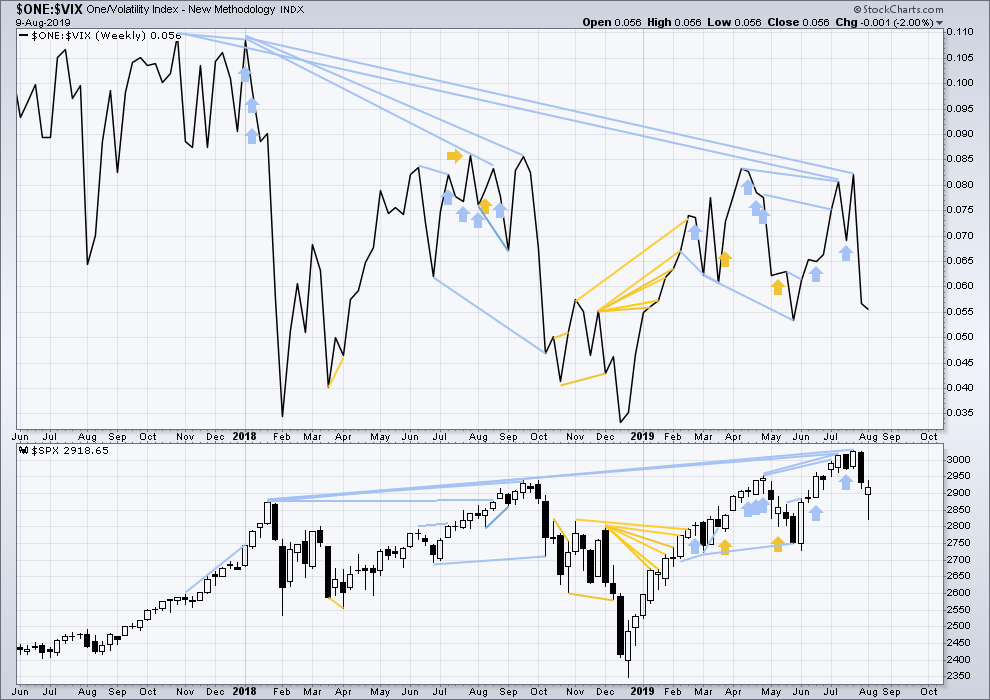
Click chart to enlarge. Chart courtesy of StockCharts.com. So that colour blind members are included, bearish signals
will be noted with blue and bullish signals with yellow.
The all time high for inverted VIX (which is the same as the low for VIX) was on 30th October 2017. There is now nearly one year and nine months of bearish divergence between price and inverted VIX.
The rise in price is not coming with a normal corresponding decline in VIX; VIX remains elevated. This long-term divergence is bearish and may yet develop further as the bull market matures.
This divergence may be an early warning, a part of the process of a top developing that may take years. It may not be useful in timing a trend change.
This week both price and inverted VIX have moved lower. There is no new short-term divergence.
DAILY CHART
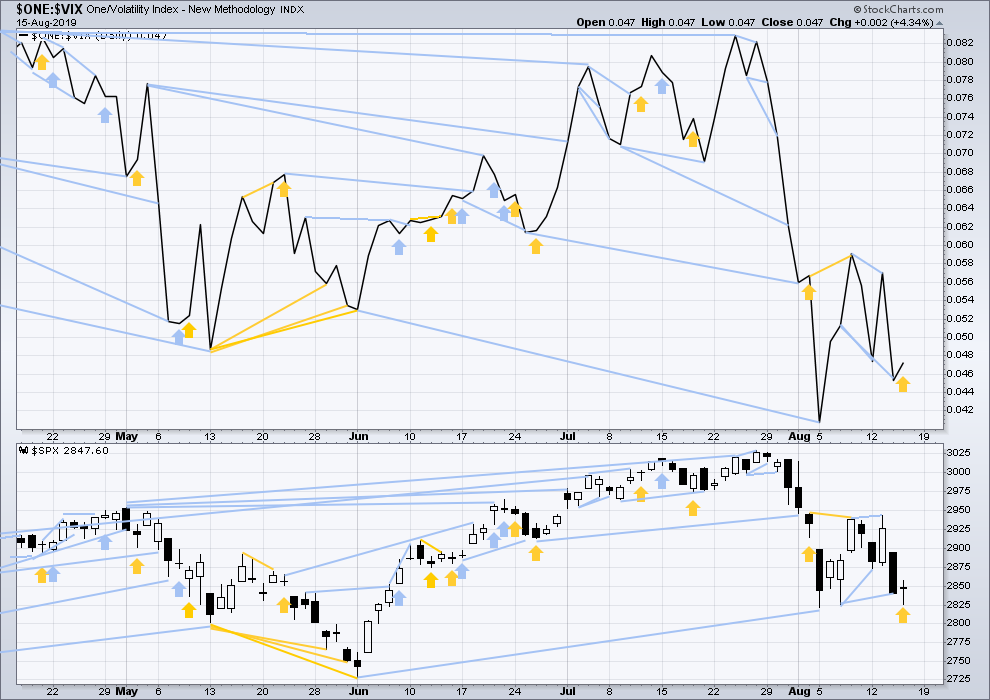
Click chart to enlarge. Chart courtesy of StockCharts.com. So that colour blind members are included, bearish signals
will be noted with blue and bullish signals with yellow.
There is now a small cluster of bearish signals from inverted VIX to confirm bearish signals from the AD line. This supports the first two Elliott wave counts.
Today price has moved lower with a lower low and lower high, although the candlestick has closed green. Inverted VIX has increased. This divergence is bullish for the very short term.
DOW THEORY
Dow Theory confirmed a bear market in December 2018. This does not necessarily mean a bear market at Grand Super Cycle degree though; Dow Theory makes no comment on Elliott wave counts. On the 25th of August 2015 Dow Theory also confirmed a bear market. The Elliott wave count sees that as part of cycle wave II. After Dow Theory confirmation of a bear market in August 2015, price went on to make new all time highs and the bull market continued.
DJIA: 23,344.52 – a close on the 19th of December at 23,284.97 confirms a bear market.
DJT: 9,806.79 – price has closed below this point on the 13th of December.
S&P500: 2,532.69 – a close on the 19th of December at 2,506.96 provides support to a bear market conclusion.
Nasdaq: 6,630.67 – a close on the 19th of December at 6,618.86 provides support to a bear market conclusion.
With all the indices having moved higher following a Dow Theory bear market confirmation, Dow Theory would confirm a bull market if the following highs are made:
DJIA: 26,951.81 – a close above this point has been made on the 3rd of July 2019.
DJT: 11,623.58 – to date DJT has failed to confirm an ongoing bull market.
S&P500: 2,940.91 – a close above this point was made on the 29th of April 2019.
Nasdaq: 8,133.30 – a close above this point was made on the 26th of April 2019.
Published @ 10:28 p.m. EST.
—
Careful risk management protects your trading account(s).
Follow my two Golden Rules:
1. Always trade with stops.
2. Risk only 1-5% of equity on any one trade.
—
New updates to this analysis are in bold.
Hourly chart updated:
The 0.618 Fibonacci Ratio is now the target for minute ii. Minuette (b) may be a small triangle or combination, incomplete.
These kinds of trading set-ups appear only once or twice a year…don’t squander it…! 😉
YES! I am SHORT!
🙂
Count me in as well.
This is the rip your face bounce I was looking for. Shorted the test of the high of yesterday 🙂 Looking to short more…
any preferences on what you guys are shorting ? QQQ ? DIA ? SPY ?
any time frames ?
RUT / IWM. The weakest overall of the major markets.
That said, while I do have a small short on already…I’m being cautious. I want to see confirming price action. I’ve eaten it far too many times shorting in anticipation of a wave count being fulfilled and it doesn’t happen. Price action speaks.
What I have done is vastly reduce my long exposure by closing out profitable positions. Now…awaiting further developments.
I would expect to have another big sell off next week, some (bad) news will have to arrive. Lots of potential for that, obviously…
The current set up looks very, very similar to 5/28 on the hourly chart. That was followed by strong selling (which in fact started on 5/28).
RUT tagged it’s down trend line and has initiated a turn back down. For the moment, at least. I put on a broken wing ‘fly for next friday, IWM puts, 150/148/147.
Hey WTF on panw ? Kevin – did you not keep up with this one ? , I can not find any news on what happened here ? It did make a death cross , but 8 % on no news is nasty .
just saw some big shot sales guy leaving the co . fragile stuff in a nervous mkt
Fred, honest truth, my wave count on my chart for PANW? A big bearish impulse, with the end of july high being a 4. I’ve looked at it a few times in the last few weeks and thought “that can’t really be right…can it?”.
Yup.
No idea what the news is today, didn’t notice it until you mentioned it.
here’s my count of PANW, as I said, I think I first did this a couple weeks ago.
is three the longest ? Cool pattern …
I like QQQ and SPY myself due to liquidity and they tend to follow IWM (I consider Russell 2000 as a leading indicator).
QQQ has more to lose and during ups and down it goes up or down percentage points “most of the time.”
Thanks – have done a bit of the 3 – dia , spy and q s . went out to at the money august 30 – you pay about a buck a week for time on all of them . thanks – lets see what next week brings . have a good weekend
9-1 kinds of levels in advance/decline in SPX and RUT this morning.
#1 again.