
A strong upwards day sees the Elliott wave counts swapped over. Targets remain the same.
Summary: An 80% up day, a shaven head, closure of the last gap, and bullish divergence between price and both of the AD line and inverted VIX indicate it is likely a low was in place four sessions ago. The next target is at 3,336.
A new low below 2,873.61 would indicate the alternate may be correct. At that stage, a target for downwards movement to end would be at 2,663.
The biggest picture, Grand Super Cycle analysis, is here.
Monthly charts were last published here, with video here. There are two further alternate monthly charts here, with video here.
ELLIOTT WAVE COUNTS
The two weekly Elliott wave counts below will be labelled First and Second. They may be about of even probability. When the fifth wave currently unfolding on weekly charts may be complete, then these two wave counts will diverge on the severity of the expected following bear market. To see an illustration of this future divergence monthly charts should be viewed.
FIRST WAVE COUNT
WEEKLY CHART
Click chart to enlarge.
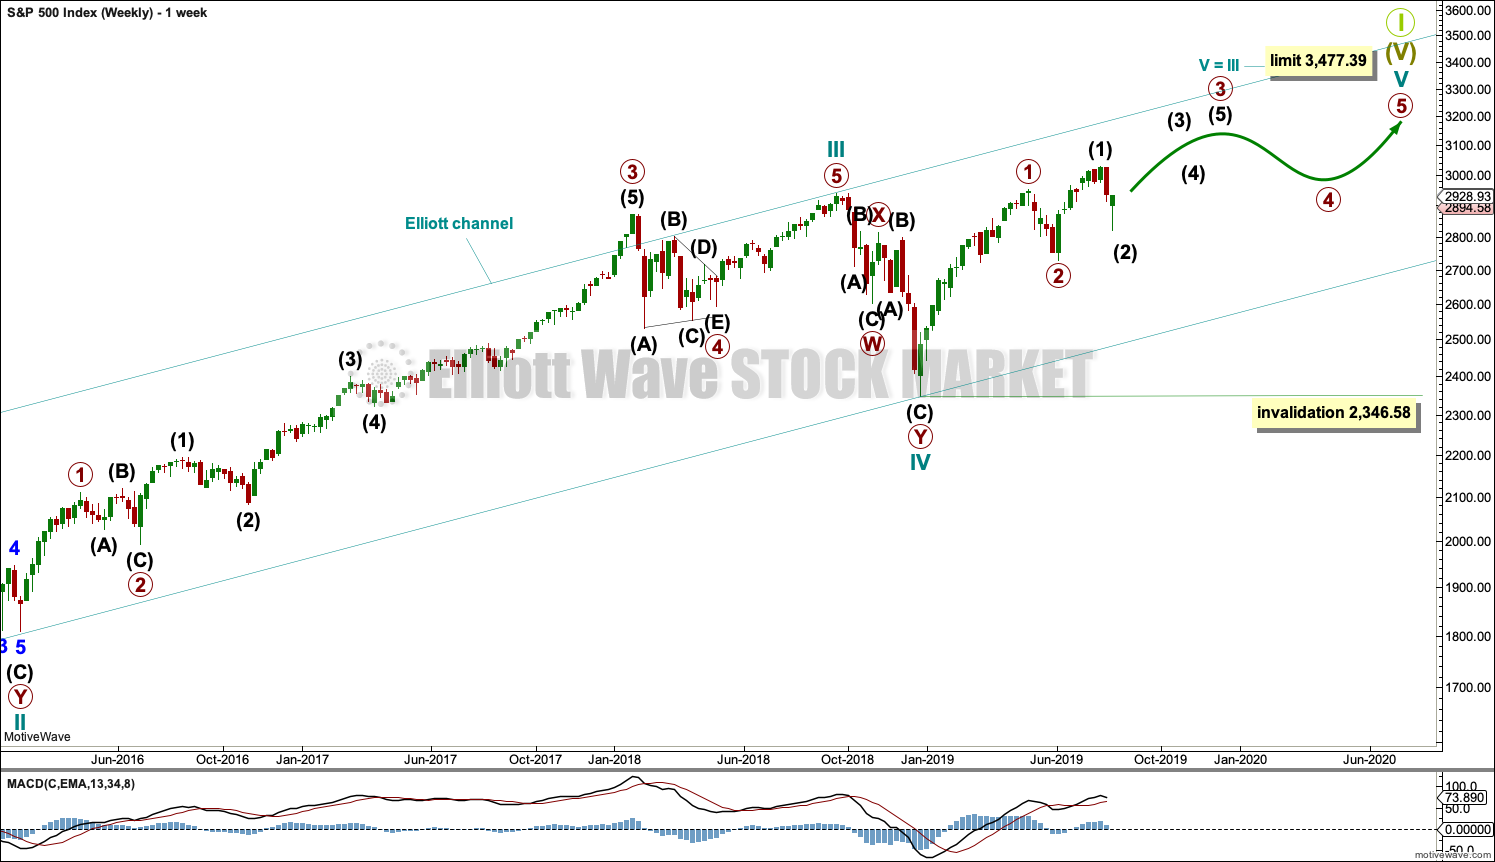
The basic Elliott wave structure consists of a five wave structure up followed by a three wave structure down (for a bull market). This wave count sees the bull market beginning in March 2009 as an incomplete five wave impulse and now within the last fifth wave, which is labelled cycle wave V. This impulse is best viewed on monthly charts. The weekly chart focusses on the end of it.
Elliott wave is fractal. This fifth wave labelled cycle wave V may end a larger fifth wave labelled Super Cycle wave (V), which may end a larger first wave labelled Grand Super Cycle wave I.
The teal Elliott channel is drawn using Elliott’s first technique about the impulse of Super Cycle wave (V). Draw the first trend line from the end of cycle wave I (off to the left of the chart, the weekly candlestick beginning 30th November 2014) to the end of cycle wave III, then place a parallel copy on the end of cycle wave II. This channel perfectly shows where cycle wave IV ended at support. The strongest portion of cycle wave III, the end of primary wave 3, overshoots the upper edge of the channel. This is a typical look for a third wave and suggests the channel is drawn correctly and the way the impulse is counted is correct.
Within Super Cycle wave (V), cycle wave III is shorter than cycle wave I. A core Elliott wave rule states that a third wave may never be the shortest. For this rule to be met in this instance, cycle wave V may not be longer in length than cycle wave III. This limit is at 3,477.39.
Cycle wave V may subdivide either as an impulse or an ending diagonal. Impulses are much more common. I have charted the possibility of an ending diagonal and will keep it updated, but the probability at this stage is too low for daily publication. It too needs new all time highs and so with no divergence at this stage it shall not be published.
The daily charts below will now focus on all of cycle wave V.
In historic analysis, two further monthly charts have been published that do not have a limit to upwards movement and are more bullish than this wave count. Members are encouraged to consider those possibilities (links below summary) alongside the wave counts presented on a daily and weekly basis.
MAIN DAILY CHART
Click chart to enlarge.
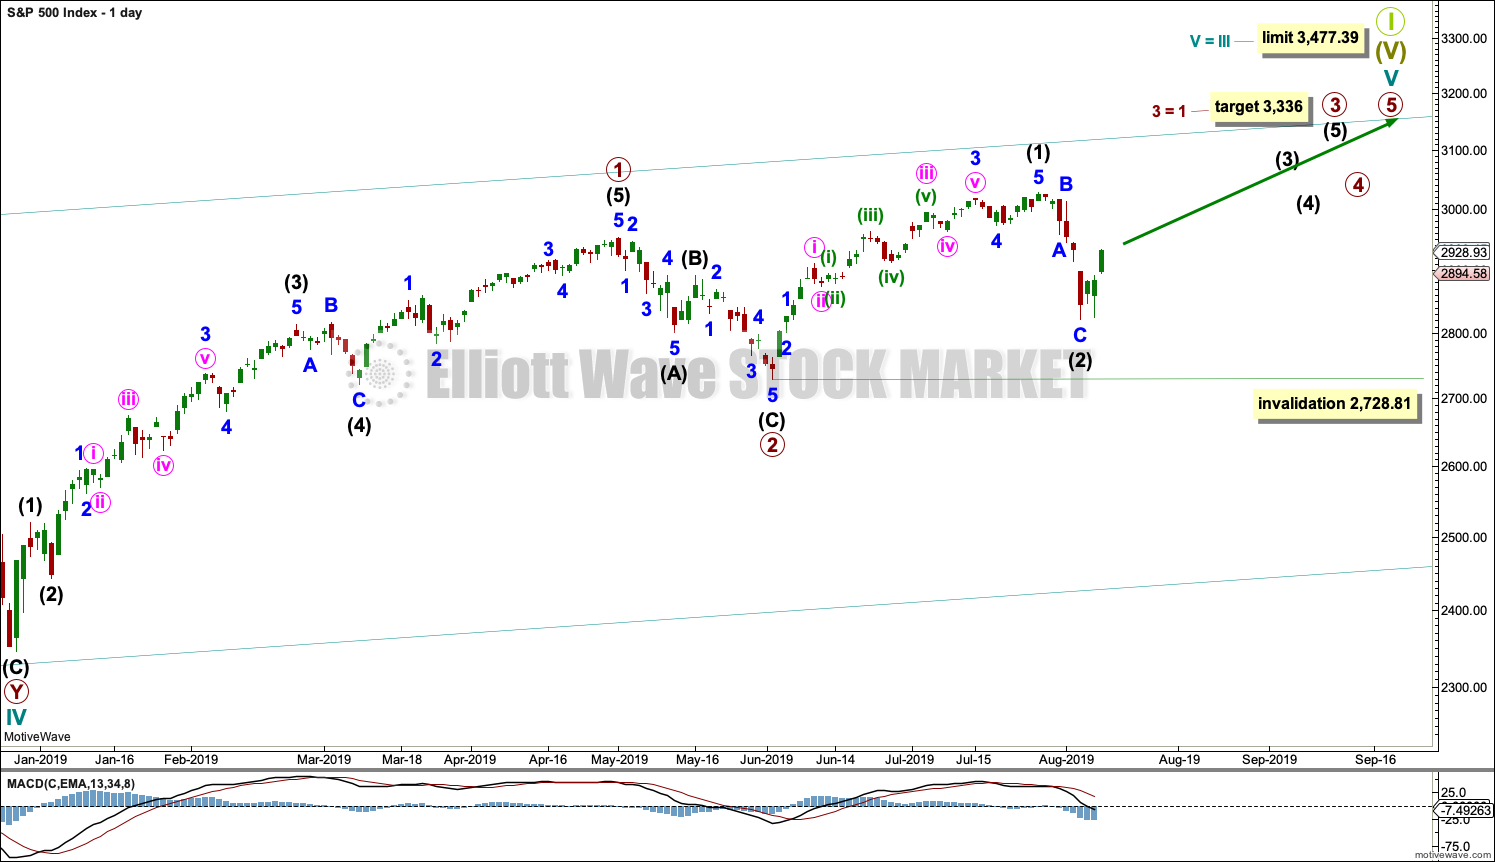
Cycle wave V must subdivide as a five wave motive structure. Within that five wave structure, primary waves 1 and 2 may be complete.
Primary wave 3 may only subdivide as an impulse. Within primary wave 3, intermediate waves (1) and (2) may now be complete. Intermediate wave (2) may have ended close to the 0.618 Fibonacci ratio of intermediate wave (1). If it continued any lower as a double zigzag, then intermediate wave (2) may not move beyond the start of intermediate wave (1) below 2,728.81.
A target is calculated for primary wave 3 that fits with the higher limit for cycle wave V.
MAIN HOURLY CHART
Click chart to enlarge.
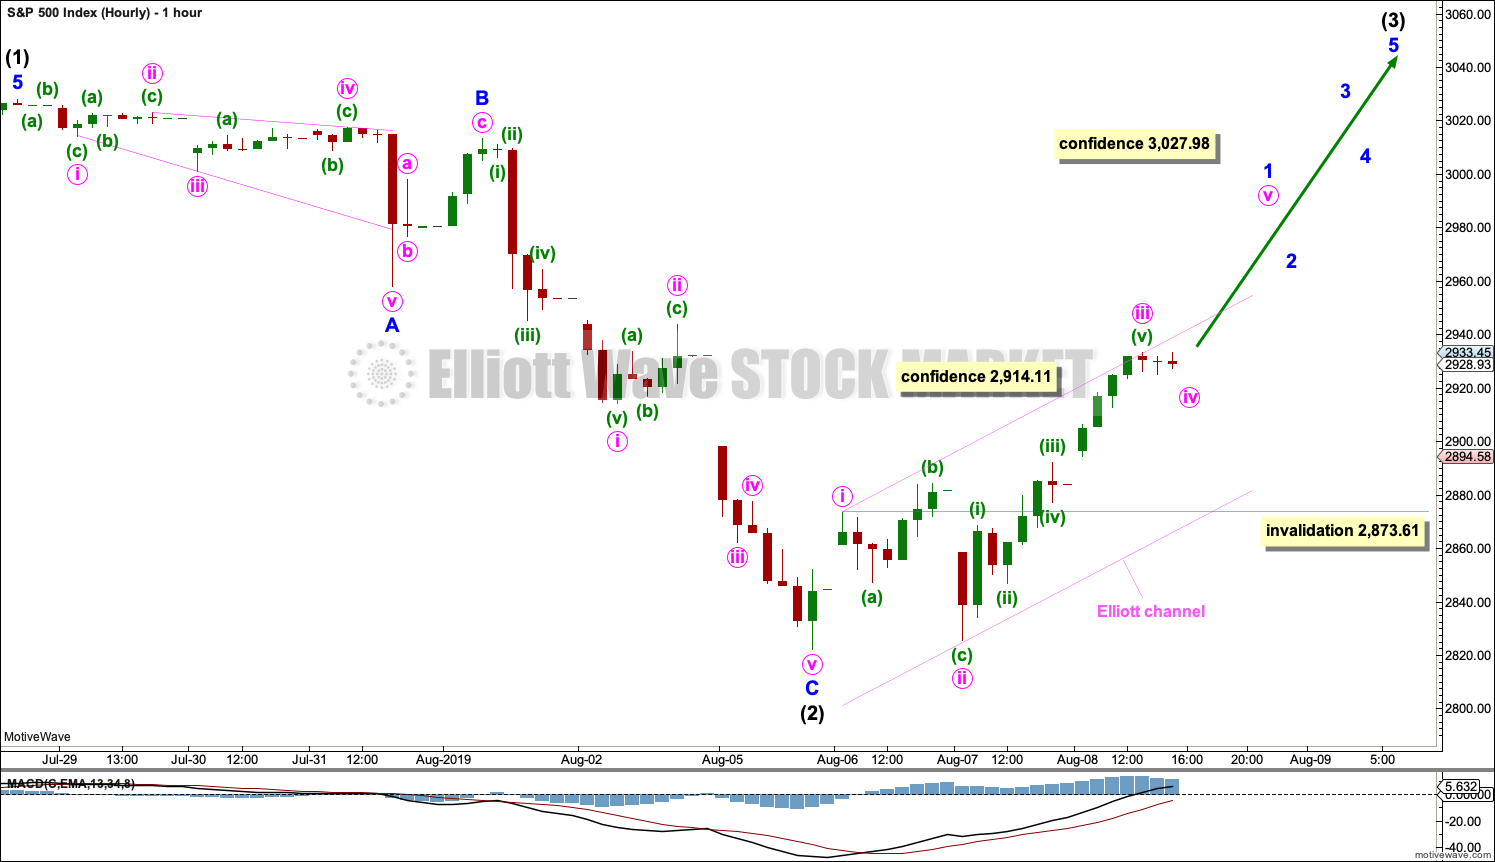
It is possible that intermediate wave (2) may today be a complete zigzag, ending close to the 0.618 Fibonacci Ratio of intermediate wave (1). There is no Fibonacci Ratio between minor waves A and C.
Intermediate wave (3) may only subdivide as an impulse. Minor wave 1 within intermediate wave (3) may be an incomplete impulse.
Within minor wave 1, minute waves i through to iii may be complete. Minute wave iv may not move into minute wave i price territory below 2,873.61.
When minor wave 1 may be seen as a complete five wave structure, then the invalidation point must move down to the beginning of minor wave 1 at 2,822.12. Minor wave 2 may not move beyond the start of minor wave 1.
ALTERNATE DAILY CHART
Click chart to enlarge.
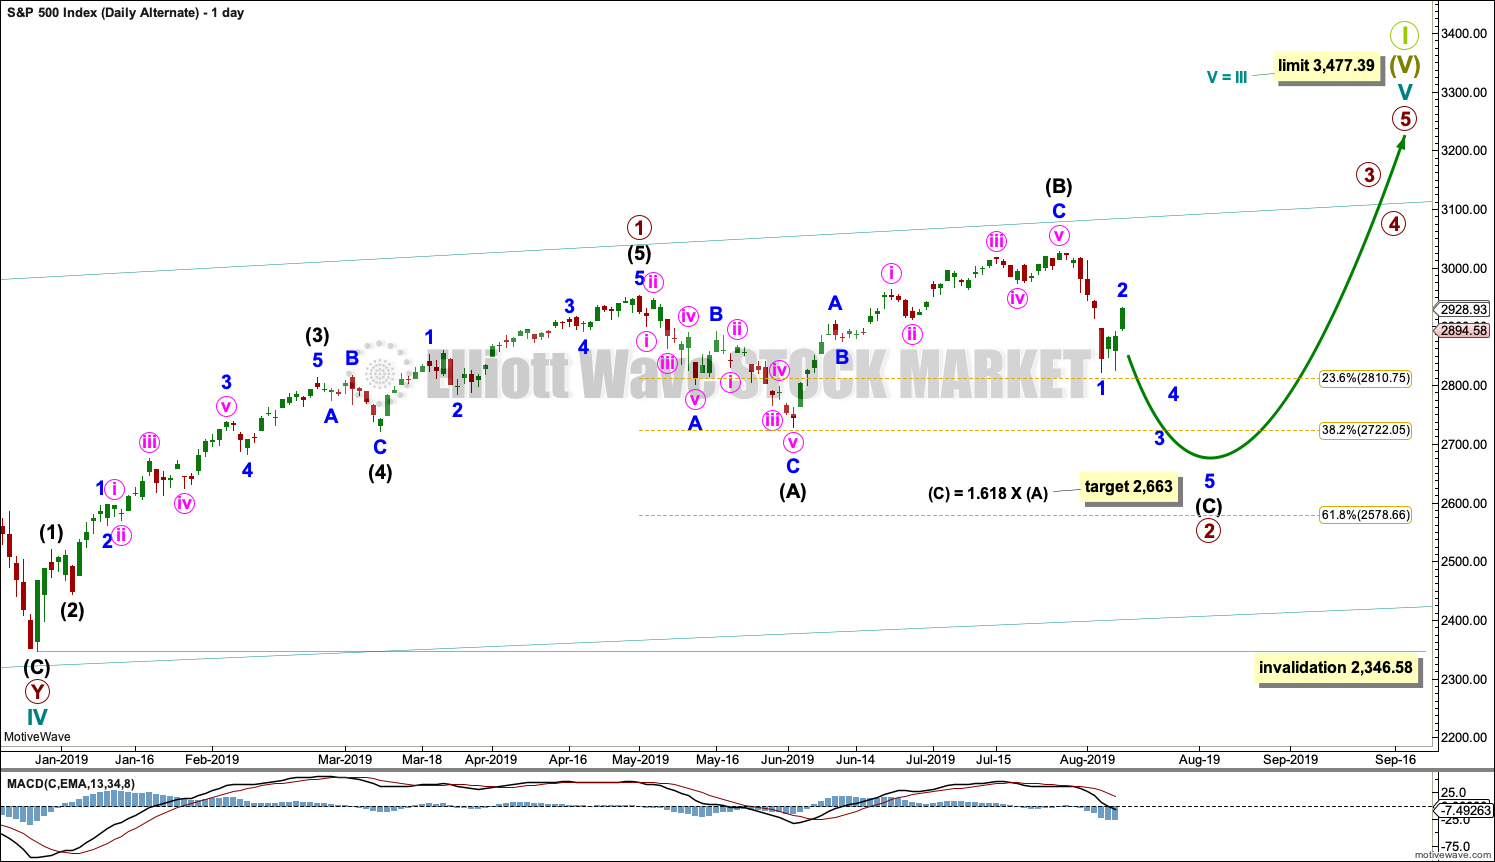
It is possible that primary wave 2 may not be over and continue further as an expanded flat correction. Within the expanded flat, intermediate wave (B) is a 1.33 length of intermediate wave (A), within the most common range of up to 1.38.
Intermediate wave (C) for this wave count should now move below the end of intermediate wave (A) to avoid a truncation. The target calculated would expect this.
If price falls through the first target, then the next target may be the 0.618 Fibonacci Ratio about 2,579.
Strong and final support may be expected at the lower edge of the teal Elliott channel.
ALTERNATE HOURLY CHART
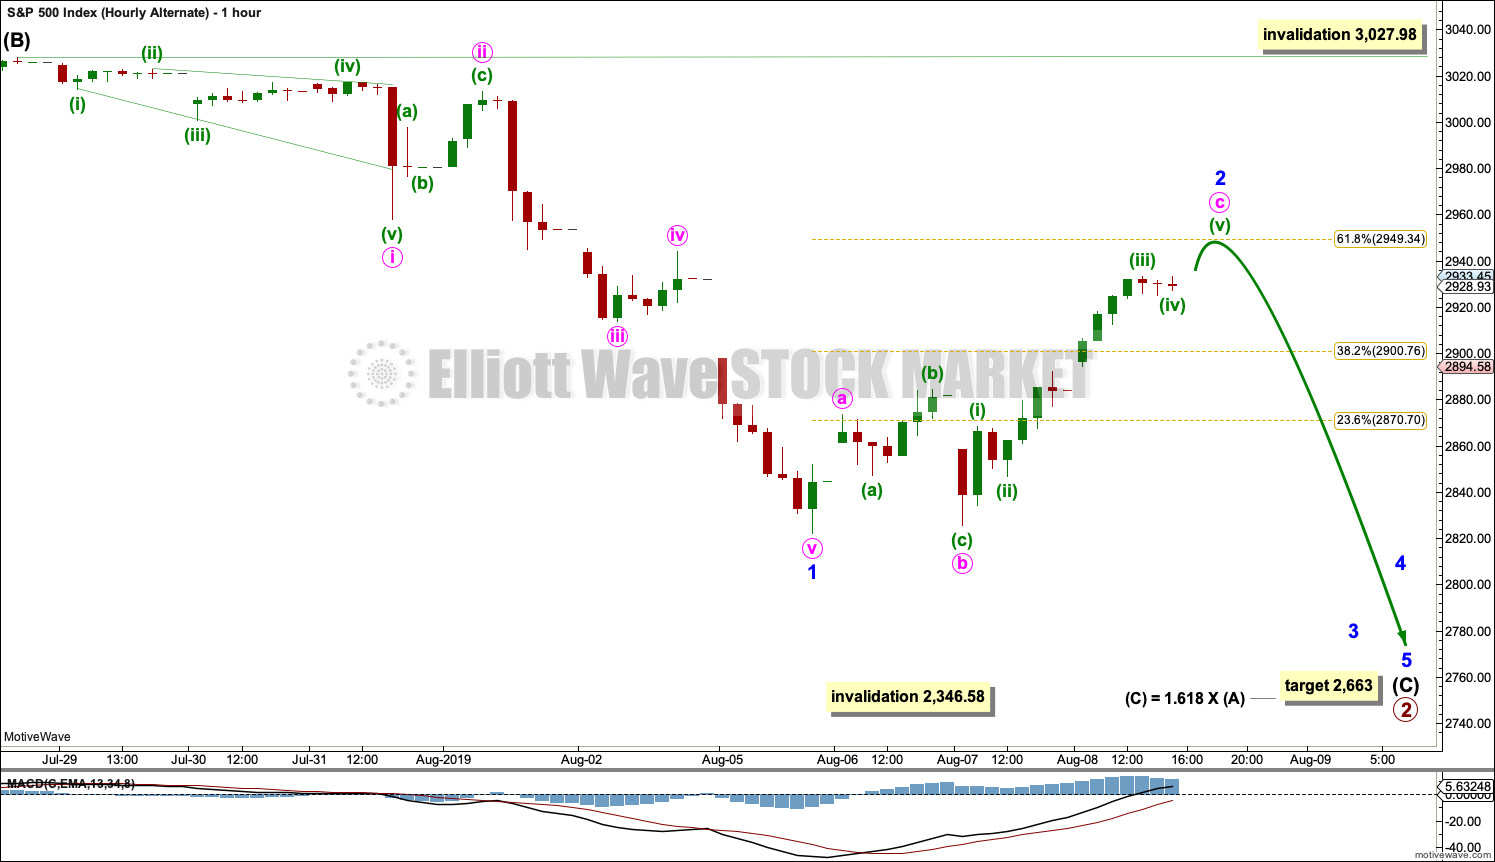
Click chart to enlarge.
Intermediate wave (C) must subdivide as a five wave structure. Minor wave 1 may have been complete at the last low. Minor wave 2 may end about the 0.618 Fibonacci Ratio at 2,949.34.
This wave count expects the next wave down to be a third wave. This should exhibit strength.
Minor wave 2 may not move beyond the start of minor wave 1 above 3,027.98.
SECOND WAVE COUNT
WEEKLY CHART
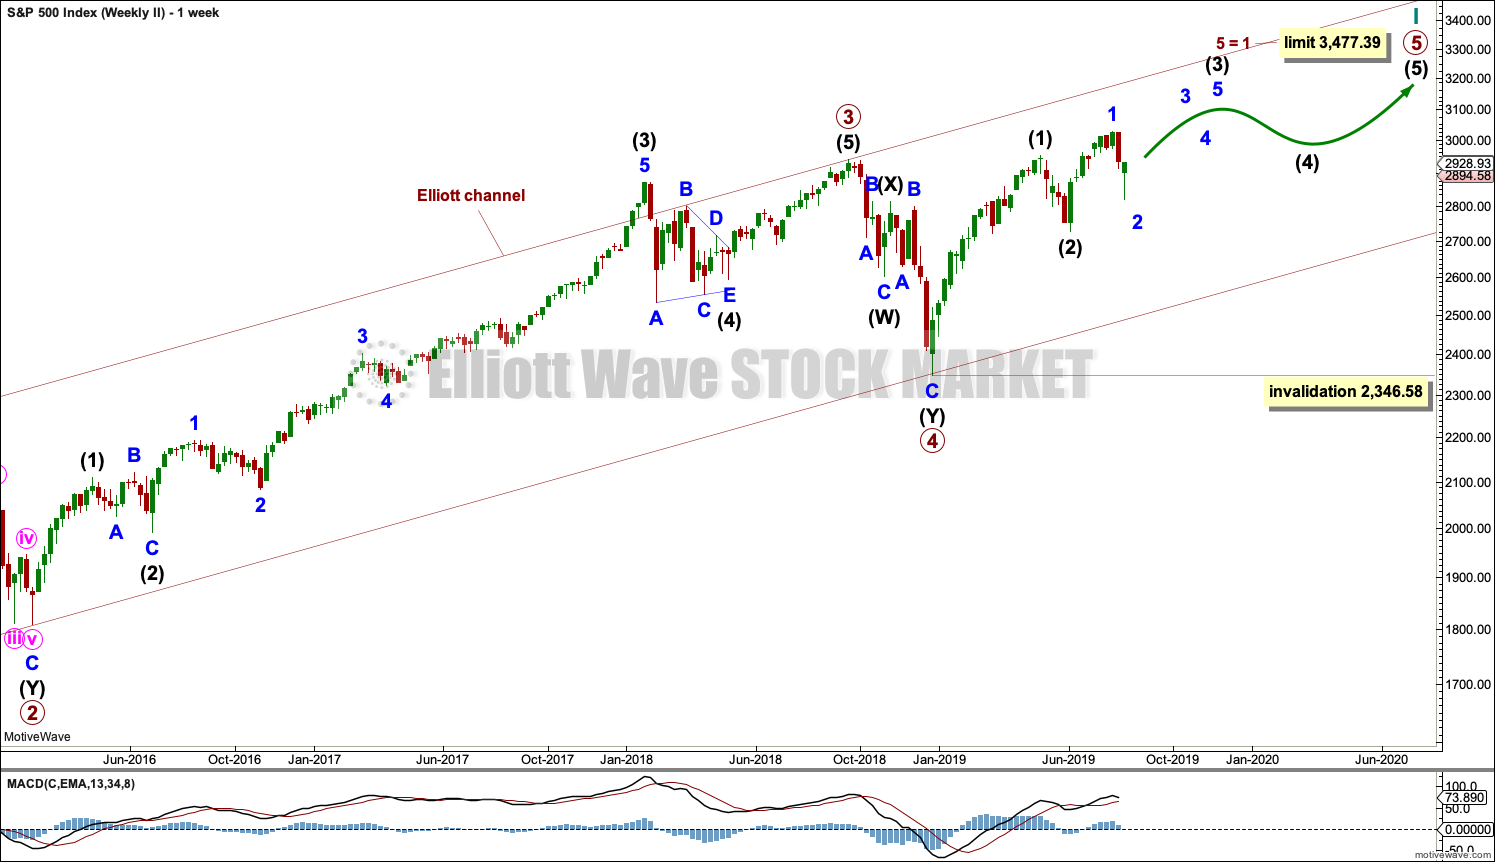
Click chart to enlarge.
This weekly chart is almost identical to the first weekly chart, with the sole exception being the degree of labelling.
This weekly chart moves the degree of labelling for the impulse beginning in March 2009 all down one degree. This difference is best viewed on monthly charts.
The impulse is still viewed as nearing an end; a fifth wave is still seen as needing to complete higher. This wave count labels it primary wave 5.
TECHNICAL ANALYSIS
WEEKLY CHART
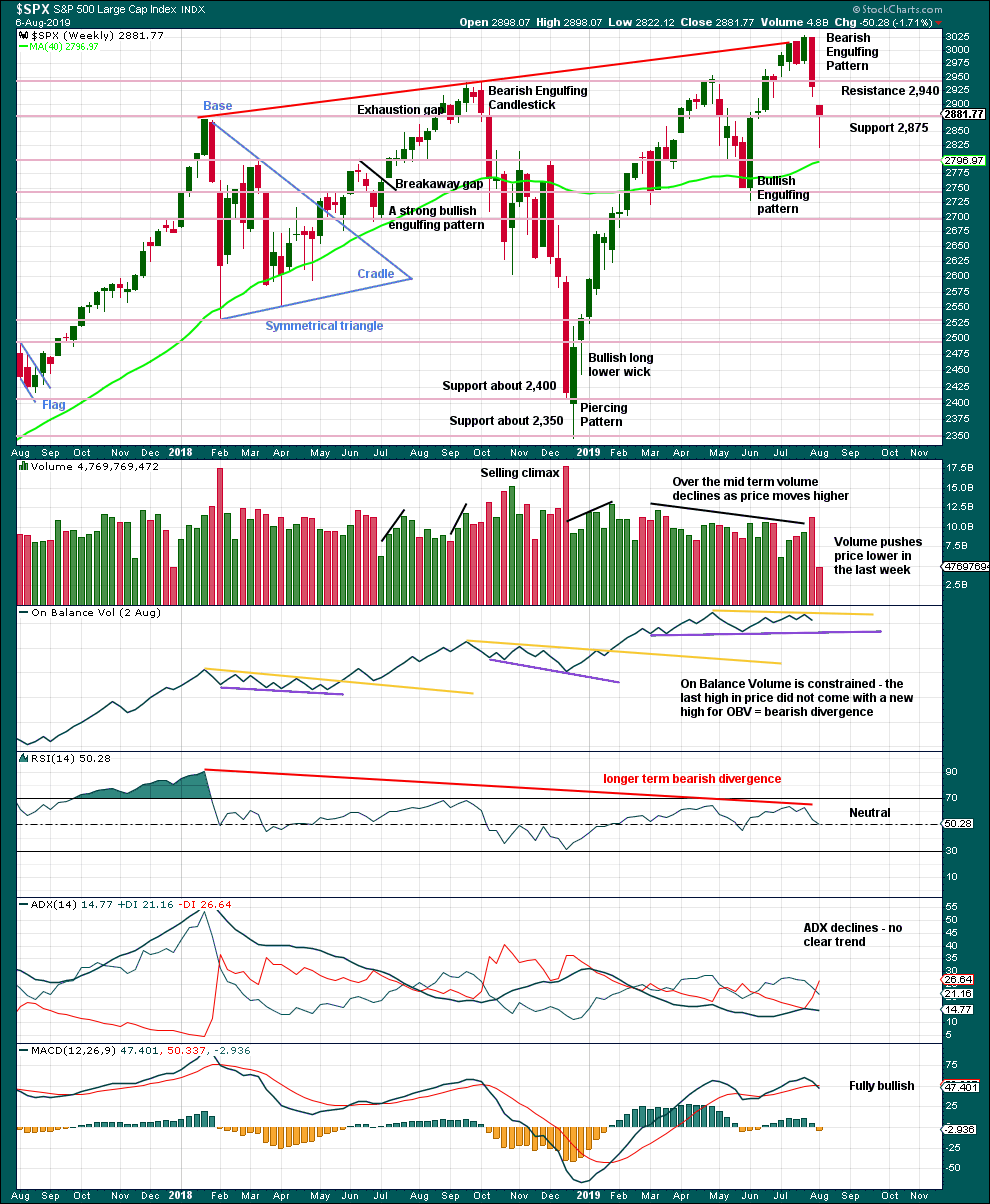
Click chart to enlarge. Chart courtesy of StockCharts.com.
Last week a very strong Bearish Engulfing candlestick pattern supports the alternate Elliott wave count. It has good support from volume.
DAILY CHART
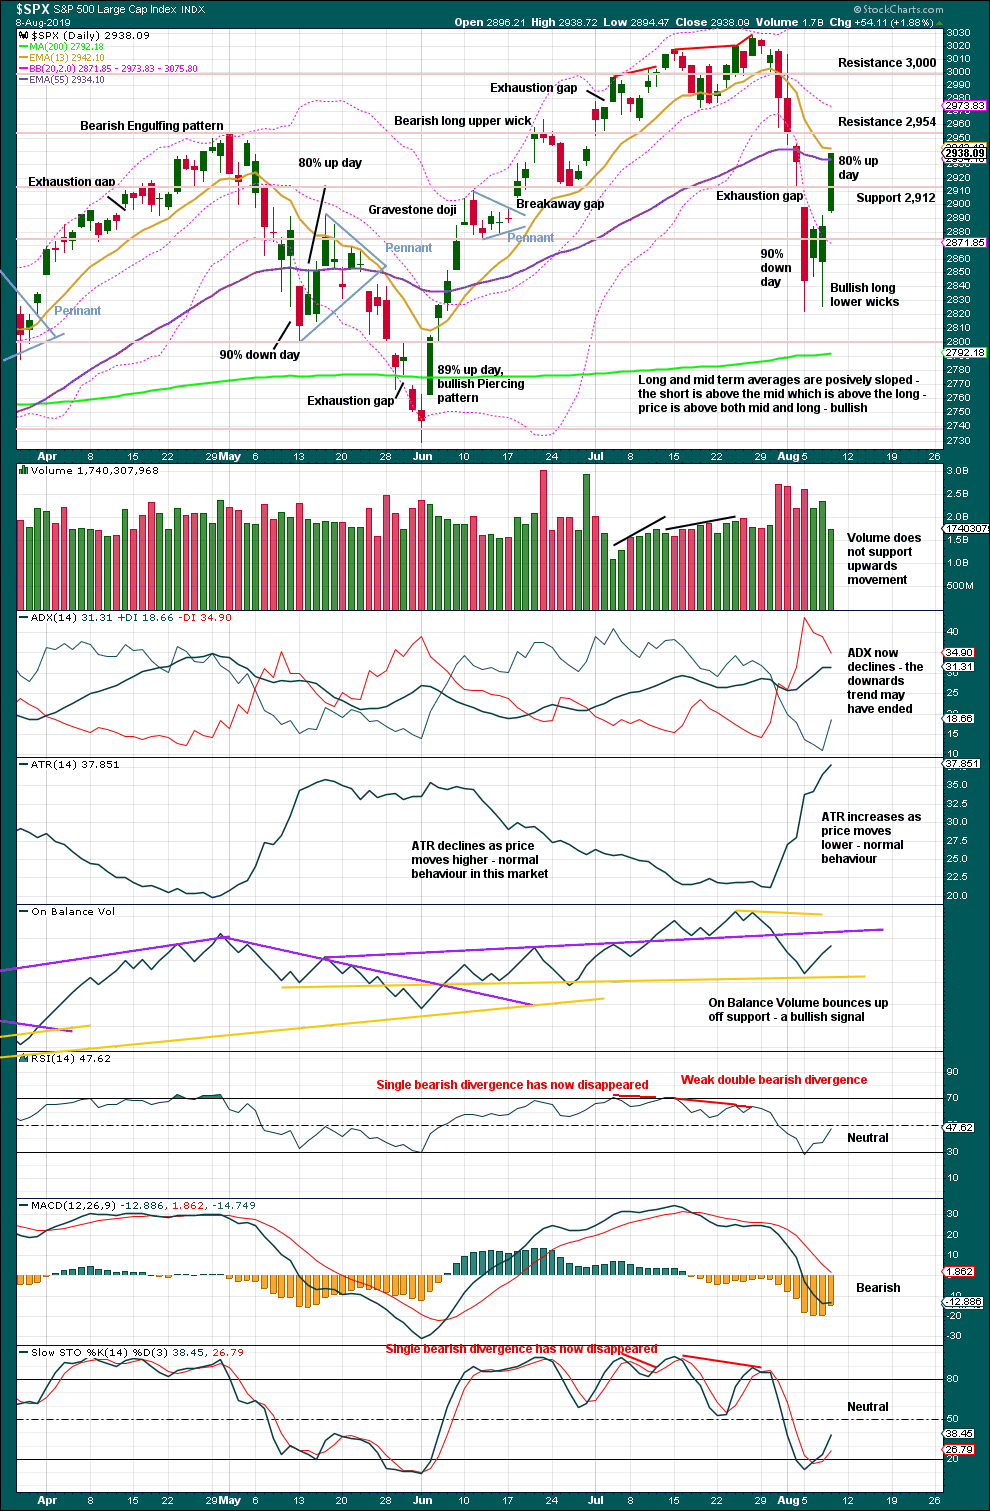
Click chart to enlarge. Chart courtesy of StockCharts.com.
Support for the view that a low is now in place:
– An 80% up day.
– A close of the last gap (it is renamed an exhaustion gap).
– A shaven head on today’s candlestick.
– ADX declines.
– RSI reached oversold at the low.
Support for a bearish outlook:
– Weak volume for this last upwards day (but this support is slight because declining volume on rising price has been a feature of this bull market now for years)
BREADTH – AD LINE
WEEKLY CHART
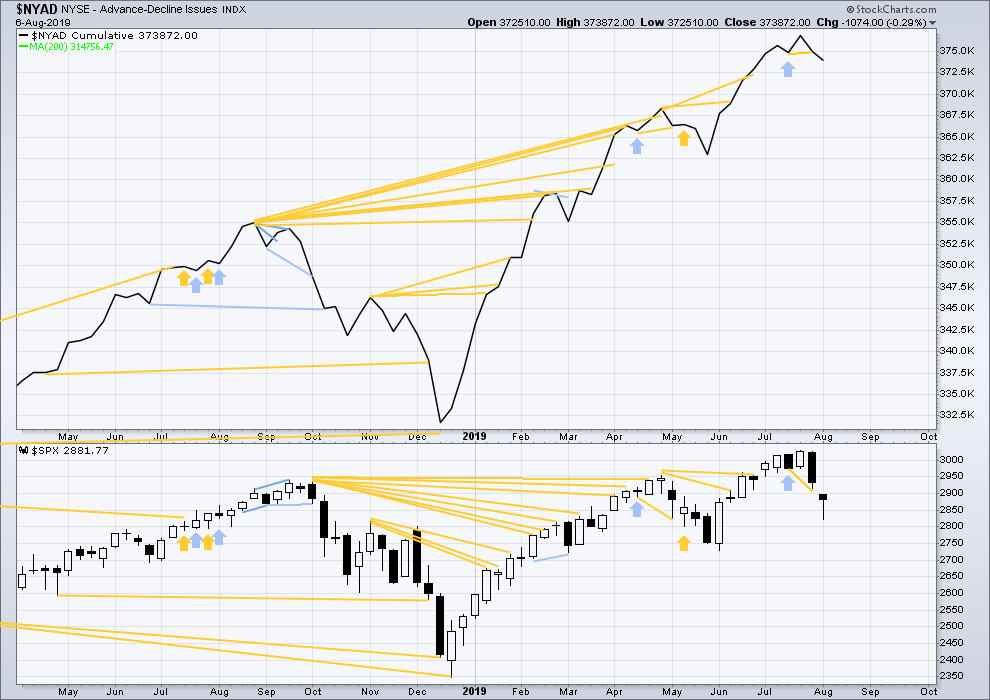
Click chart to enlarge. Chart courtesy of StockCharts.com. So that colour blind members are included, bearish signals
will be noted with blue and bullish signals with yellow.
Bear markets from the Great Depression and onwards have been preceded by an average minimum of 4 months divergence between price and the AD line with only two exceptions in 1946 and 1976. With the AD line making new all time highs again this week, the end of this bull market and the start of a new bear market is very likely a minimum of 4 months away, which is mid November 2019.
In all bear markets in the last 90 years there is some positive correlation (0.6022) between the length of bearish divergence and the depth of the following bear market. No to little divergence is correlated with more shallow bear markets. Longer divergence is correlated with deeper bear markets.
If a bear market does develop here, it comes after no bearish divergence. It would therefore more likely be shallow.
Last week price has made a new low below the short term low two weeks prior, but the AD line has failed to make a corresponding new low by a small margin. This divergence is bullish for the short term.
DAILY CHART
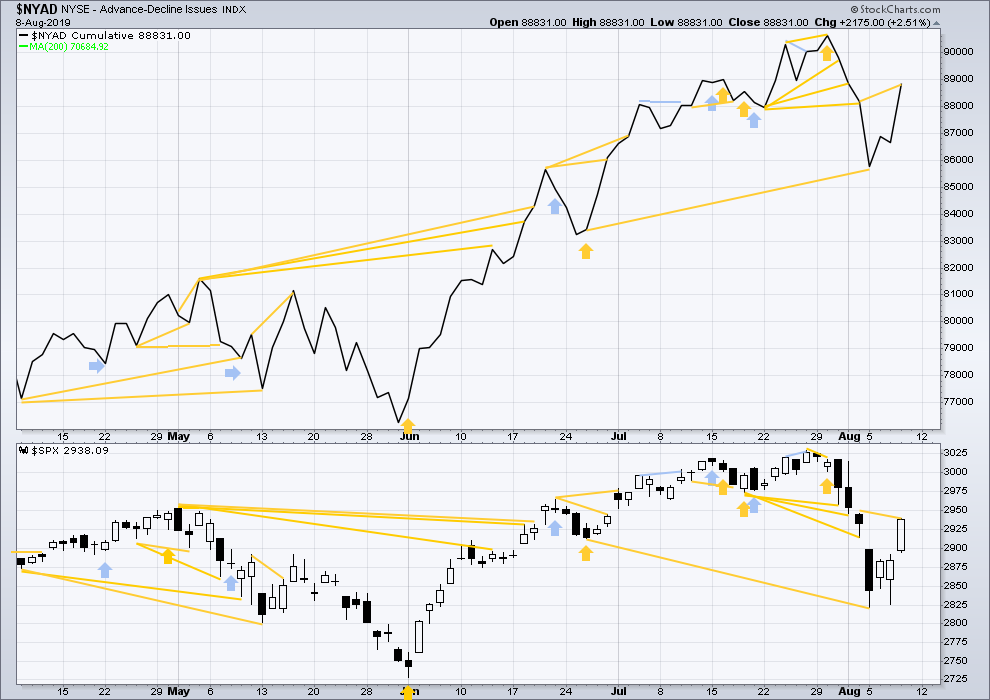
Click chart to enlarge. Chart courtesy of StockCharts.com. So that colour blind members are included, bearish signals
will be noted with blue and bullish signals with yellow.
Breadth should be read as a leading indicator.
Mid-term bullish divergence has been followed by upwards movement. Today there is new short-term bullish divergence. The AD line has made a new high above the prior high of the 2nd of August, but price has not. This supports the main Elliott wave count.
The rise in price is broad across all of large, mid and small caps. This is bullish.
VOLATILITY – INVERTED VIX CHART
WEEKLY CHART
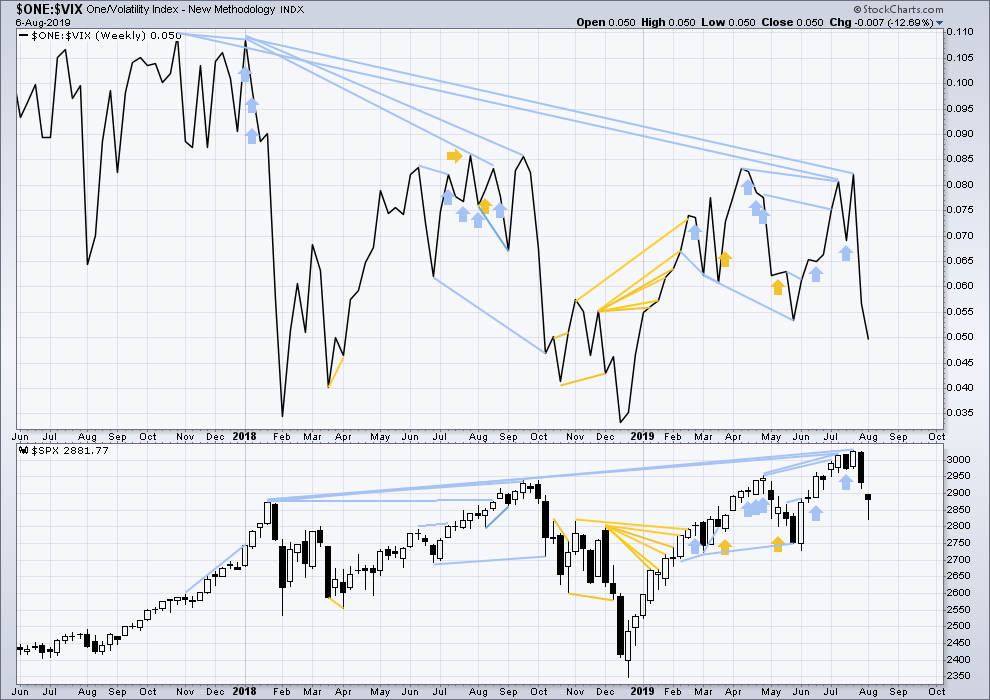
Click chart to enlarge. Chart courtesy of StockCharts.com. So that colour blind members are included, bearish signals
will be noted with blue and bullish signals with yellow.
The all time high for inverted VIX (which is the same as the low for VIX) was on 30th October 2017. There is now nearly one year and nine months of bearish divergence between price and inverted VIX.
The rise in price is not coming with a normal corresponding decline in VIX; VIX remains elevated. This long-term divergence is bearish and may yet develop further as the bull market matures.
This divergence may be an early warning, a part of the process of a top developing that may take years. It may not be useful in timing a trend change.
Last week price and inverted VIX have both moved lower. Neither have made a new swing low below the prior swing low of the weeks beginning 28th May / 3rd June.
DAILY CHART
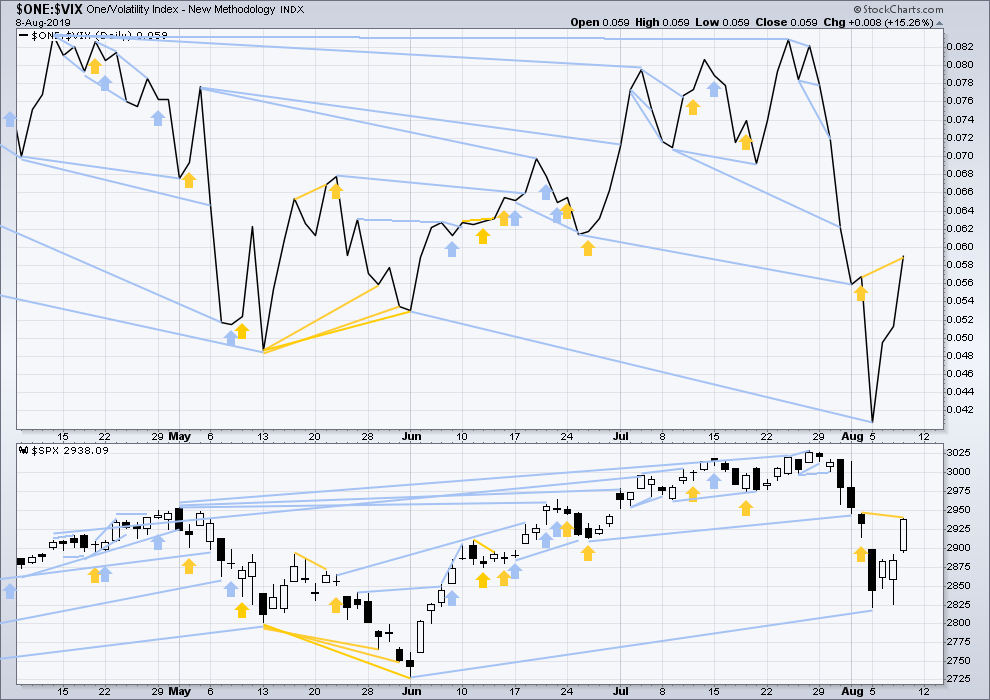
Click chart to enlarge. Chart courtesy of StockCharts.com. So that colour blind members are included, bearish signals
will be noted with blue and bullish signals with yellow.
Bearish divergence has not been followed by more downwards movement. The divergence may have failed.
Today inverted VIX has made a new high above the prior high of the 2nd of August, but price has not. VIX is currently declining faster than price is rising. This divergence is bullish and confirms bullish divergence on the AD line.
DOW THEORY
Dow Theory confirmed a bear market in December 2018. This does not necessarily mean a bear market at Grand Super Cycle degree though; Dow Theory makes no comment on Elliott wave counts. On the 25th of August 2015 Dow Theory also confirmed a bear market. The Elliott wave count sees that as part of cycle wave II. After Dow Theory confirmation of a bear market in August 2015, price went on to make new all time highs and the bull market continued.
DJIA: 23,344.52 – a close on the 19th of December at 23,284.97 confirms a bear market.
DJT: 9,806.79 – price has closed below this point on the 13th of December.
S&P500: 2,532.69 – a close on the 19th of December at 2,506.96 provides support to a bear market conclusion.
Nasdaq: 6,630.67 – a close on the 19th of December at 6,618.86 provides support to a bear market conclusion.
With all the indices having moved higher following a Dow Theory bear market confirmation, Dow Theory would confirm a bull market if the following highs are made:
DJIA: 26,951.81 – a close above this point has been made on the 3rd of July 2019.
DJT: 11,623.58 – to date DJT has failed to confirm an ongoing bull market.
S&P500: 2,940.91 – a close above this point was made on the 29th of April 2019.
Nasdaq: 8,133.30 – a close above this point was made on the 26th of April 2019.
Published @ 08:26 p.m. EST.
—
Careful risk management protects your trading account(s).
Follow my two Golden Rules:
1. Always trade with stops.
2. Risk only 1-5% of equity on any one trade.
—
New updates to this analysis are in bold.
Hourly chart updated:
Minute wave iv on the five minute chart looks like a complete zigzag. This would give perfect alternation with the flat of minute ii.
When minute v has moved above the end of minute iii a truncation would be avoided. At that stage the invalidation point moves down to the low.
Alternate hourly chart updated:
Minor 2 should now be over.
For the main hourly, this is how I’m labelling minute iv. A single zigzag, it fits okay.
5 min chart
A-B-C?
1-2-3?
my current working model. tgts adjusted from yesterday based on the add of today’s price action…
to clarify, the tgt’s are for the completion of the minor 1, and probably the higher ones don’t make much sense (though they may have some validity re: the minor 3). So the target #2 at 2981 is standing out to me as Very Likely to complete the minor 1, and it’s possible the minute v is a shorty so target #1 at 2947.5 is in play too.
Hi everyone
At this point I think lara’s alternative count now looks like a 50/50 shot
All thoughts welcome
Im really on the fence at the moment
Agreed, and any more downward movement and those odds keep shifting to the bear side IMO. Same situation in RUT. The move up in SPX looks like one big and completed ABC and now the A swing of a Y down. Perhaps…I think the cusp is right here and now. A/D rations for RUT are bad, 500-1500, and even worse for SPX, 60-440!
I’ll add that more often than not, this kind of violent “up!!!…down!!!” action is corrective overall. Big market motive waves tend to be more stately.
Well, the bull case has held so far with some movement back up. We’ll see how this plays out for the next 3 hours…
Okay I bit on the long side for moderate positions, UWM and UPRO, stops underneath today’s lows, and I’ll take 1/2 at 3% profit…
I also want to thank Kevin for his many posts here and for also making his Spec-K site with all its information available to us. This is quite kind of you Kevin. So thank you. If you have not yet visited Kevin’s Alert site, you should avail yourself of the opportunity. It is a gift from which we can learn as well as use in our financial endeavors.
Kevin, like me I am guessing, assumes all people understand anything we share on this site is for entertainment purposes only, and any action people might make based on such forum post is entirely their own responsibility. We share in no liability.
Once again Kevin, thank you much.
Oh you must have missed the disclaimer at the bottom of the first page ;).
Hope folks can make $ from some of the set ups.
This correction and turn looks very suspicious to me. It just looks “incomplete”. I will be surprised zero to see the alternate play out.
I did not even read it. I did not look for one either. I assumed it and would never hold anyone liable for my decisions, financial or otherwise. Thanks again.
That’s because it was missing until you implicitly pointed that out, lol!!!
Thanks for your kind words Rodney.
I guess we haven’t had any Zweig breadth thrusts or your other triggers yet on this placid correction day. It’s fascinating how the market breathes. The ardor of yesterday…gone today! It’s all about herd mentality.
I agree the wave structure for this correction looks incomplete.
Two in a row. Goody for me.
Great analysis and commentary as always, Lara. Thank you. You track and share with us tremendously invaluable information and experience, putting it in a way we can understand as well as use in our financial endeavors. Thanks again.
Thanks very much Rodney