
Sideways movement fits the main Elliott wave count. The target remains the same.
Summary: The main Elliott wave count expects the pullback may continue lower to 2,663 or 2,579. A new low below 2,822.12 would increase the probability of this scenario.
Alternatively, a new high above 2,914.11 and then 2,958.08 or a 90% upwards day would support the alternate wave count. It looks at the possibility a low may be in place, a target is at 3,336.
The biggest picture, Grand Super Cycle analysis, is here.
Monthly charts were last published here, with video here. There are two further alternate monthly charts here, with video here.
ELLIOTT WAVE COUNTS
The two weekly Elliott wave counts below will be labelled First and Second. They may be about of even probability. When the fifth wave currently unfolding on weekly charts may be complete, then these two wave counts will diverge on the severity of the expected following bear market. To see an illustration of this future divergence monthly charts should be viewed.
FIRST WAVE COUNT
WEEKLY CHART
Click chart to enlarge.
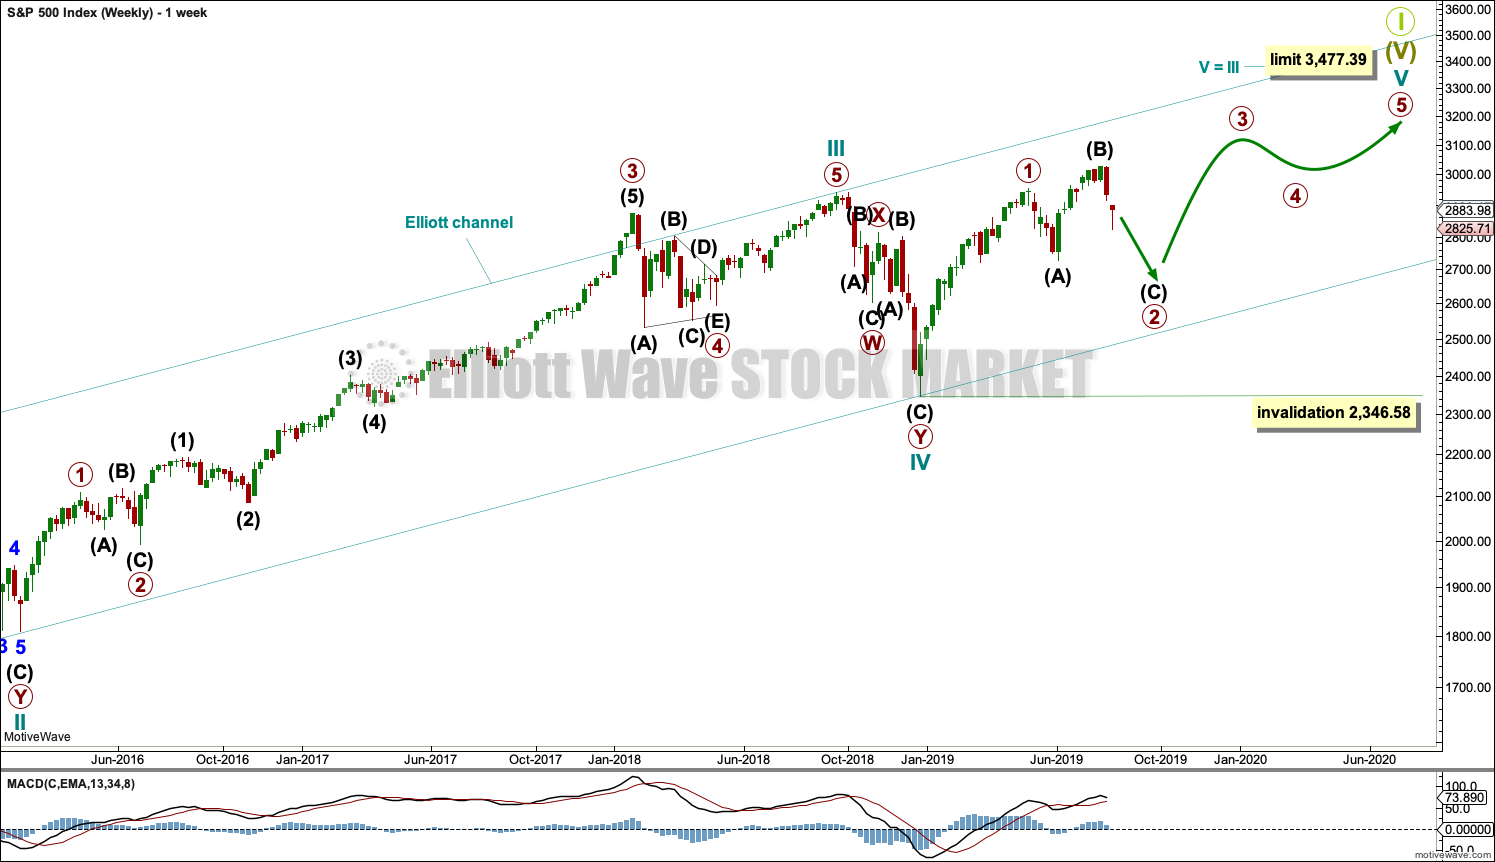
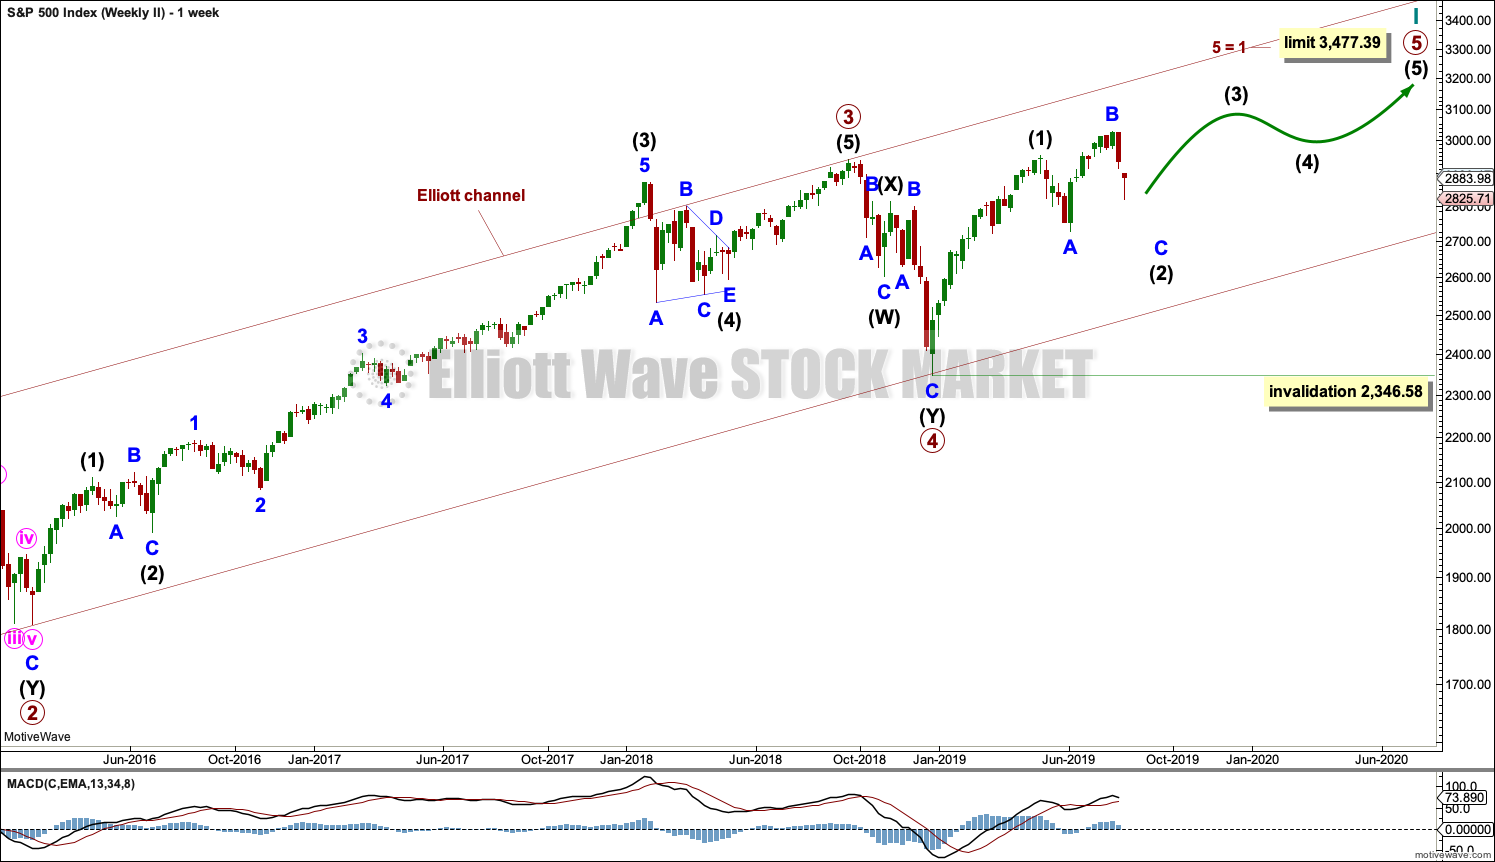
The basic Elliott wave structure consists of a five wave structure up followed by a three wave structure down (for a bull market). This wave count sees the bull market beginning in March 2009 as an incomplete five wave impulse and now within the last fifth wave, which is labelled cycle wave V. This impulse is best viewed on monthly charts. The weekly chart focusses on the end of it.
Elliott wave is fractal. This fifth wave labelled cycle wave V may end a larger fifth wave labelled Super Cycle wave (V), which may end a larger first wave labelled Grand Super Cycle wave I.
The teal Elliott channel is drawn using Elliott’s first technique about the impulse of Super Cycle wave (V). Draw the first trend line from the end of cycle wave I (off to the left of the chart, the weekly candlestick beginning 30th November 2014) to the end of cycle wave III, then place a parallel copy on the end of cycle wave II. This channel perfectly shows where cycle wave IV ended at support. The strongest portion of cycle wave III, the end of primary wave 3, overshoots the upper edge of the channel. This is a typical look for a third wave and suggests the channel is drawn correctly and the way the impulse is counted is correct.
Within Super Cycle wave (V), cycle wave III is shorter than cycle wave I. A core Elliott wave rule states that a third wave may never be the shortest. For this rule to be met in this instance, cycle wave V may not be longer in length than cycle wave III. This limit is at 3,477.39.
Cycle wave V may subdivide either as an impulse or an ending diagonal. Impulses are much more common. I have charted the possibility of an ending diagonal and will keep it updated, but the probability at this stage is too low for daily publication. It too needs new all time highs and so with no divergence at this stage it shall not be published.
The daily charts below will now focus on all of cycle wave V.
In historic analysis, two further monthly charts have been published that do not have a limit to upwards movement and are more bullish than this wave count. Members are encouraged to consider those possibilities (links below summary) alongside the wave counts presented on a daily and weekly basis.
MAIN DAILY CHART
Click chart to enlarge.
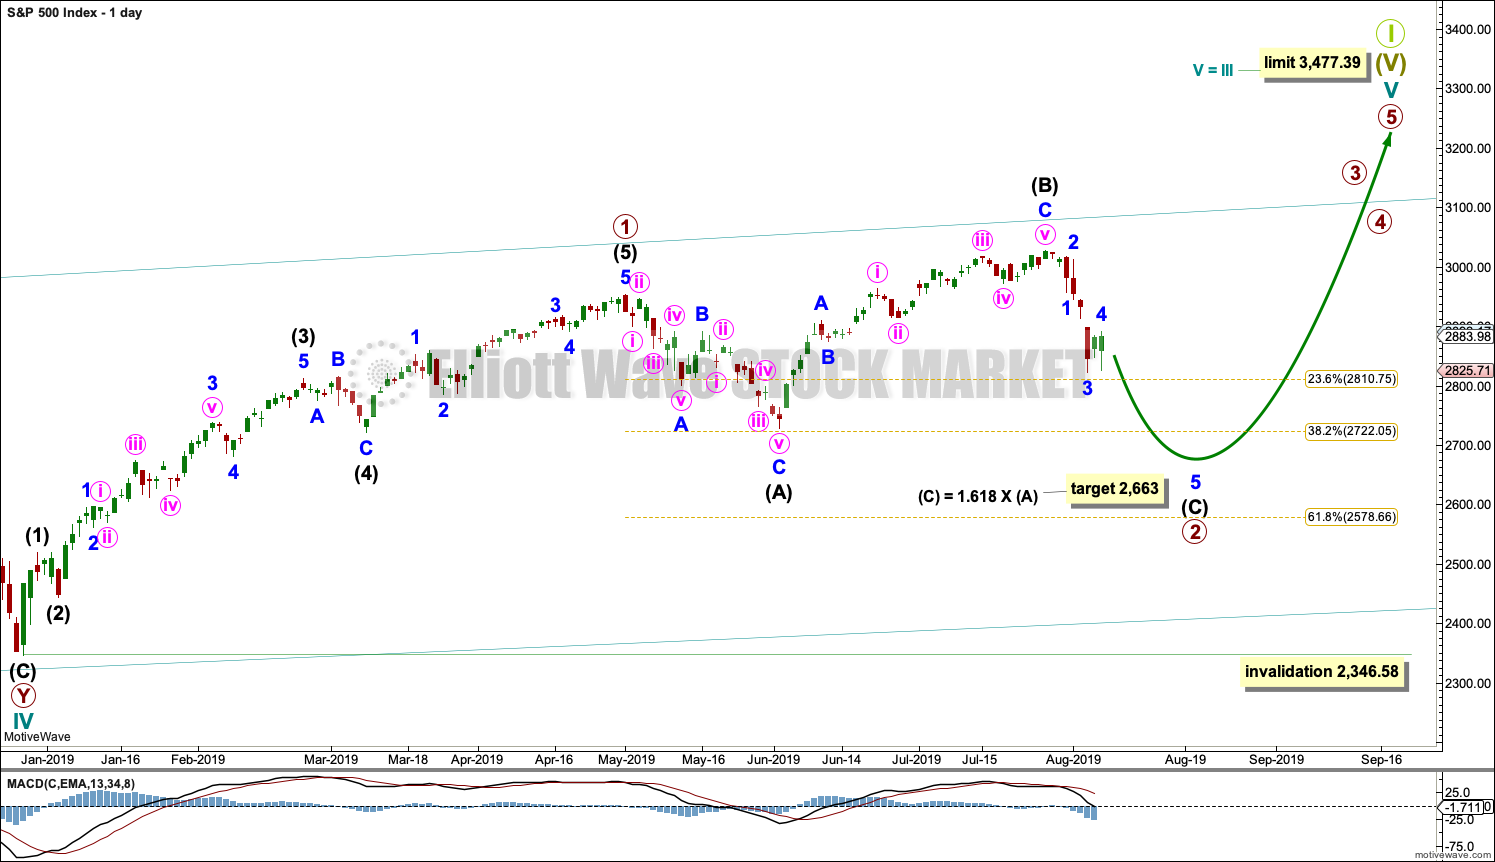
It is possible that primary wave 2 may not be over and continue further as an expanded flat correction. Within the expanded flat, intermediate wave (B) is a 1.33 length of intermediate wave (A), within the most common range of up to 1.38.
Intermediate wave (C) for this wave count should now move below the end of intermediate wave (A) to avoid a truncation. The target calculated would expect this.
If price falls through the first target, then the next target may be the 0.618 Fibonacci Ratio about 2,579.
Strong and final support may be expected at the lower edge of the teal Elliott channel.
MAIN HOURLY CHART
Click chart to enlarge.
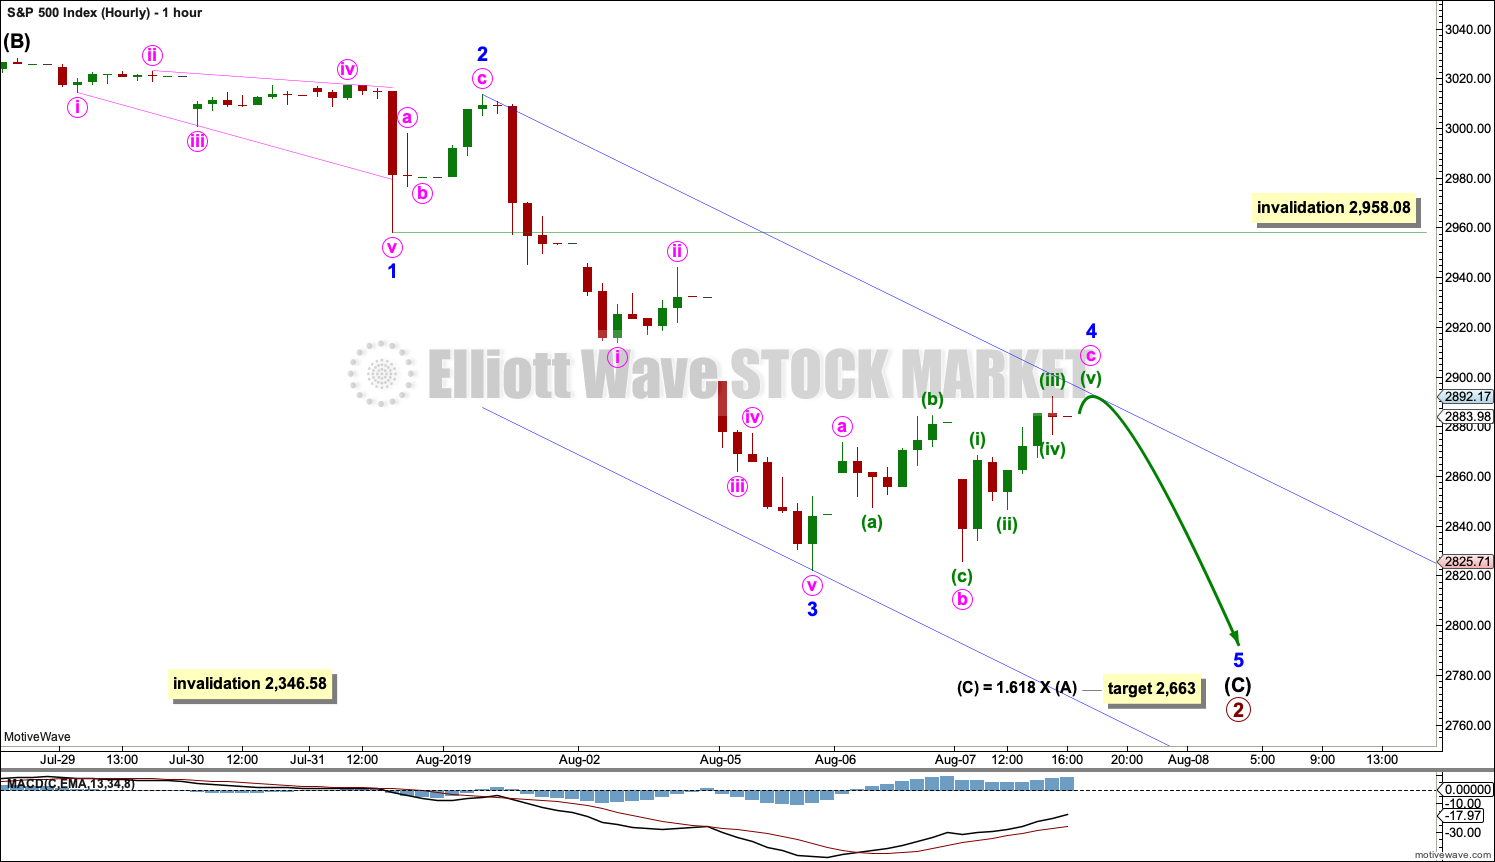
Intermediate wave (C) must subdivide as a five wave structure. Minor waves 1 through to 3 within intermediate wave (C) may be complete.
Minor wave 4 may not move into minor wave 1 price territory above 2,958.08.
Minor wave 4 may be almost complete. When it is complete, then the channel may be drawn from the ends of minor waves 2 to 4, with a parallel copy on the end of minor wave 3. Minor wave 5 may find support about the lower edge.
ALTERNATE DAILY CHART
Click chart to enlarge.
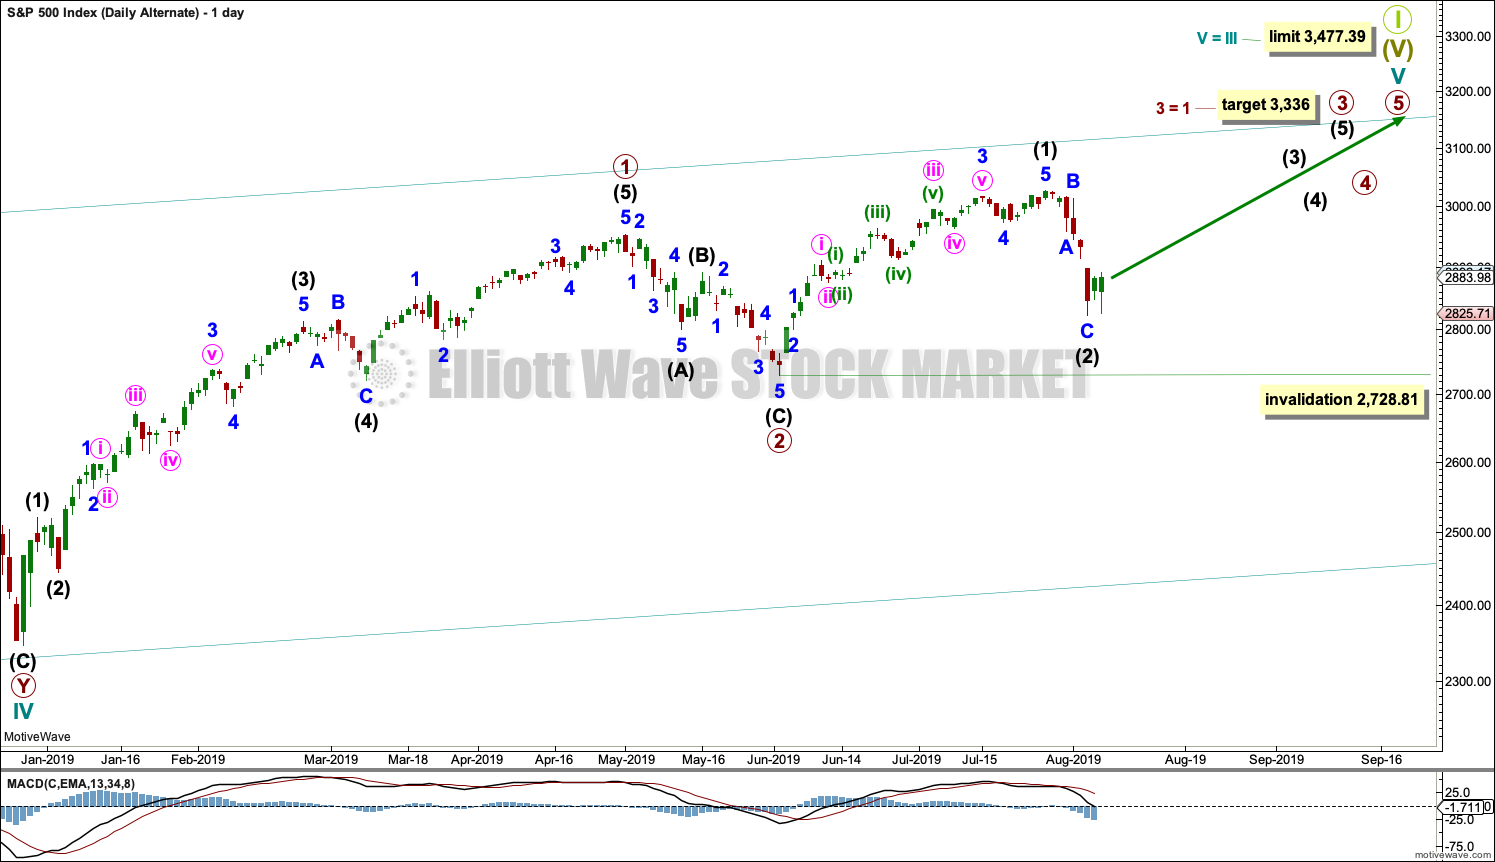
Cycle wave V must subdivide as a five wave motive structure. Within that five wave structure, primary waves 1 and 2 may be complete.
Primary wave 3 may only subdivide as an impulse. Within primary wave 3, intermediate waves (1) and (2) may now be complete. Intermediate wave (2) may have ended close to the 0.618 Fibonacci ratio of intermediate wave (1).
A target is calculated for primary wave 3 that fits with the higher limit for cycle wave V.
If intermediate wave (2) continues lower, then it may not move beyond the start of intermediate wave (1) below 2,728.81.
ALTERNATE HOURLY CHART
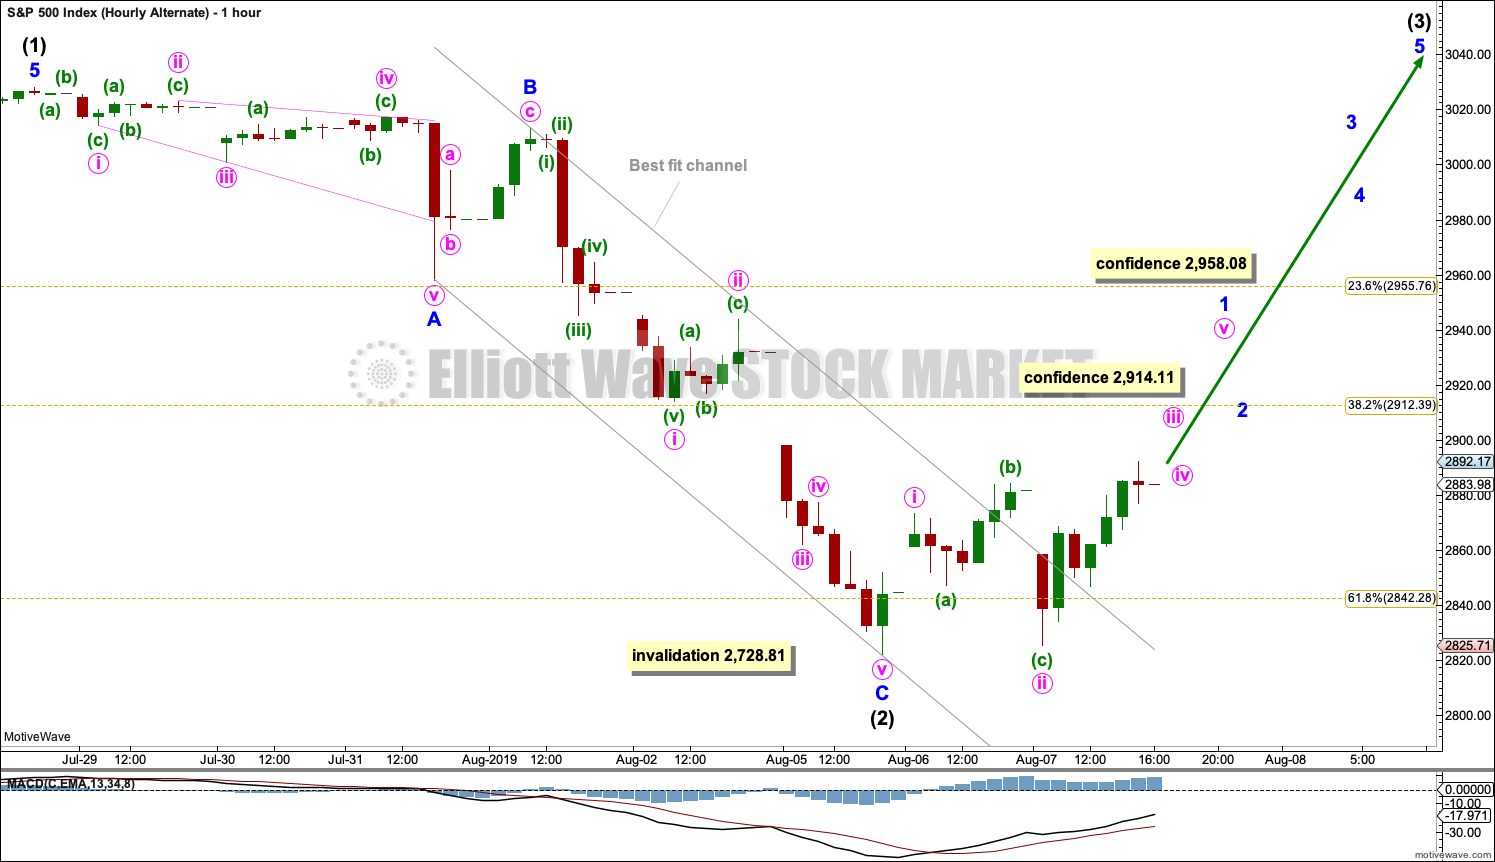
Click chart to enlarge.
It is possible that intermediate wave (2) may today be a complete zigzag, ending close to the 0.618 Fibonacci Ratio of intermediate wave (1). There is no Fibonacci Ratio between minor waves A and C.
A best fit channel is drawn about intermediate wave (2). The channel is now very clearly breached. This supports this wave count.
SECOND WAVE COUNT
WEEKLY CHART
Click chart to enlarge.
This weekly chart is almost identical to the first weekly chart, with the sole exception being the degree of labelling.
This weekly chart moves the degree of labelling for the impulse beginning in March 2009 all down one degree. This difference is best viewed on monthly charts.
The impulse is still viewed as nearing an end; a fifth wave is still seen as needing to complete higher. This wave count labels it primary wave 5.
TECHNICAL ANALYSIS
WEEKLY CHART
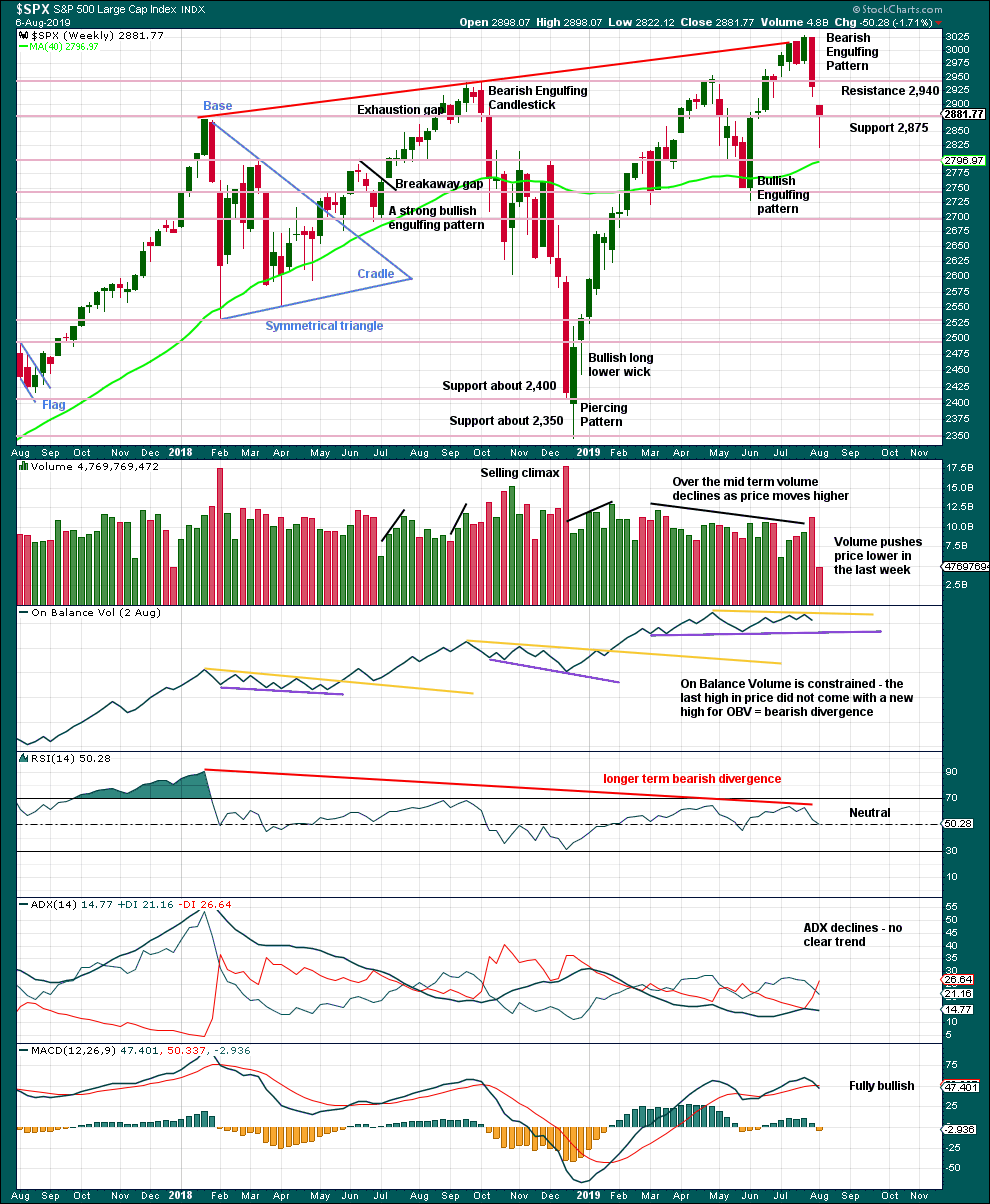
Click chart to enlarge. Chart courtesy of StockCharts.com.
Last week a very strong Bearish Engulfing candlestick pattern supports the alternate Elliott wave count. It has good support from volume.
DAILY CHART
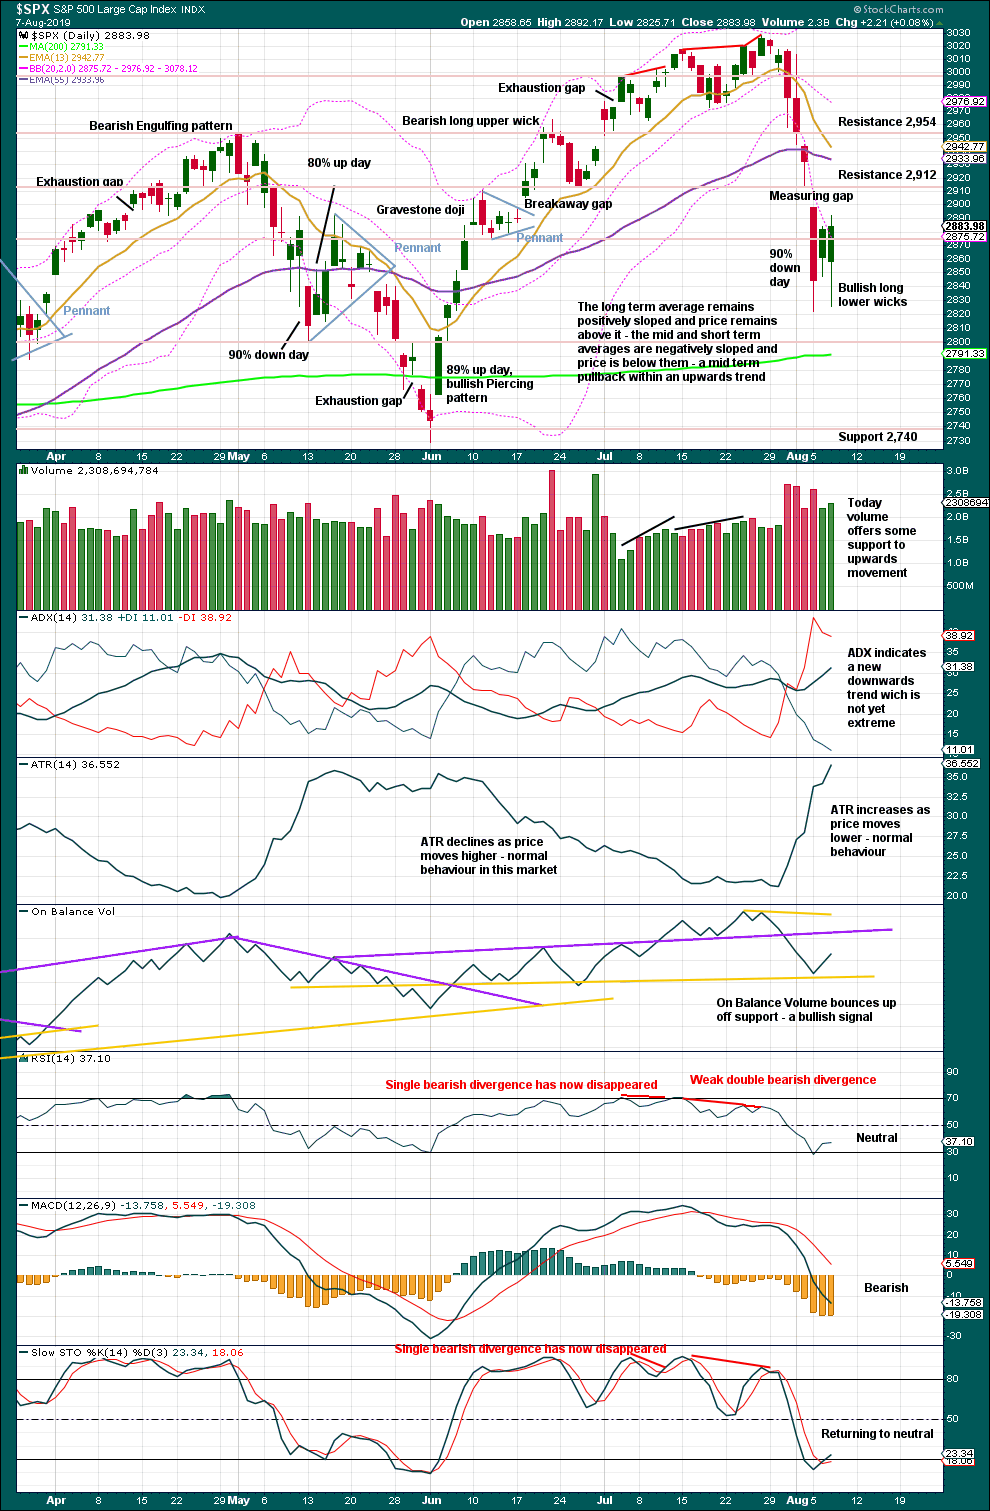
Click chart to enlarge. Chart courtesy of StockCharts.com.
Support for the main Elliott wave count:
– The absence of strength in the bounce of the last two days; there is no 80% nor 90% upwards day, which is often seen after a low.
– ADX indicates a downwards trend, which is not yet extreme. There is further room for price to fall.
– The measuring gap remains open.
Support for the alternate Elliott wave count:
– RSI reached oversold at the low.
– A bullish Harami candlestick pattern at the low.
– Bullish long lower wicks.
– Some increase in volume today supports upwards movement.
– A bullish signal from On Balance Volume.
BREADTH – AD LINE
WEEKLY CHART
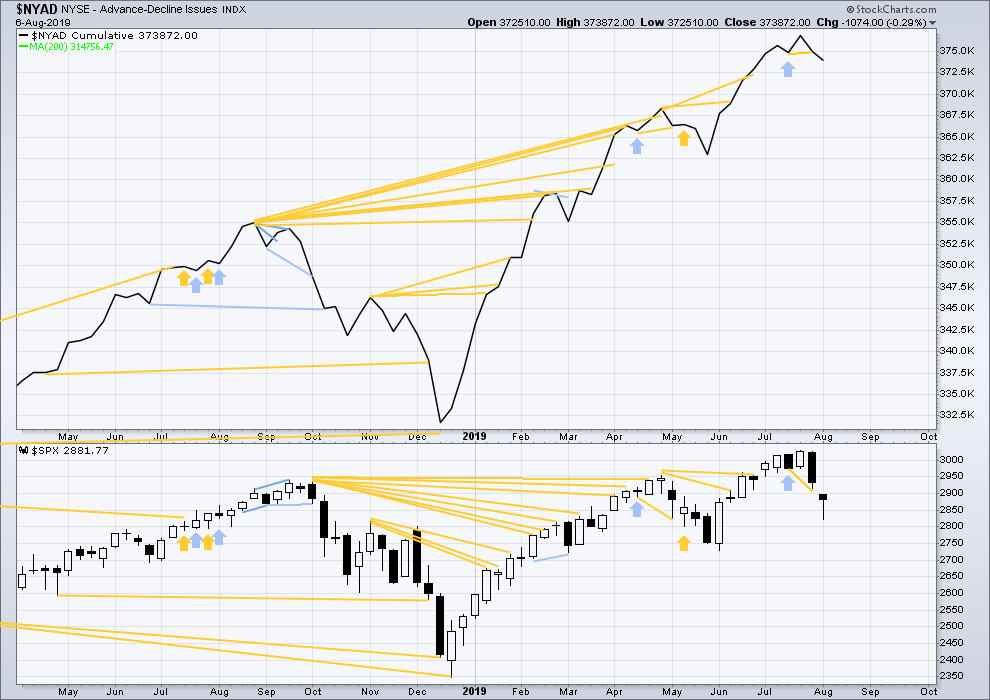
Click chart to enlarge. Chart courtesy of StockCharts.com. So that colour blind members are included, bearish signals
will be noted with blue and bullish signals with yellow.
Bear markets from the Great Depression and onwards have been preceded by an average minimum of 4 months divergence between price and the AD line with only two exceptions in 1946 and 1976. With the AD line making new all time highs again this week, the end of this bull market and the start of a new bear market is very likely a minimum of 4 months away, which is mid November 2019.
In all bear markets in the last 90 years there is some positive correlation (0.6022) between the length of bearish divergence and the depth of the following bear market. No to little divergence is correlated with more shallow bear markets. Longer divergence is correlated with deeper bear markets.
If a bear market does develop here, it comes after no bearish divergence. It would therefore more likely be shallow.
Last week price has made a new low below the short term low two weeks prior, but the AD line has failed to make a corresponding new low by a small margin. This divergence is bullish for the short term.
DAILY CHART
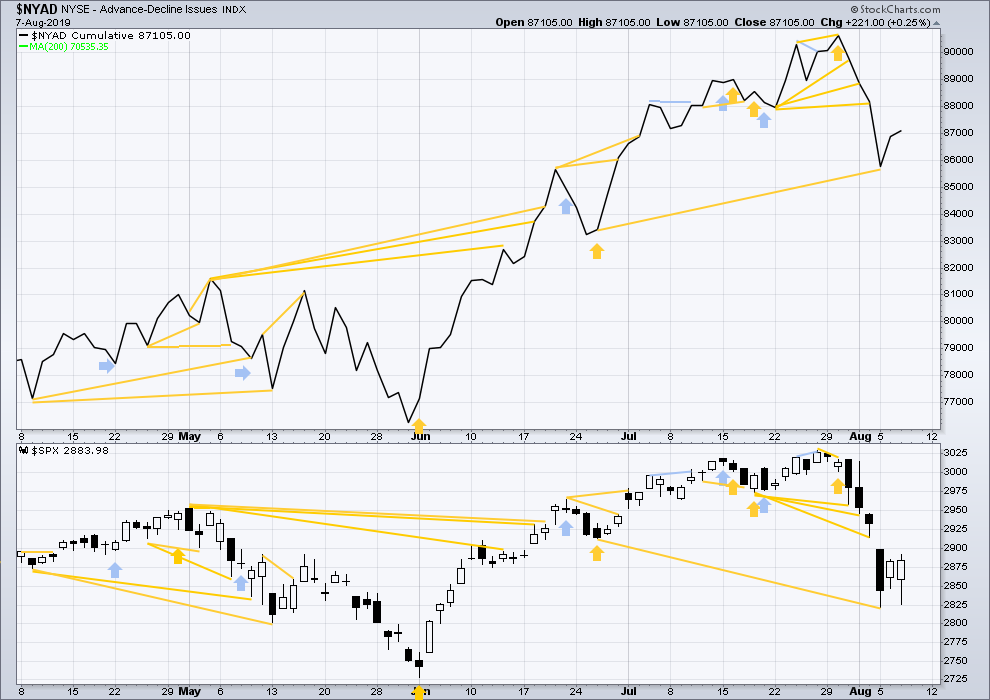
Click chart to enlarge. Chart courtesy of StockCharts.com. So that colour blind members are included, bearish signals
will be noted with blue and bullish signals with yellow.
Breadth should be read as a leading indicator.
Mid-term bullish divergence remains. This indicates a pullback here may be reasonably limited and may favour the alternate Elliott wave count.
Today both price and the AD line moved higher. There is no new short-term divergence.
VOLATILITY – INVERTED VIX CHART
WEEKLY CHART
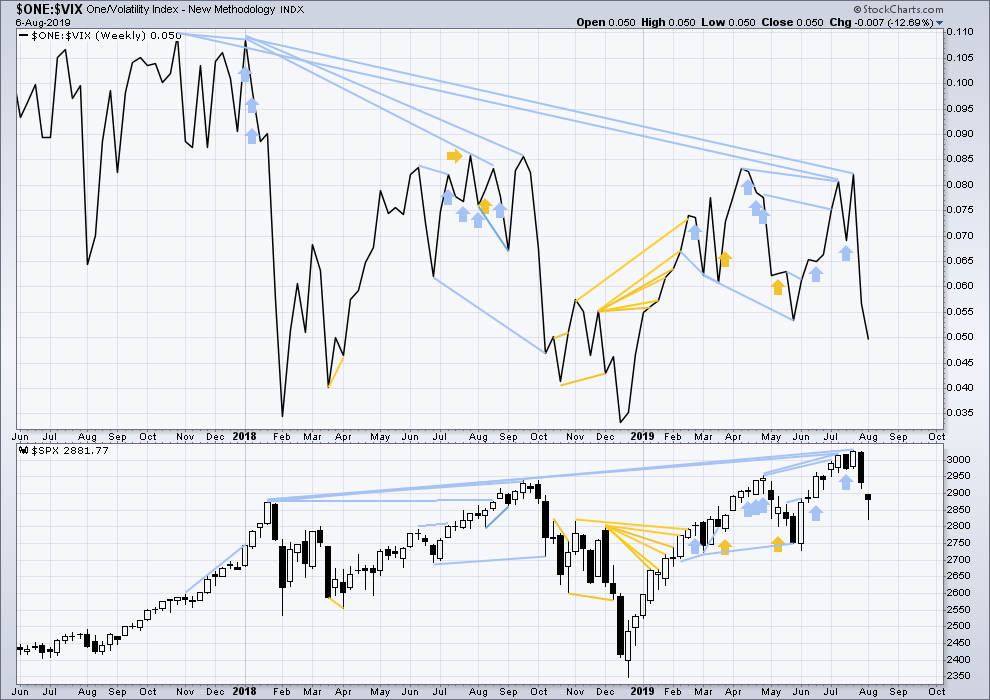
Click chart to enlarge. Chart courtesy of StockCharts.com. So that colour blind members are included, bearish signals
will be noted with blue and bullish signals with yellow.
The all time high for inverted VIX (which is the same as the low for VIX) was on 30th October 2017. There is now nearly one year and nine months of bearish divergence between price and inverted VIX.
The rise in price is not coming with a normal corresponding decline in VIX; VIX remains elevated. This long-term divergence is bearish and may yet develop further as the bull market matures.
This divergence may be an early warning, a part of the process of a top developing that may take years. It may not be useful in timing a trend change.
Last week price and inverted VIX have both moved lower. Neither have made a new swing low below the prior swing low of the weeks beginning 28th May / 3rd June.
DAILY CHART
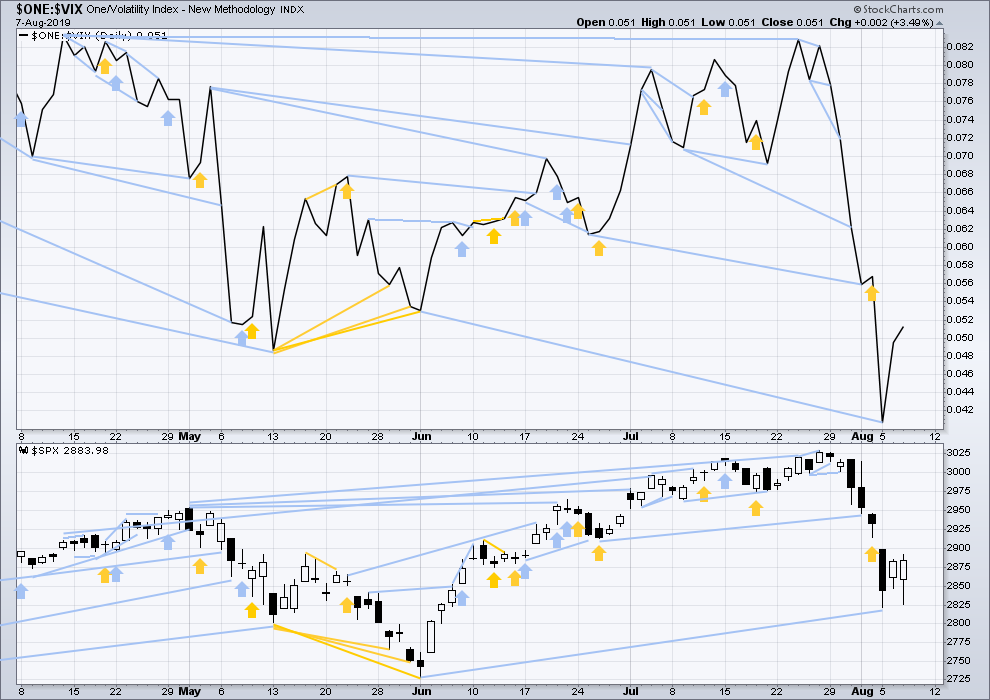
Click chart to enlarge. Chart courtesy of StockCharts.com. So that colour blind members are included, bearish signals
will be noted with blue and bullish signals with yellow.
Inverted VIX has made a new low below the last major low of the 3rd of June, but price has not. This divergence is bearish, but it is not confirmed by the AD line.
Today both inverted VIX and price have moved higher. There is no new divergence.
DOW THEORY
Dow Theory confirmed a bear market in December 2018. This does not necessarily mean a bear market at Grand Super Cycle degree though; Dow Theory makes no comment on Elliott wave counts. On the 25th of August 2015 Dow Theory also confirmed a bear market. The Elliott wave count sees that as part of cycle wave II. After Dow Theory confirmation of a bear market in August 2015, price went on to make new all time highs and the bull market continued.
DJIA: 23,344.52 – a close on the 19th of December at 23,284.97 confirms a bear market.
DJT: 9,806.79 – price has closed below this point on the 13th of December.
S&P500: 2,532.69 – a close on the 19th of December at 2,506.96 provides support to a bear market conclusion.
Nasdaq: 6,630.67 – a close on the 19th of December at 6,618.86 provides support to a bear market conclusion.
With all the indices having moved higher following a Dow Theory bear market confirmation, Dow Theory would confirm a bull market if the following highs are made:
DJIA: 26,951.81 – a close above this point has been made on the 3rd of July 2019.
DJT: 11,623.58 – to date DJT has failed to confirm an ongoing bull market.
S&P500: 2,940.91 – a close above this point was made on the 29th of April 2019.
Nasdaq: 8,133.30 – a close above this point was made on the 26th of April 2019.
Published @ 10:07 p.m. EST.
—
Careful risk management protects your trading account(s).
Follow my two Golden Rules:
1. Always trade with stops.
2. Risk only 1-5% of equity on any one trade.
—
New updates to this analysis are in bold.
Close to 90% up day.
I was just looking for that same thing, Gary. Thanks for the info. We have 2463 advancing issues over 3046 total issues traded. That is 81% advancing issues with 84% up volume. It looks like today’s move has significant strength and Intermediate 2 may be over.
Alternate hourly chart updated:
The gap is closed, it’s now renamed an exhaustion gap.
I knew I might regret swapping those wave counts over. I think I have to swap them back today ?
Main hourly chart updated:
If upwards movement continues to show weakness today then this may remain the main wave count.
The invalidation / confirmation point now must be moved higher to the ATH.
The 0.618 Fibonacci Ratio is close by, minor 2 may end here or slightly higher at that ratio.
This is the count that concerns those who have long positions which includes me. I am hoping tonight’s TA data will give a strong clue or change the probabilities. For those interested, the McClellan Oscillator closed just above -10. This is a precarious position. While it can and must exceed 0.0 on this rally attempt, from -10 it can also collapse and make a new low like it did in the Oct – Dec 2018 collapse of the SPX.
We are close to a big inflection point here. Having patience and waiting for the signals will benefit all of us.
I am open to a huge rally from here simple because it doesn’t feel right to me.
As I mentioned yesterday, almost every bottom I’m left scratching my head trying to figure out an explanation and it usually comes weeks or even months later. Meaning, people (institutions) will know the reason to buy far before we do so yes, price action and the charts are the only way to go.
Yesterday, the markets were very spooked by fixed income instability. Although, we know how much the market loves rate cuts and cheap money. Once the market got comfortable with Yuan fixing, the market felt comfortable enough with fixed income/currency stability and rate cuts turned into good news again, as we have been used.
The challenge with this market is the headline risk. Any minute we might get a Twitter headline that changes the mood in the global economy.
Given that rates are so low across the board, we are effectively moving toward QE4. Any sort of positive news about Trade negotiations and I’m sure we are in for a vicious rally and we will have witnessed the lows this week. Perhaps the volatility this week scared policy makers enough to come to some sort of agreement.
I still think these negotiations will cause some more negative headlines and volatility, even if they do inevitably reach an agreement in September, but we shall see soon enough. That’s just the lens I’m viewing market through, not intending to state facts, just thoughts.
And I thank you for sharing them with us. The question is always debated/ Is it the market that makes the news or the news that makes the market? Sometimes I think the answer is ‘Yes’. It is both. But which one rules? Neither.
Nicely impulsive so far. SPX 5 minute.
Very similar to mine current 5-minute chart. Should that be scary?
But guys, here’s my hesitation… that first move off the low looks so much like a zig-zag. (As always, I defer to price action either way.)
My perception is that by definition waves 1-2-3 form a zigzag, and hence the great uncertainty of EW modeling. It may be. I’m focused on watching for a growing pile of evidence of a significant pivot high indicating a possible start to a W down. I don’t have it yet. And I’ll be quite surprised if such a top forms well below my first FF target. I’m often surprised though.
This very shallow minute iv that’s going on now is now about the right time length to match the minute ii. Might even be in the earliest stages of a minute v.
I’m talking about that first wave you have labeled as 1. That looks like a 3-wave structure to me. It’s a minor quibble that I’ve gotten wrong before.
We’ll know soon enough.
If he moves the label for 1 over to the swing high to the left, then 2 is now an expanded flat. A common structure.
That’s how I’ve labelled it.
But Kevins labelling may also be correct. Within his 1 there may be disproportionate second and fourth wave corrections; the second time consuming, the fourth brief. That’s also possible and reasonably acceptable for this market on a lower time frame. The S&P just doesn’t always produce nice looking Elliott waves.
ah, i’ve got to learn to look harder for those expanded flats!
Yes. Thank you!
I know I said I wouldn’t flood this forum with stock posts, but…just this one.
CRON is a canadian pot stock. HUUUUGE volatility, finviz gives it 7% (NFLX is 2.7% by comparison). It’s been squatting on a big 61.8% retrace level. Announced earnings premarket today. Big gap up and big sell off back into it’s recent zone. Many ways to play it, and the conservative approach is to define some buy triggers and wait for ’em. Or you can gamble off the presumption these lows will hold, and take advantage of the current price to get a low cost high payoff bet. I think this stock might be a buck or two or even three higher soon. I bought a 15/17 vertical call spread for 7 days out. $22 risk, pays $178 for a price above $17, and have a breakeven point at 15.3 (price is now 13.81). It’s an interesting bet.
$NYAD is up big today.
The upward wave structure still looks corrective to my eye. I’m not ready to take a solid long position yet, but I managed to grab a nice bite of the upswing yesterday and also today.
As Chris Ciovacco says, remaining open to all possibilities…
I think you caution is well founded. Thanks for sharing with us.
I might add that Ciovacco, this past weekend, stated it was important to remain open to worse things happening than expected. Not that better things could not happen, but rather a caution to his followers. This is the first time I recall hearing this from him in a long time. 2940 to 2950 remains very important. Will it stall out? Or will it overcome resistance? I think it is 50-50 right now. But I must see tonight’s closing data as the odds can shift one way or the other.
RUT targets based on doing some Fibonacci structure fitting to the action so far. Shock and awe…the targets line up with some obvious areas of support/resistance, too. I’m finding FF’ing to be an awesome means to identify and then enable focusing in on topping (or bottoming) action at/around the target levels. Let’s see if one of these plays out for RUT this time; I’ll be mildly surprised if one doesn’t.
And here’s the same for SPX. The highest target overlaps almost perfectly with the 1.272 extension of the swing down (the intermediate 2, if it gets up to that extension!).
The “fitting” of the targets to other structural features of the price action even after such a small amount of fresh up move data just keeps shocking the heck out of me. Powerful technology.
Just to be clear, I have not yet added to my long SPX positions. That is because we do not yet have data to suggest this move off 2822 is a resumption of the Primary trend up. We need the confirmation of the McClellan Oscillator / VIX / SPX signal. A ZBT would do it too. But until that happens and / or we surpass 2959, I remain cautious. In fact, if today’s volume and breadth at the close are weak, I will use tomorrow as an opportunity to lighten up my long positions and take some profits off the table.
I do not know if the daily wave count below is valid, but it shows my concern that we could still be in the grips of a strong Primary 2 correction. In fact, could what I’ve labeled as ‘a ??’, in fact be a ‘1’ and ‘b ??’ be a ‘2’ meaning we have several waves down to come? If that is true, we might see that 2500 SPX target.
So today is crucial to see strong volume and strong breadth.
The problem with that wave count is you’re trying to count wave C of a flat as a zigzag. It must subdivide as a five.
So it could have wave 1 complete, and this bounce could be wave 2.
I continue to learn from you. Thank you. But at least I did mention though not label the 1-2 possibility.
Lots of stocks set up and triggering to the long side. See my Alerts page at specktrading dot com if interested. I am (for better or worse!) in like Flynn…
Just to be clear, I have not yet added to my long SPX positions. That is because we do not yet have data to suggest this move off 2822 is a resumption of the Primary trend up. We need the confirmation of the McClellan Oscillator / VIX / SPX signal. A ZBT would do it too. But until that happens and / or we surpass 2959, I remain cautious. In fact, if today’s volume and breadth at the close are weak, I will use tomorrow as an opportunity to lighten up my long positions and take some profits off the table.
I do not know if the daily wave count below is valid, but it shows my concern that we could still be in the grips of a strong Primary 2 correction.In fact, could what I’ve labeled as ‘a??’, in fact be a ‘1’ and ‘b??’ be a ‘2’ meaning we have several waves down to come?
Man, did I sleep great last night. I needed that. Now on to something more important.
I awoke to discover the SPX is up 32 points and has closed the gap by going over 2914. The McClellan Oscillator is up very strong at -7.5. Note: only the close on the daily matters. It needs to clear zero and go over +20 for final confirmation of the buy signal. In addition, VIX continues to sink.
One more tidbit, The Zwieg Breadth Thrust Indicator, which triggered in early January 2019, is set up to trigger again. It would be a great signal to start a Primary 3 up. On the day of the 2822 low, the ZBTI sunk below 0.40. It has 10 days to surpass 0.615 in order to trigger. Currently it is at 0.51. The ZBTI is a measure of NYSE advances over NYSE total shares. In other words, it measures the positive breadth.
Have a great day all. Mine has started quite nicely after 10 hours of much needed sleep. Remember, my wife and I have our 4 and 7 year old granddaughters with us. It will be three weeks on Sunday. They ahve so much energy, we should call them ‘tornado and hurricane’ or perhaps Primary Wave 1 and Primary Wave 3!
My take on SPX…though I have to say, perhaps the alternate across the bottom is more likely. The upward movement is weak, more X’ish than new motive wave’ish, so far.
Some strength today! RUT up 1.5%, SPX up 1.1% and through the gap! And they keep marching…
I covered spx shorts at 2905. Preparing to enter short again at 2950.
I presume you will wait for some indication of a top and turn at 2950 first? I don’t think this market will move that quickly from “strong up” action to “back down significantly” action (though it might). I would expect some kind of slowing of momentum and some retesting of a potential top before a turn, i.e., there should be some short set up indications first. But I recognize there are many paths to the mountaintop of profits…trade your plan.
I usually buy cheap put spreads if I’m punting at calling a top like 2950. I’ll wait for triggers and a turn to start selling upside calls or invest real premium in puts.
RUT is well set up for a long and giving triggers on open.
#1 tonight. What an honor.
Excellent analysis and commentary, Lara. Thank you. I appreciate the bullet list of support for each of the two accounts.
I agree that the rally since the 2822 low has not had much power and looks corrective. However, the we are getting buy signals from the McClellan Oscillator that moved up today after closing back inside it’s BB. VIX has closed below it’s previous close which was above the lower BB. And SPX has now closed back above it’s lower BB. If the McClellan Oscillator continues moving up and goes above +20 we will have confirmation of the buy signal.
TYPO – It should read “VIX has closed below it’s previous close which was below or inside the upper BB.”
I have kept thinking these last two days, I bet I’m going to regret swapping those wave counts over.
But I have to go with the data in hand. And it’s not been a very strong bounce up off the low… yet. Of course, that could change.
No and never. Better to be cautious and forewarned. When facing diametrically opposed alternates, it is most often best to expect corrections to the Primary trend (in this case up) to be longer in time and deeper in price. It is so very often true that when we consider corrections to be over, they lengthen in time and depth. At least that is my humble opinion. So, I think you did the correct swap especially considering the lack of strength to the upward move off of 2822.
Yeah. Looking back at it today with the benefit of some hindsight, I don’t see how I could have made a different decision with that lack of strength off the low.