
A new low at the open of the session invalidated the main Elliott wave count and gave confidence to the alternate. At that stage, the target for downwards movement was 2,842.28. The low for the session was at 2,822.
Summary: Two wave counts today may have about even probability.
The main Elliott wave count requires a new high above 2,958.08 or a 90% upwards day for confidence. It looks at the possibility a low may be in place, a target is at 3,336.
Alternatively, the pullback may continue lower to 2,663 or 2,579. A new low tomorrow would increase the probability of this alternative scenario.
The biggest picture, Grand Super Cycle analysis, is here.
Monthly charts were last published here, with video here. There are two further alternate monthly charts here, with video here.
ELLIOTT WAVE COUNTS
The two weekly Elliott wave counts below will be labelled First and Second. They may be about of even probability. When the fifth wave currently unfolding on weekly charts may be complete, then these two wave counts will diverge on the severity of the expected following bear market. To see an illustration of this future divergence monthly charts should be viewed.
FIRST WAVE COUNT
WEEKLY CHART
Click chart to enlarge.
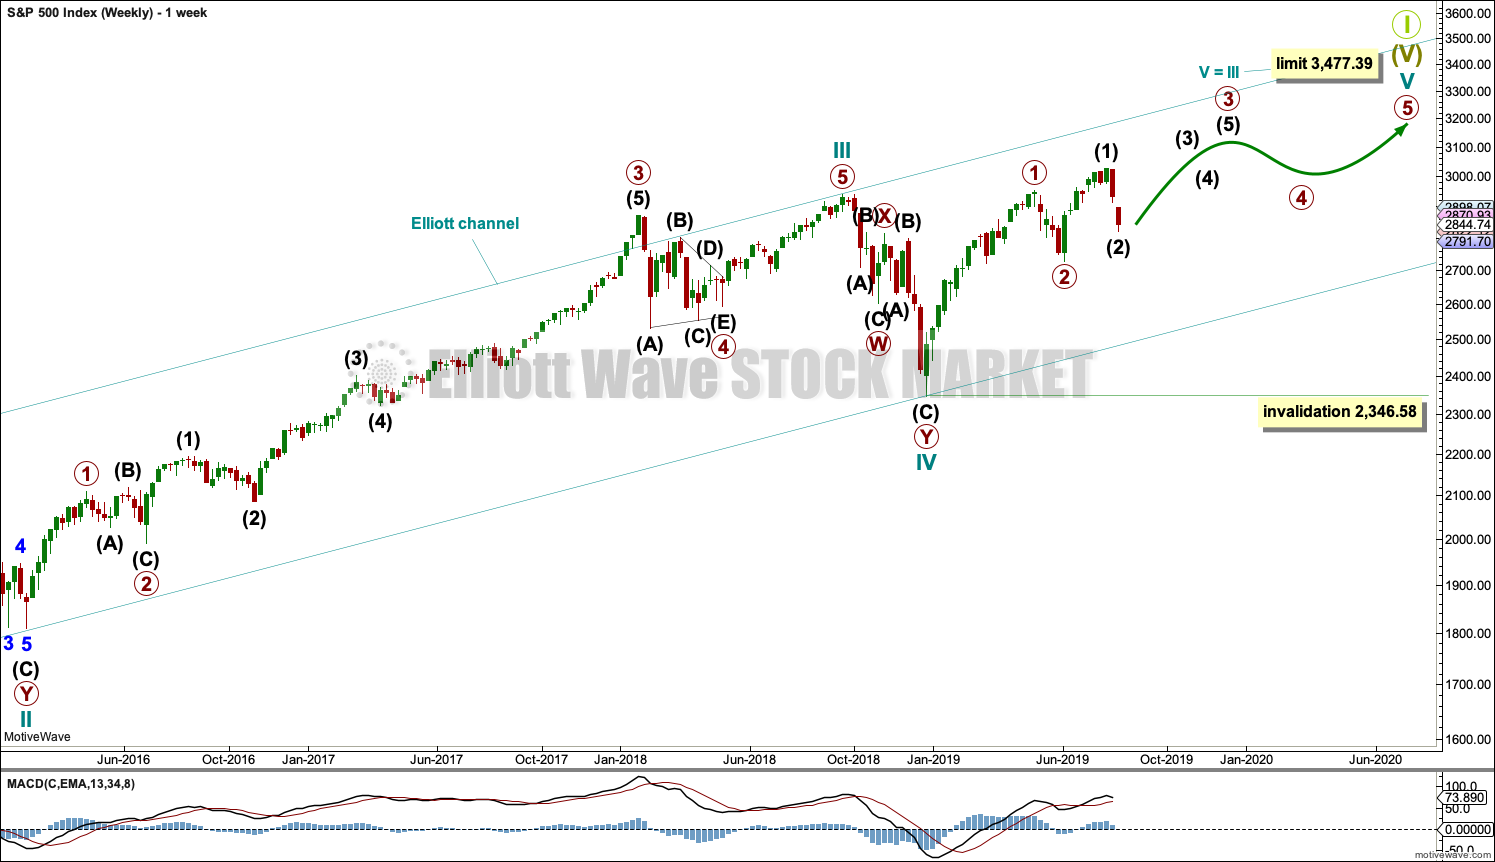
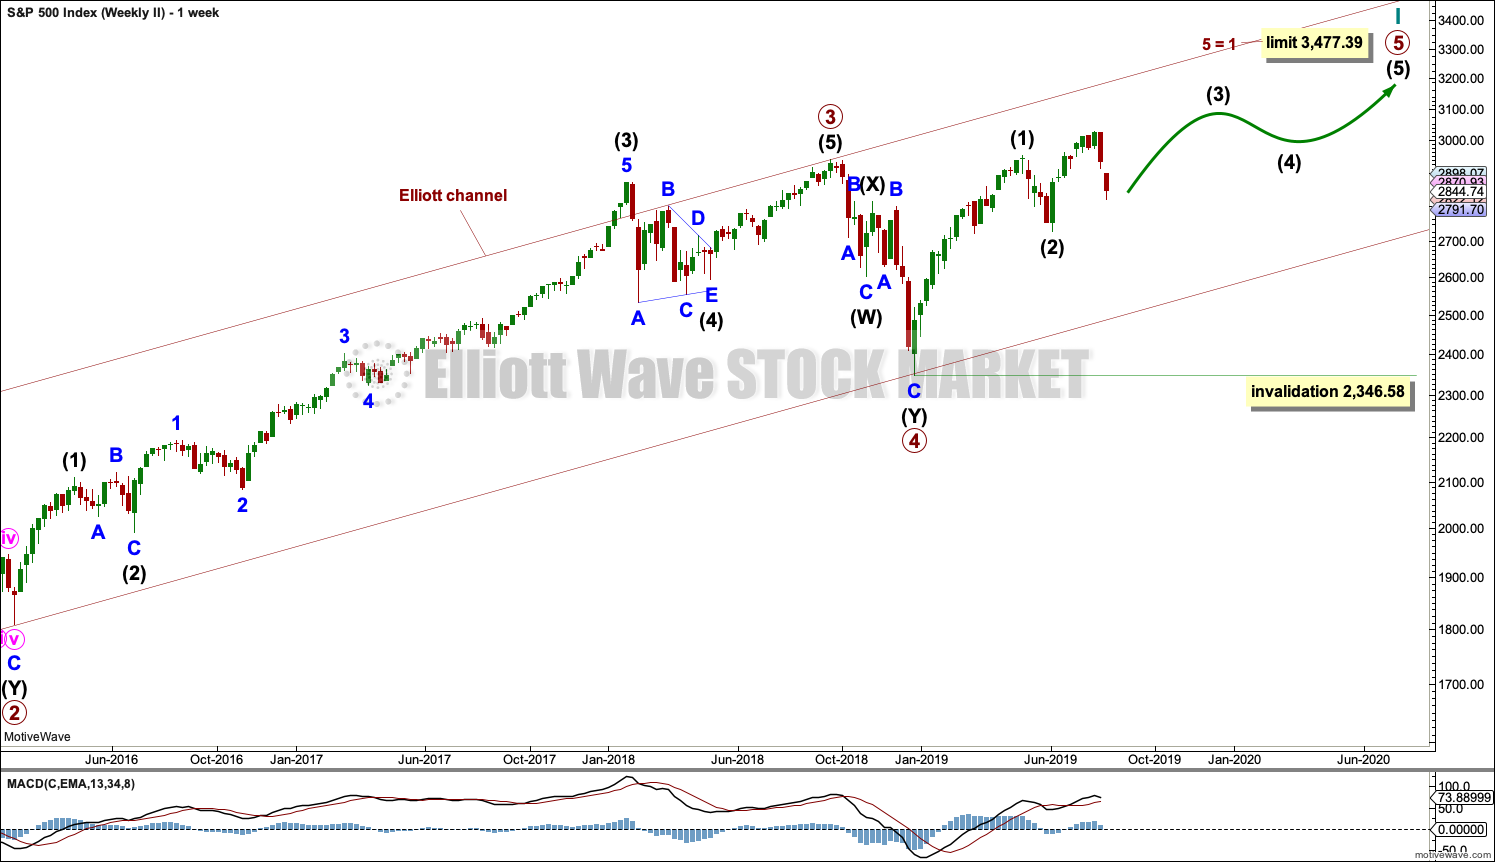
The basic Elliott wave structure consists of a five wave structure up followed by a three wave structure down (for a bull market). This wave count sees the bull market beginning in March 2009 as an incomplete five wave impulse and now within the last fifth wave, which is labelled cycle wave V. This impulse is best viewed on monthly charts. The weekly chart focusses on the end of it.
Elliott wave is fractal. This fifth wave labelled cycle wave V may end a larger fifth wave labelled Super Cycle wave (V), which may end a larger first wave labelled Grand Super Cycle wave I.
The teal Elliott channel is drawn using Elliott’s first technique about the impulse of Super Cycle wave (V). Draw the first trend line from the end of cycle wave I (off to the left of the chart, the weekly candlestick beginning 30th November 2014) to the end of cycle wave III, then place a parallel copy on the end of cycle wave II. This channel perfectly shows where cycle wave IV ended at support. The strongest portion of cycle wave III, the end of primary wave 3, overshoots the upper edge of the channel. This is a typical look for a third wave and suggests the channel is drawn correctly and the way the impulse is counted is correct.
Within Super Cycle wave (V), cycle wave III is shorter than cycle wave I. A core Elliott wave rule states that a third wave may never be the shortest. For this rule to be met in this instance, cycle wave V may not be longer in length than cycle wave III. This limit is at 3,477.39.
Cycle wave V may subdivide either as an impulse or an ending diagonal. Impulses are much more common. I have charted the possibility of an ending diagonal and will keep it updated, but the probability at this stage is too low for daily publication. It too needs new all time highs and so with no divergence at this stage it shall not be published.
The daily charts below will now focus on all of cycle wave V. A new alternate wave count today considers the possibility that primary wave 2 may be continuing lower. Within cycle wave V, primary wave 2 may not move beyond the start of primary wave 1 at 2,346.58.
In historic analysis, two further monthly charts have been published that do not have a limit to upwards movement and are more bullish than this wave count. Members are encouraged to consider those possibilities (links below summary) alongside the wave counts presented on a daily and weekly basis.
MAIN DAILY CHART
Click chart to enlarge.
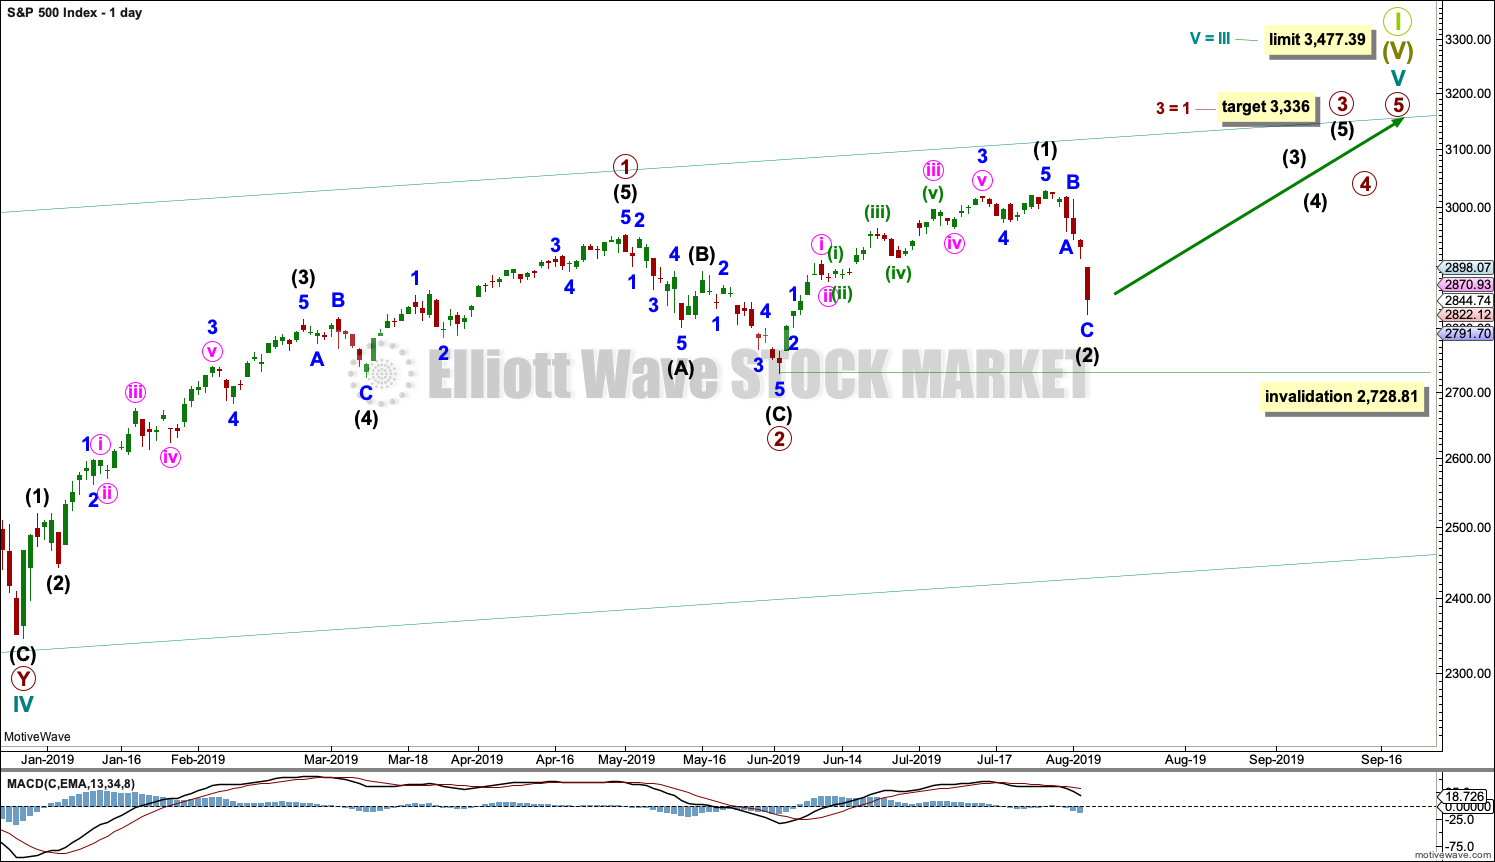
Cycle wave V must subdivide as a five wave motive structure. Within that five wave structure, only primary wave 1 may be complete.
Primary wave 3 may only subdivide as an impulse. Within primary wave 3, intermediate waves (1) and (2) may now be complete. Intermediate wave (2) may have ended close to the 0.618 Fibonacci ratio of intermediate wave (1).
A target is calculated for primary wave 3 that fits with the higher limit for cycle wave V.
If intermediate wave (2) continues lower, then it may not move beyond the start of intermediate wave (1) below 2,728.81.
MAIN HOURLY CHART
Click chart to enlarge.
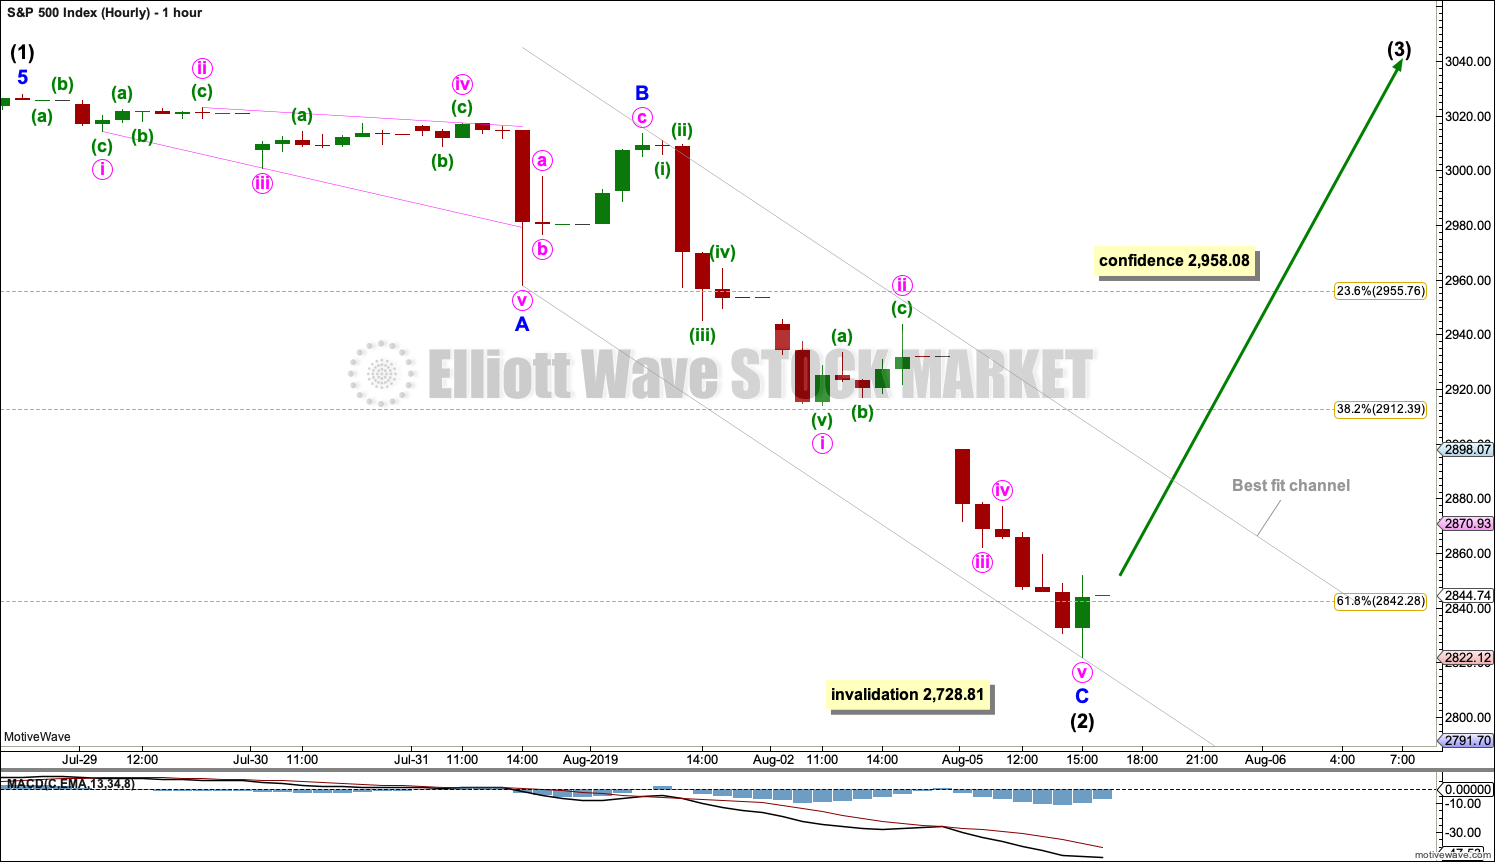
It is possible that intermediate wave (2) may today be a complete zigzag, ending close to the 0.618 Fibonacci Ratio of intermediate wave (1). There is no Fibonacci Ratio between minor waves A and C.
A best fit channel is drawn about intermediate wave (2). Allow for the possibility that price may fall lower while it remains within the channel. Earliest confidence that a low may be in place would be had with a breach of the upper edge of the channel by upwards movement.
ALTERNATE DAILY CHART
Click chart to enlarge.
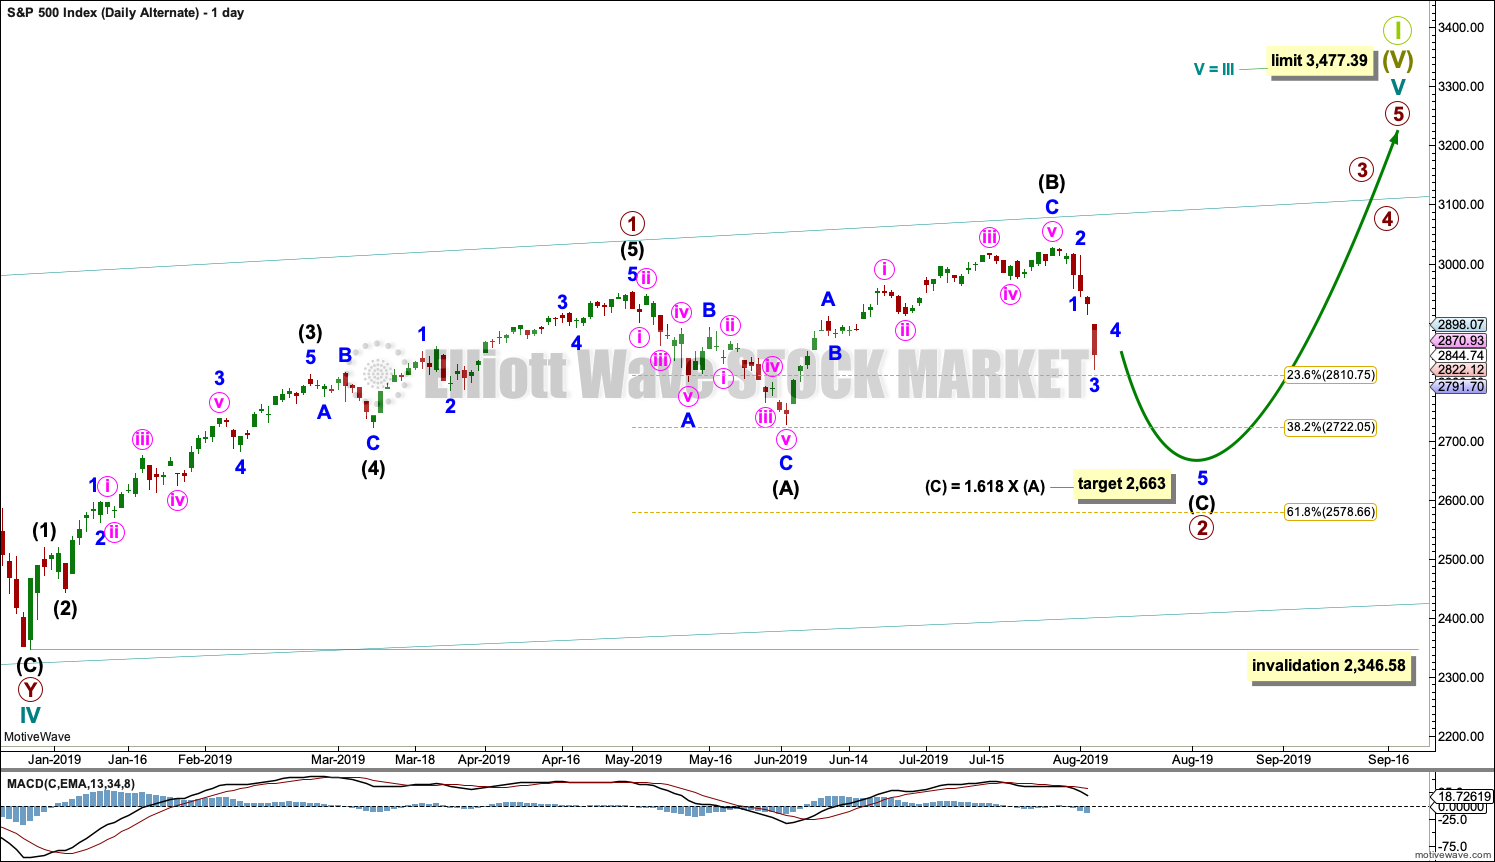
It is possible that primary wave 2 may not be over and continue further as an expanded flat correction. Within the expanded flat, intermediate wave (B) is a 1.33 length of intermediate wave (A), within the most common range of up to 1.38.
Intermediate wave (C) for this wave count should now move below the end of intermediate wave (A) to avoid a truncation. The target calculated would expect this.
If price falls through the first target, then the next target may be the 0.618 Fibonacci Ratio about 2,579.
Strong and final support may be expected at the lower edge of the teal Elliott channel.
ALTERNATE HOURLY CHART
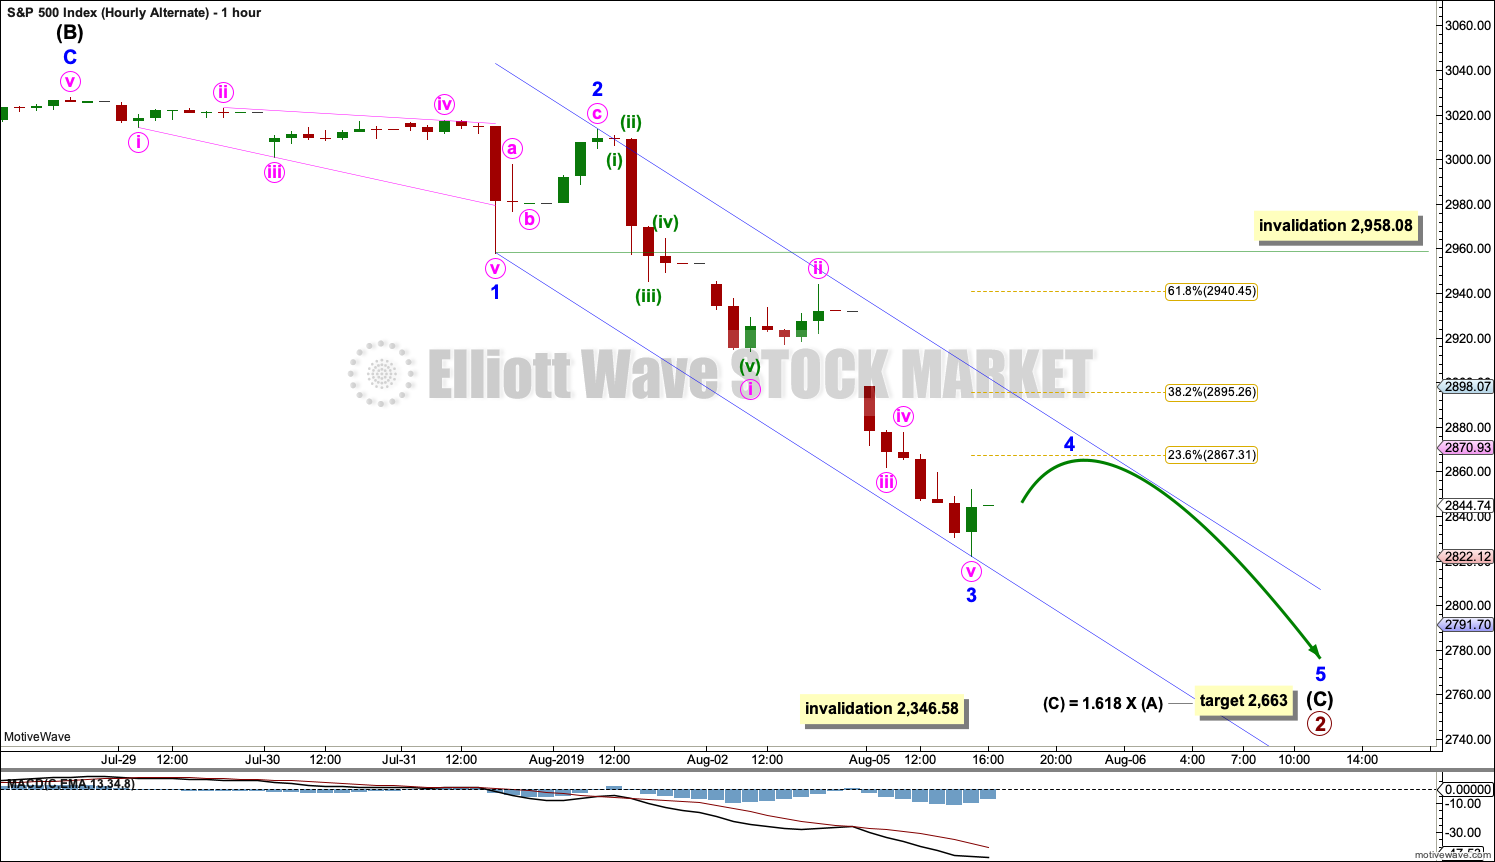
Click chart to enlarge.
Intermediate wave (C) must subdivide as a five wave structure. Minor waves 1 through to 3 within intermediate wave (C) may be complete.
Minor wave 4 may not move into minor wave 1 price territory above 2,958.08.
A channel is drawn about intermediate wave (C) using Elliott’s technique. Minor wave 4 may find resistance about the upper edge.
SECOND WAVE COUNT
WEEKLY CHART
Click chart to enlarge.
This weekly chart is almost identical to the first weekly chart, with the sole exception being the degree of labelling.
This weekly chart moves the degree of labelling for the impulse beginning in March 2009 all down one degree. This difference is best viewed on monthly charts.
The impulse is still viewed as nearing an end; a fifth wave is still seen as needing to complete higher. This wave count labels it primary wave 5.
TECHNICAL ANALYSIS
WEEKLY CHART
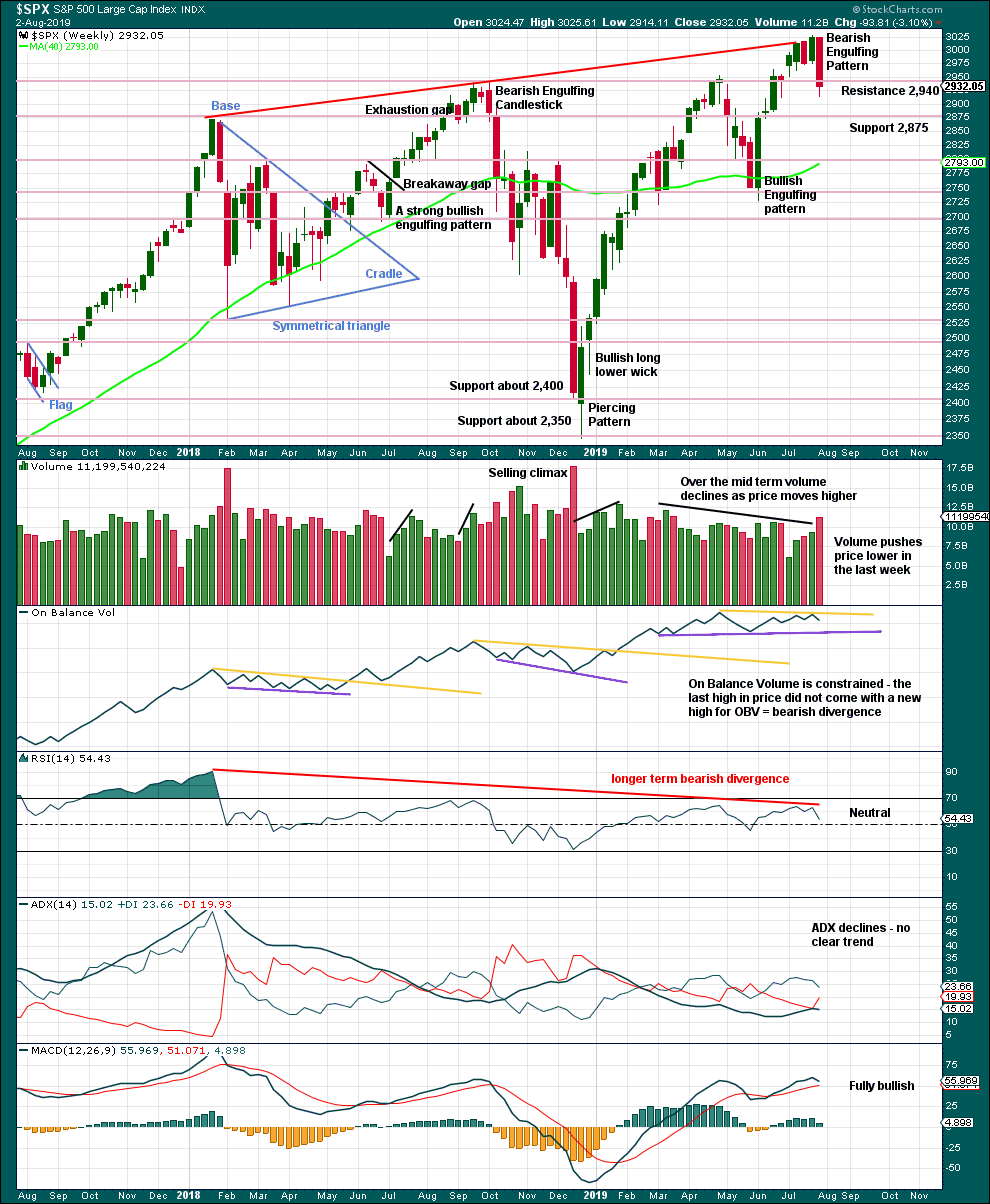
Click chart to enlarge. Chart courtesy of StockCharts.com.
Last week a very strong Bearish Engulfing candlestick pattern supports the alternate Elliott wave count. It has good support from volume.
DAILY CHART
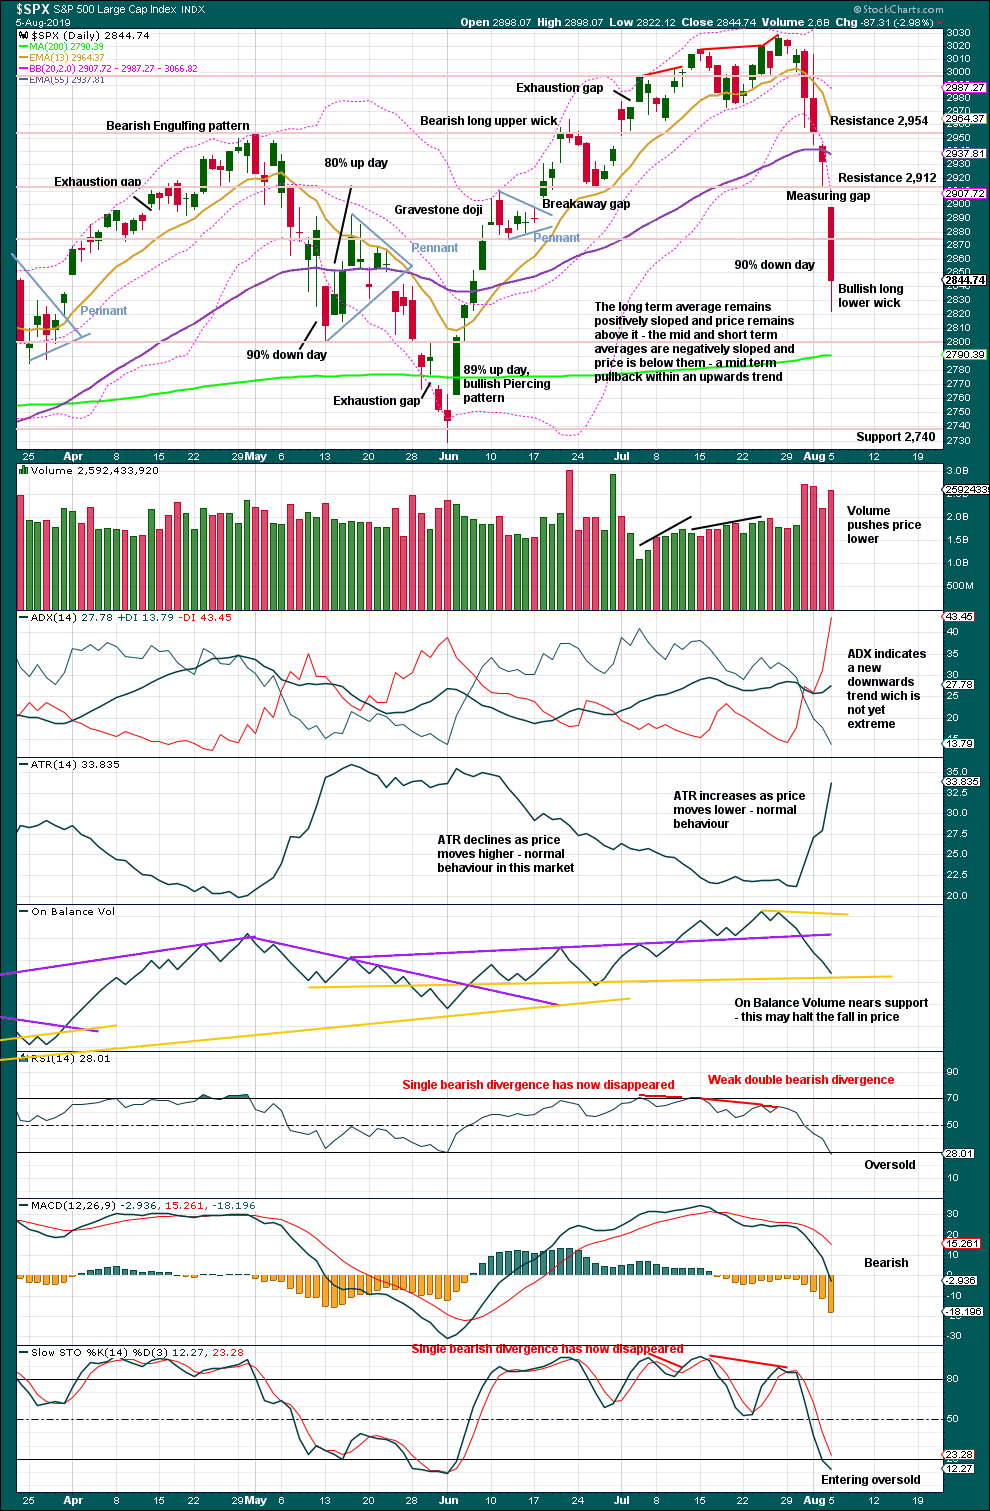
Click chart to enlarge. Chart courtesy of StockCharts.com.
A strong downwards day is bearish. Next support is identified on the chart.
Conditions are now just oversold, but this may reach more extreme before a low is found.
Lows for this market are often V shaped: a 90% downwards day at or near the low followed by a 90% upwards day. If a strong upwards day follows tomorrow, then a low may be in place. However, with the data in hand at the end of this session, there is room for price to fall further.
Unfortunately, there is some leeway in exactly how the support line for On Balance Volume may be drawn. There may be still a little room for price to fall before it offers enough support to halt the fall.
BREADTH – AD LINE
WEEKLY CHART
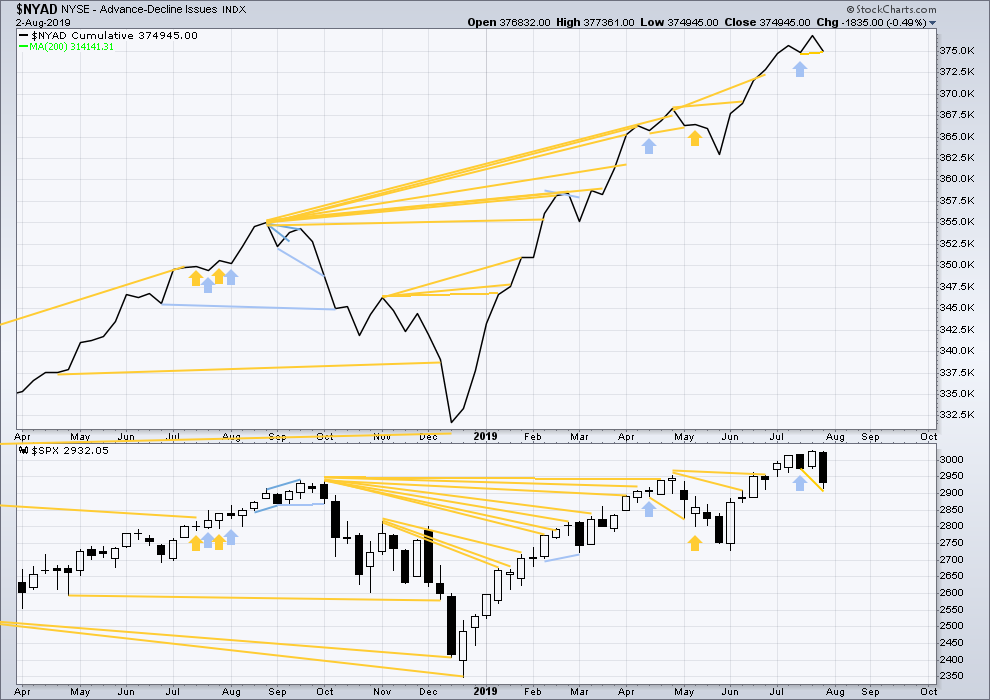
Click chart to enlarge. Chart courtesy of StockCharts.com. So that colour blind members are included, bearish signals
will be noted with blue and bullish signals with yellow.
Bear markets from the Great Depression and onwards have been preceded by an average minimum of 4 months divergence between price and the AD line with only two exceptions in 1946 and 1976. With the AD line making new all time highs again this week, the end of this bull market and the start of a new bear market is very likely a minimum of 4 months away, which is mid November 2019.
In all bear markets in the last 90 years there is some positive correlation (0.6022) between the length of bearish divergence and the depth of the following bear market. No to little divergence is correlated with more shallow bear markets. Longer divergence is correlated with deeper bear markets.
If a bear market does develop here, it comes after no bearish divergence. It would therefore more likely be shallow.
Last week price has made a new low below the short term low two weeks prior, but the AD line has failed to make a corresponding new low by a small margin. This divergence is bullish for the short term.
DAILY CHART
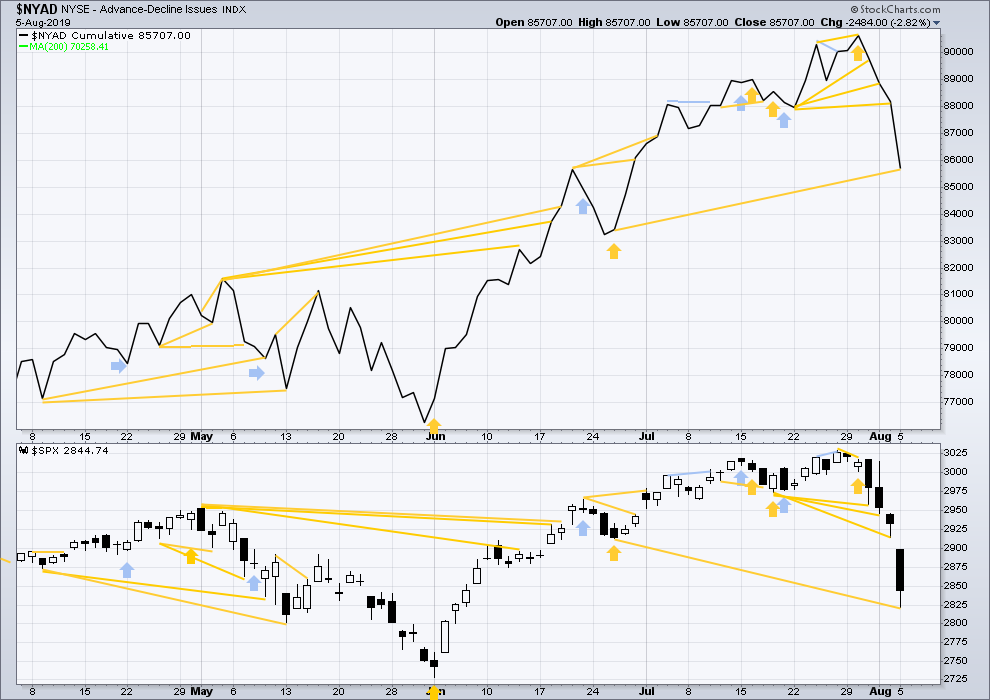
Click chart to enlarge. Chart courtesy of StockCharts.com. So that colour blind members are included, bearish signals
will be noted with blue and bullish signals with yellow.
Breadth should be read as a leading indicator.
Today price has made a new low below the prior swing low of the 26th of June, but the AD line has not. Breadth is not falling as fast as price. This pullback still has bullish divergence.
VOLATILITY – INVERTED VIX CHART
WEEKLY CHART
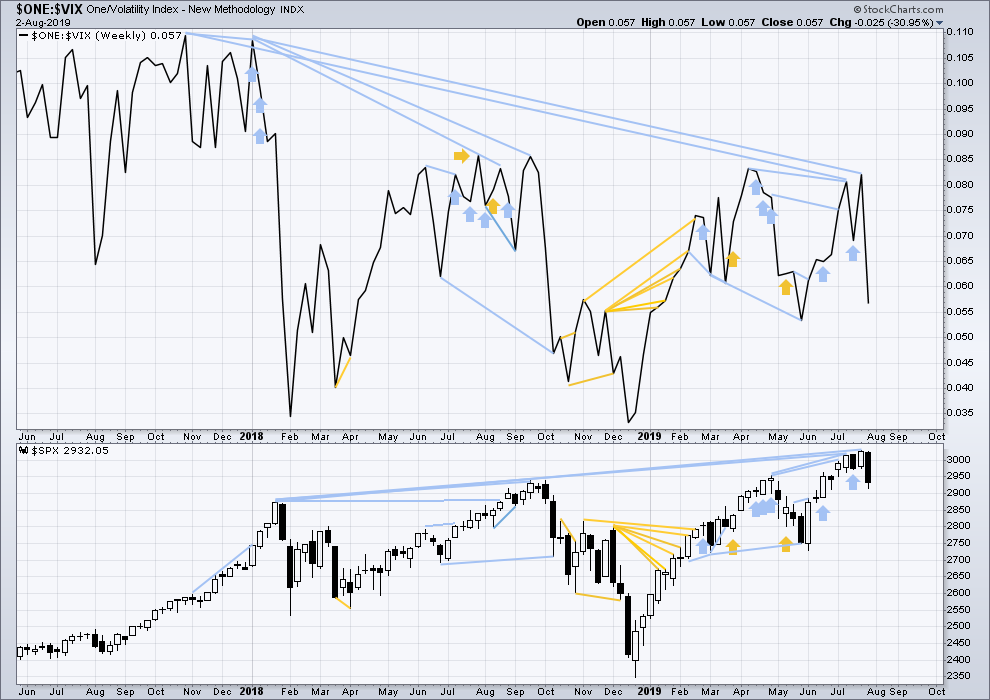
Click chart to enlarge. Chart courtesy of StockCharts.com. So that colour blind members are included, bearish signals
will be noted with blue and bullish signals with yellow.
The all time high for inverted VIX (which is the same as the low for VIX) was on 30th October 2017. There is now nearly one year and nine months of bearish divergence between price and inverted VIX.
The rise in price is not coming with a normal corresponding decline in VIX; VIX remains elevated. This long-term divergence is bearish and may yet develop further as the bull market matures.
This divergence may be an early warning, a part of the process of a top developing that may take years. It may not be useful in timing a trend change.
Last week price and inverted VIX have both moved lower. Neither have made a new swing low below the prior swing low of the weeks beginning 28th May / 3rd June.
DAILY CHART
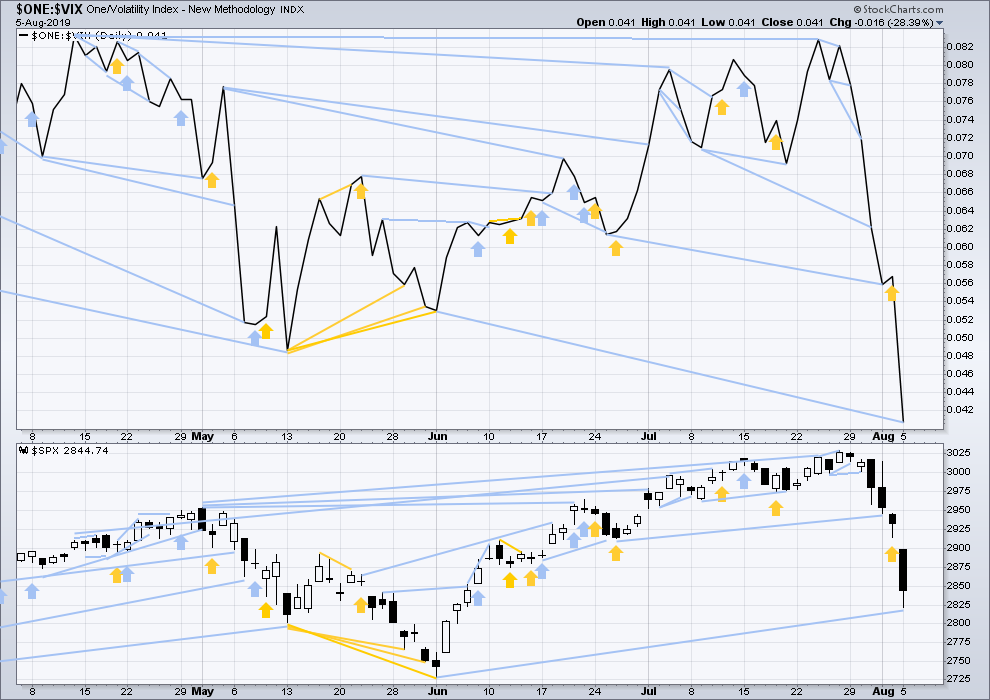
Click chart to enlarge. Chart courtesy of StockCharts.com. So that colour blind members are included, bearish signals
will be noted with blue and bullish signals with yellow.
Today inverted VIX has made a new low below the last major low of the 3rd of June, but price has not. This divergence is bearish, but it is not confirmed by the AD line.
DOW THEORY
Dow Theory confirmed a bear market in December 2018. This does not necessarily mean a bear market at Grand Super Cycle degree though; Dow Theory makes no comment on Elliott wave counts. On the 25th of August 2015 Dow Theory also confirmed a bear market. The Elliott wave count sees that as part of cycle wave II. After Dow Theory confirmation of a bear market in August 2015, price went on to make new all time highs and the bull market continued.
DJIA: 23,344.52 – a close on the 19th of December at 23,284.97 confirms a bear market.
DJT: 9,806.79 – price has closed below this point on the 13th of December.
S&P500: 2,532.69 – a close on the 19th of December at 2,506.96 provides support to a bear market conclusion.
Nasdaq: 6,630.67 – a close on the 19th of December at 6,618.86 provides support to a bear market conclusion.
With all the indices having moved higher following a Dow Theory bear market confirmation, Dow Theory would confirm a bull market if the following highs are made:
DJIA: 26,951.81 – a close above this point has been made on the 3rd of July 2019.
DJT: 11,623.58 – to date DJT has failed to confirm an ongoing bull market.
S&P500: 2,940.91 – a close above this point was made on the 29th of April 2019.
Nasdaq: 8,133.30 – a close above this point was made on the 26th of April 2019.
Published @ 07:48 p.m. EST.
—
Careful risk management protects your trading account(s).
Follow my two Golden Rules:
1. Always trade with stops.
2. Risk only 1-5% of equity on any one trade.
—
New updates to this analysis are in bold.
Considering my comment to start the day, Kevin’s polite disagreement with me is right on. We did have warning that a sharp correction may be forthcoming. We had 1) Lara’s EW alternate count, 2) Lara’s TA showing several bearish divergences or indicators which perhaps might have been given more weight, and 3) rationally thinking, I should have given more weight to the stall at SPX 3000 while expecting we were developing a 3rd of a 3rd for many degrees which showed no increase in momentum. It just took too long to develop. Furthermore, every day since the turn down began, we have been given significant information and analysis from Lara indicating the current correction could go father than expected.
My statement at the beginning of the day that this correction seemed to ‘come out of nowhere’ was really picking up on ari’s post in 1st place. But the fact remains, whenever we enter a period of uncertainty like now, it so often ‘seems’ to come out of nowhere.
I will post this on tonight’s forum after Lara’s daily update so it will be printed in a more current time. At that time I will post regarding the McClellan Oscillator and a potential buy SPX signal. Lara’s TA information will be crucial.
Hi Rod.
Two confirmed Hindenburg Omens on the clock, multiple bearish divergences at recent highs, a clear break and back-test of the bearish rising wedge were imho strong hints of what was coming. Take a look at the trend-line from 2009. A VIX visit below 13 also tends to whisper bearish tidings…
Good to “see you” again Verne 🙂
This might sound a bit iffy considering how strong bonds have been, but anyone considering shorting TLT for a scalp? its way overstretched with RSI above 78 and 4th day closing above its BB today…
its also 7.5 points above its 20 day MA which is pretty stretched to the upside IMHO
Oh well :-/
I have a short in that I have a butterfly now well under the market that expires Friday. Probably dead.
It does appears that there is a 5 wave “wave 3” that should be completing…sometime. But it’s still in the 3 of that 3 I believe. It’s just past my second fibonacci fitted target; I wouldn’t be surprised to see a little iv here, then a final v to complete the 3 that gets price up to about 151, my third (“#2”, I started with label of “#0”) target.
I won’t be shorting (more). At least yet.
Here’s the same chart with my attempt at an EW count.
If I was to put on a position right now…I’d put on a ‘fly centered at 150 for mid/late August, for the reasons shown.
the minor 3 could be over also where the minute iii is, and everything after is a minor 5. but it’s ends up “the same” relative to this chart.
Thank you very much Kevin.
That’s quite a nice roadmap for long term trading…
I added to my shorts around 142.75 today. Just a scalp trade. 1st attempt to go under the upper BB and I’m out of this trade. So far so good…
My logic is simple: just don’t see 4 full candlesticks above a BB, but TLT has a history of 6 full candlesticks below its BB. But very rare nevertheless…
Seems like we might be having a short term reversal day on our hands today 🙂
yea, iv wave is due and in progress for sure…best of luck there! I succumbed to the temptation and put on a ‘fly up there at 150 (147-150-153) for mid Sept. Cheap and high leverage…we’ll see!
I just sourced a new watchlist, and what I’m seeing is mildly concerning. Stock after stock that last week got large earnings pops, and of course every one has since sold off, most to just above the price when the earning popped (i.e., gap fill). Every one of these has a weekly candle for last week that shows a giant upward tail (shoot star candle I guess). When I look at what happens on these stocks after that kind of a pattern, almost every single time it is followed by MANY WEEKS of selling. Here’s just one example, FSS, to demonstrate what I mean.
Careful out there.
Thanks for sharing!
Hourly charts updated: (comment below both charts today)
Main count
Alternate hourly updated:
channel is redrawn using Elliott’s second technique: from 2 to 4, a copy on 3
In trying to decide which one of these is more likely after the session has closed I’ll be relying heavily upon Lowry’s data.
It’s normal for the S&P’s lows to be an event (where highs are a process). They often form V bottoms which have a 180 degree shift of sentiment quickly about the low.
They are often begun by a 90% down day, a low, then a 90% up day. So the internal strength or weakness of today’s upwards day will be important.
So far it looks like an inside day, which does not bode well for the main count. It would not complete a bullish candlestick reversal pattern.
A bullish Harami??
No, the candlestick real body is too large. A Harami should have a small real body.
Ok, will remember, thanks Lara.
Yea, I don’t see a V bottom here at all. I see corrective “up” action…so far.
Seems like the gap is probably key. Breaking up and through it would be big for the bullish case, and v.v.
Channel break, prior swing high break, at the very least it’s nice B or X wave action. I added to my long (UPRO) from yesterday and am finally in the black.
Meanwhile, my SPY “bearish” butterfly is centered exactly in the middle of the gap, expiring Friday. So that’d be a fine and wonderful place for price to be then…lol! GLD is exactly where I need it to be…but on Friday!!! And TLT has shot right past my bullish butterfly and I need that to correct by Friday. I love/hate butterflies….the allure and challenge of the pin right through the thorax.
While it may not go far, I like the long set up in RUT right now.
The McClellan Oscillator closed at -78.92 yesterday. This has been exceeded to the downside only twice in the last five years, the end of Dec. 2018 and February 2018. It was essentially matched in November 2015, January 2016 and very early October 2018. The point it this, each time it was followed by a large rally. Two of those times, Nov. 2015 and Oct 2018, it was later followed by a lower low.
As of this time today, the McClellan Oscillator is at -60 and near its lower BB. If it closes above it’s lower BB, it will trigger a buy (go long) signal. If VIX will also close below it’s upper BB and then tomorrow lower than today’s close, the buy signal will be confirmed. In addition, since 2008, 90% of the time the SPX has been down six days in a row (like yesterday) at least a short term low is in place. Half of those times, THE low is in place and a large sustained rally followed.
The bottom line in my mind is that the main count Lara has presented has very high probability of being the correct count. However, very high probability still leaves open the chance of the alternate. So be forewarned. I am looking for an entry for a short term long trade on SPX. But I will most likely wait for the signals I have mentioned above.
Have a great day everyone. I will be online all this week. Next Monday I have shoulder replacement surgery #2 on my right shoulder. Since I am right handed, my ability to post on this forum will be significantly reduced if not eliminated for at least six weeks. But I will still be reading and trying to type something one handed with my left index finger! So you could say that I will at least try to give you all the finger.
Rodney good luck with the shoulder. Hope all goes well and you are back keeping the bears away for us soon! And thanks much for your analysis.
Price action today is very strong. How do you all take into account the overnight move. Do you consider the bottom around 2790 now?
What happened over the past week is heavy and I still believe will take some time to play out. Both sides are not scheduled to talk again until September. I don’t think a low will be in place until there is some trade compromise reached. In the short term, I wouldn’t be surprised to see a test of 2900, but I’m very cautious still and favoring the alternate at this time.
One note: it is strong on an absolute basis. But on a relative basis, we are just getting a “small inside up day” after a massive down day. I.e., so far, looks like it very much could indeed just be a minor 4 up…even though it is a +1.5% day!!
Thanks Rodney, that’s interesting info re the McClellan oscillator.
And this really made me laugh: “trying to type something one handed with my left index finger! So you could say that I will at least try to give you all the finger” ??
Thanks Rodney, that’s interesting info re the McClellan oscillator.
And this really made me laugh: “trying to type something one handed with my left index finger! So you could say that I will at least try to give you all the finger” ?
Thanks Rodney, that’s interesting info re the McClellan oscillator.
And this really made me laugh: “trying to type something one handed with my left index finger! So you could say that I will at least try to give you all the finger”
Lara, with es futures down 500 pts after close, I was surprised to see both counts pointing to up moves today. It would have been very easy to force a count that reflected that big move. Thanks for staying true to your system and what you do!
That’s good. TBH, I don’t even look at futures after hours data. I’m focused on cash data only. I don’t want to get spooked and emotional about what a more extreme market is doing.
Talk about coming out of nowhere!
This market plunge… and me being first…
Nice job ari. It seems to me the last several major / intermediate term swing highs have ‘come out of nowhere’. This demonstrates one of the major weaknesses of using EW alone, one can be caught totally off guard with regards to a powerful move in the opposite direction of expectations. Using TA can assist to avoid such surprises. But as we can see, it does not eliminate surprises. To be fair, however, there is no system or analysis of financial markets that is without its own weaknesses. Chris Ciovacco has developed what he calls his ‘Bird Strike’ warning. Last Friday’s YouTube video is an example and quite interesting.
I’m actually berating myself a bit, because I politely disagree and while to some degree I “saw it coming” and got a nice bearish butterfly it, I could and should have committed more to the increasingly likely sharp sell off. I put up a chart called “Anatomy of a Market Top” under the Markets->SP500 tab on my web site; I’ll put it up here too. There were a lot of signals! Including (but not on the chart) Lara’s clear call for more down after the minor B wave executed. I will admit that at that time I discounted her call a bit. It is SO VERY HARD to be total clear eyed and objective about market structure and probabilities. For me, anyway.
The exact nature of probabilties will produce difficulties.
Thanks Rodney and Kevin as always for your thought provoking posts. This forum wouldn’t be the same with yall’s input…
🙂