
At the end of this week, the AD line and VIX indicate the most likely Elliott wave count.
Summary: The main wave count will expect intermediate wave (2) may now be over and a third wave up at two degrees may begin on Monday. The target is at 3,213. Confidence in this view may be had if any one or more of the following occurs next week:
– a new all time high in price with support from volume
– a new all time high in the AD line
– a 90% up day (or close to it)
– a strong bullish candlestick reversal pattern on the daily chart with support from volume
Alternatively, intermediate wave (2) may continue lower for another week or two as a double zigzag towards the 0.618 Fibonacci ratio at 2,842.28. Confidence in this view may be had if price makes a new low below 2,914.11 by any amount at any time frame.
The biggest picture, Grand Super Cycle analysis, is here.
Monthly charts were last published here, with video here. There are two further alternate monthly charts here, with video here.
ELLIOTT WAVE COUNTS
The two weekly Elliott wave counts below will be labelled First and Second. They may be about of even probability. When the fifth wave currently unfolding on weekly charts may be complete, then these two wave counts will diverge on the severity of the expected following bear market. To see an illustration of this future divergence monthly charts should be viewed.
FIRST WAVE COUNT
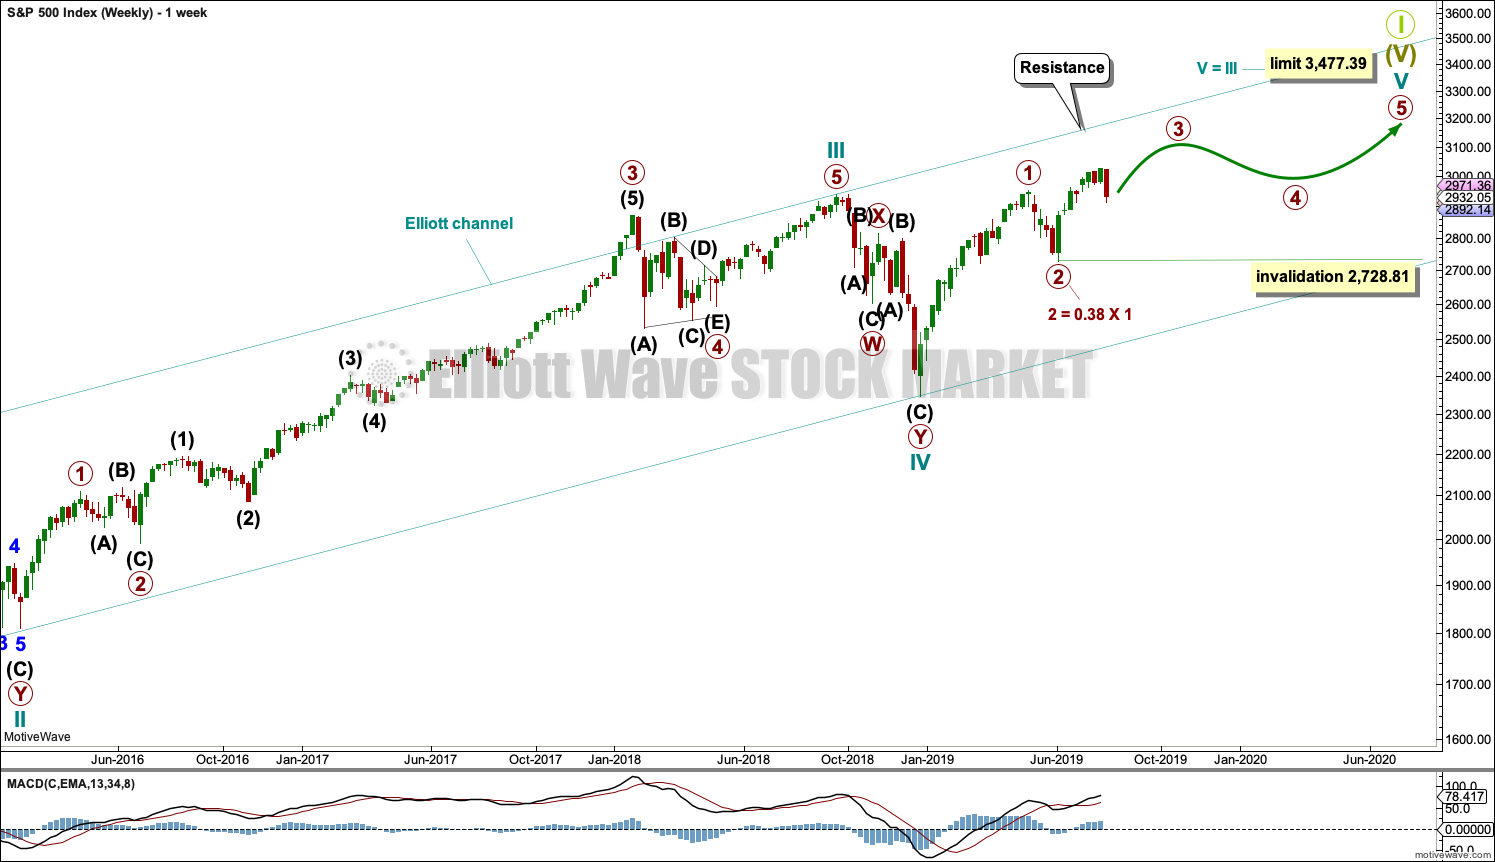
WEEKLY CHART
Click chart to enlarge.
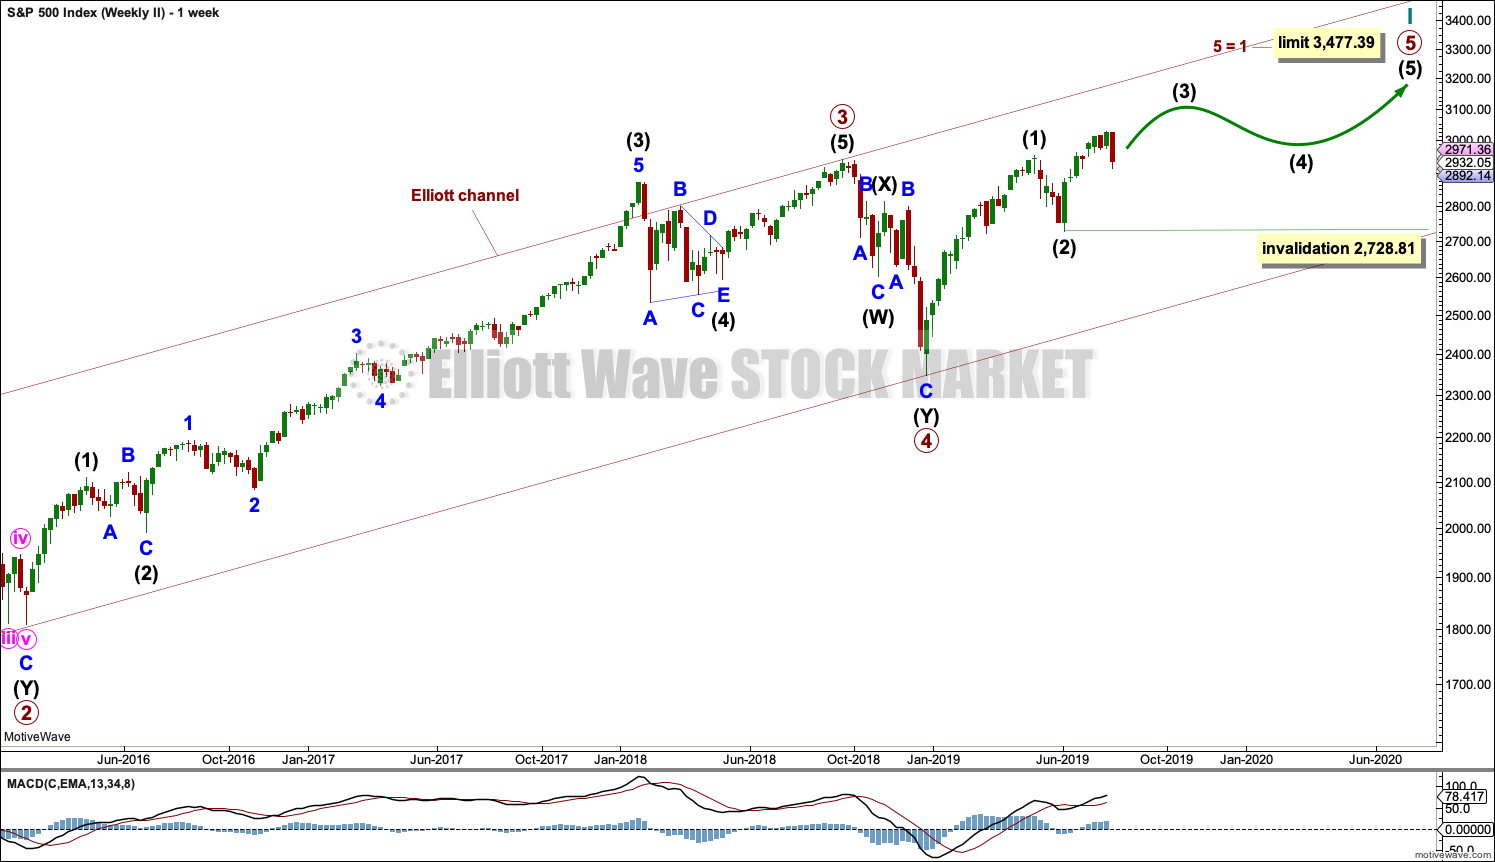
The basic Elliott wave structure consists of a five wave structure up followed by a three wave structure down (for a bull market). This wave count sees the bull market beginning in March 2009 as an incomplete five wave impulse and now within the last fifth wave, which is labelled cycle wave V. This impulse is best viewed on monthly charts. The weekly chart focusses on the end of it.
Elliott wave is fractal. This fifth wave labelled cycle wave V may end a larger fifth wave labelled Super Cycle wave (V), which may end a larger first wave labelled Grand Super Cycle wave I.
The teal Elliott channel is drawn using Elliott’s first technique about the impulse of Super Cycle wave (V). Draw the first trend line from the end of cycle wave I (off to the left of the chart, the weekly candlestick beginning 30th November 2014) to the end of cycle wave III, then place a parallel copy on the end of cycle wave II. This channel perfectly shows where cycle wave IV ended at support. The strongest portion of cycle wave III, the end of primary wave 3, overshoots the upper edge of the channel. This is a typical look for a third wave and suggests the channel is drawn correctly and the way the impulse is counted is correct.
Within Super Cycle wave (V), cycle wave III is shorter than cycle wave I. A core Elliott wave rule states that a third wave may never be the shortest. For this rule to be met in this instance, cycle wave V may not be longer in length than cycle wave III. This limit is at 3,477.39.
Within cycle wave V, primary waves 1 and 2 may now be complete. Within primary wave 3, no second wave correction may move beyond its start below 2,728.81.
Cycle wave V may subdivide either as an impulse or an ending diagonal. Impulses are much more common. Ending diagonals normally have second and fourth waves that are deep; the common depth is from 0.66 to 0.81 the prior wave. So far a correction within cycle wave V has not been deeper than 0.5, so a diagonal at this stage looks very unlikely (but remains possible).
In historic analysis, two further monthly charts have been published that do not have a limit to upwards movement and are more bullish than this wave count. Members are encouraged to consider those possibilities (links below summary) alongside the wave counts presented on a daily and weekly basis.
The daily chart below will now focus on price movement from the low of primary wave 2.
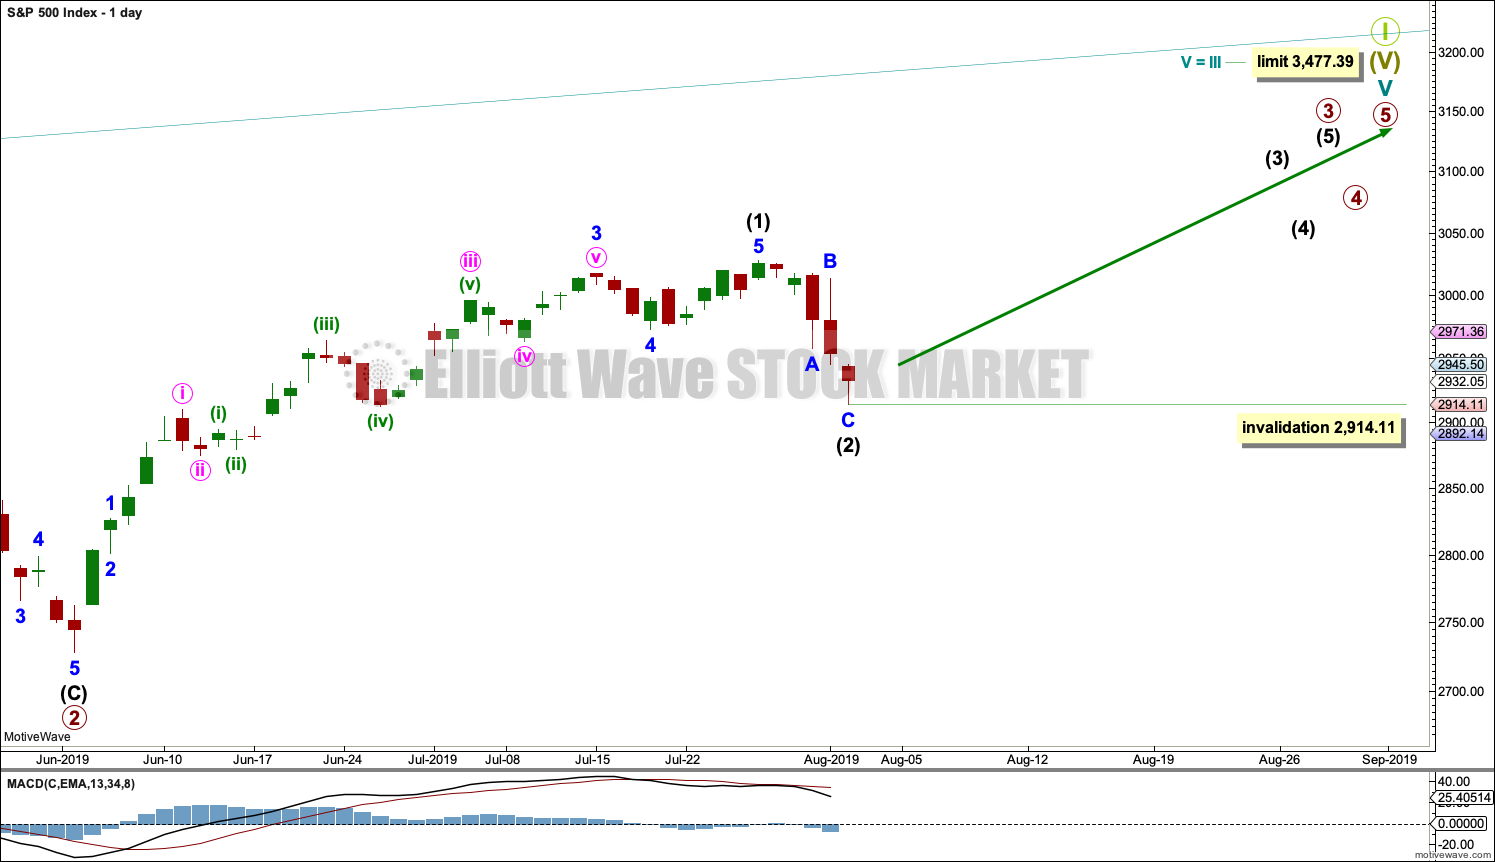
MAIN DAILY CHART
Click chart to enlarge.
Cycle wave V must subdivide as a five wave motive structure. Within that five wave structure, only primary wave 1 may be complete.
Primary wave 3 may only subdivide as an impulse. Within primary wave 3, intermediate waves (1) and (2) may now be complete. Intermediate wave (2) may have ended close to the 0.382 Fibonacci ratio of intermediate wave (1).
A target is calculated for intermediate wave (3) that fits with the higher limit for cycle wave V. Within intermediate wave (3), no second wave correction may move beyond the start of its first wave below 2,914.11. This invalidation point is absolute.
This wave count expects a trend change at Friday’s low; this may be premature. Classic technical analysis will be used next week for confidence in this wave count as outlined in the summary above.
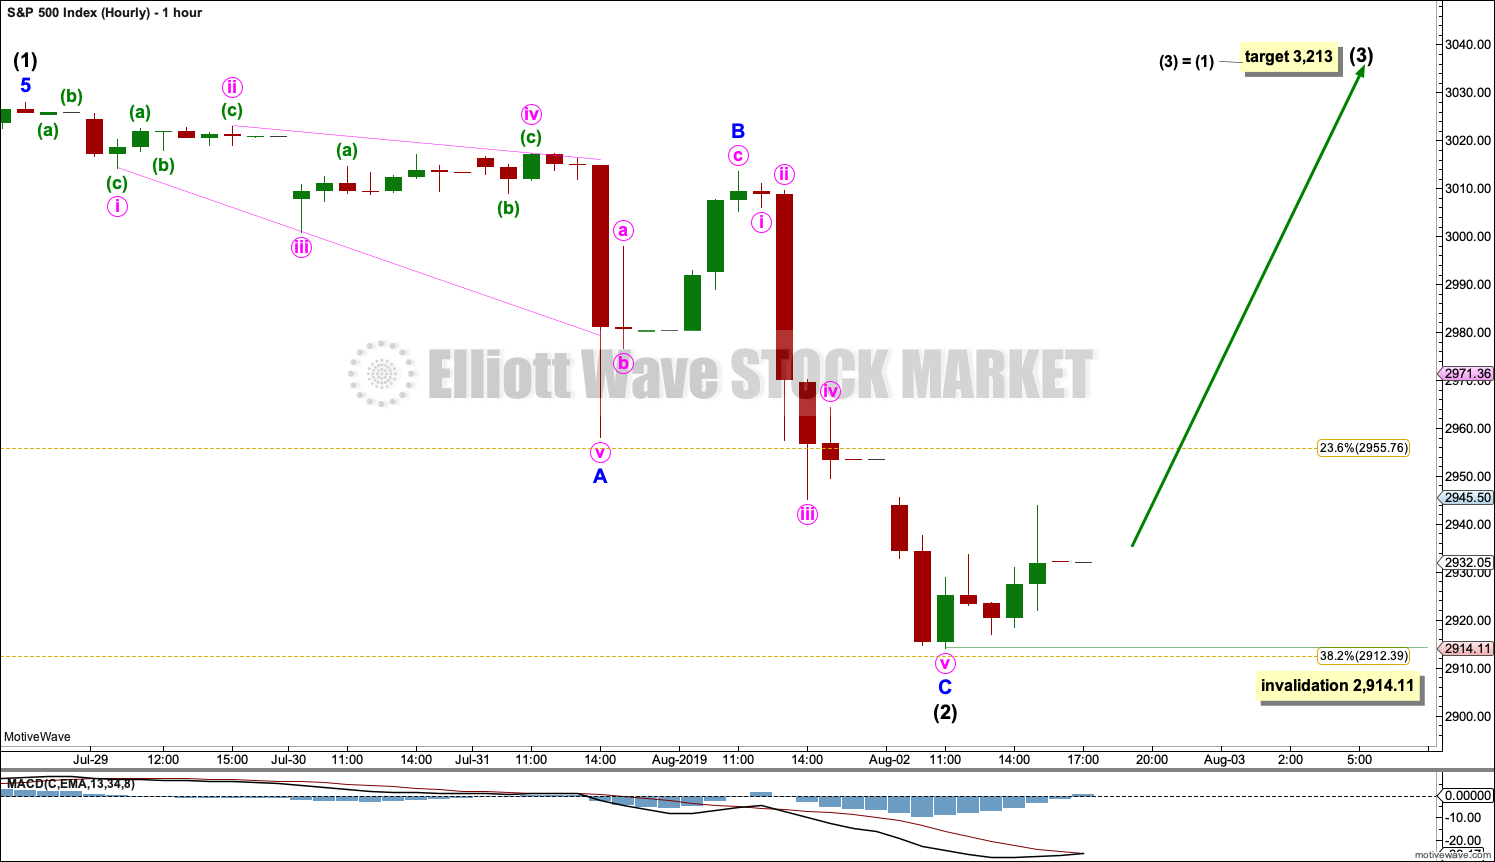
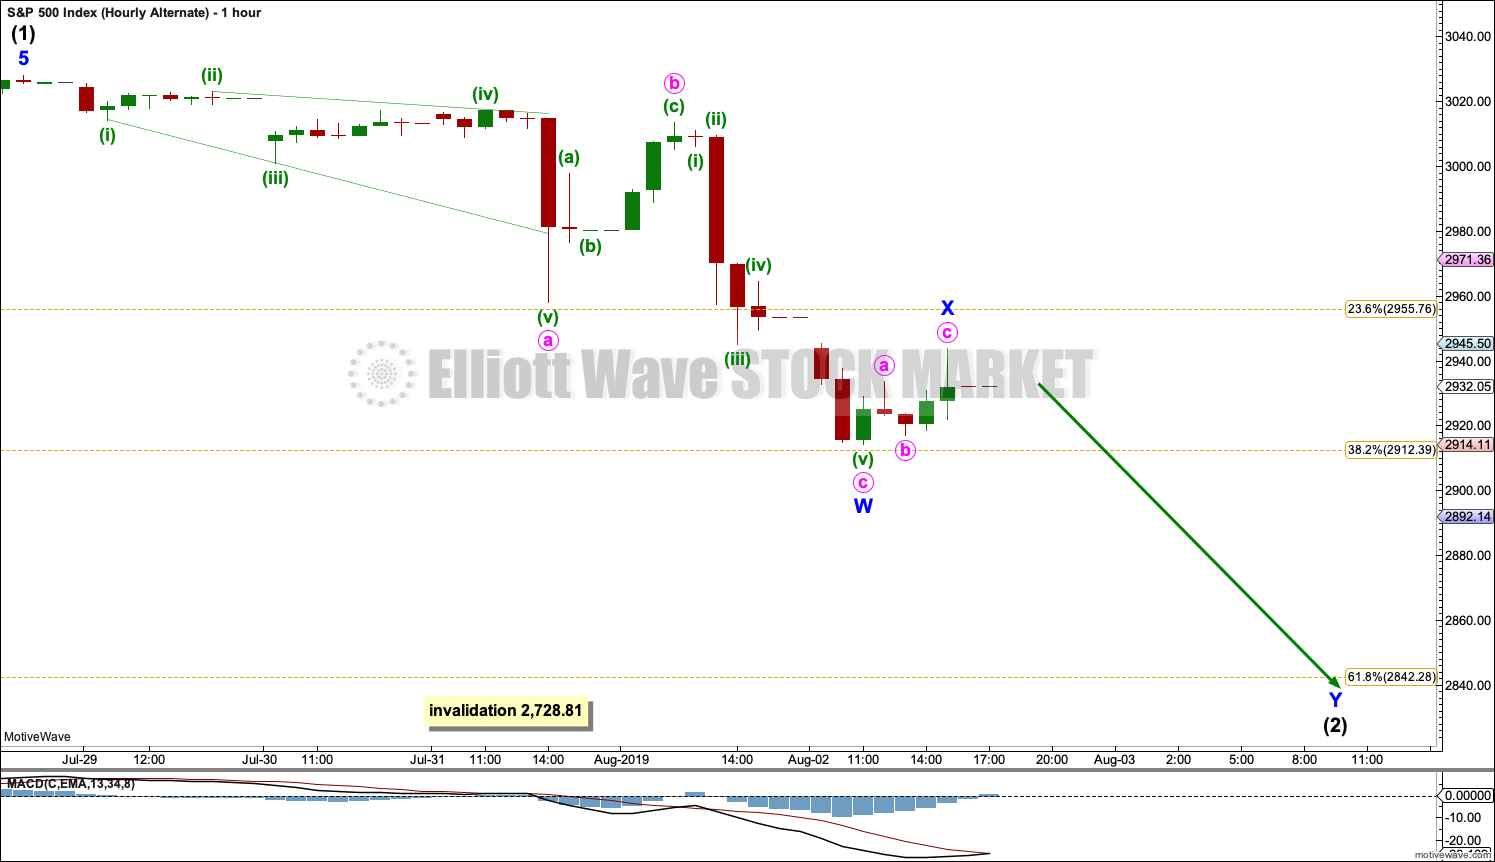
MAIN HOURLY CHART
Click chart to enlarge.
Intermediate wave (2) may now be a complete single zigzag. There is no Fibonacci ratio between minor wave A and C.
Within intermediate wave (3), no second wave correction may move beyond the start of its first wave below 2,914.11.
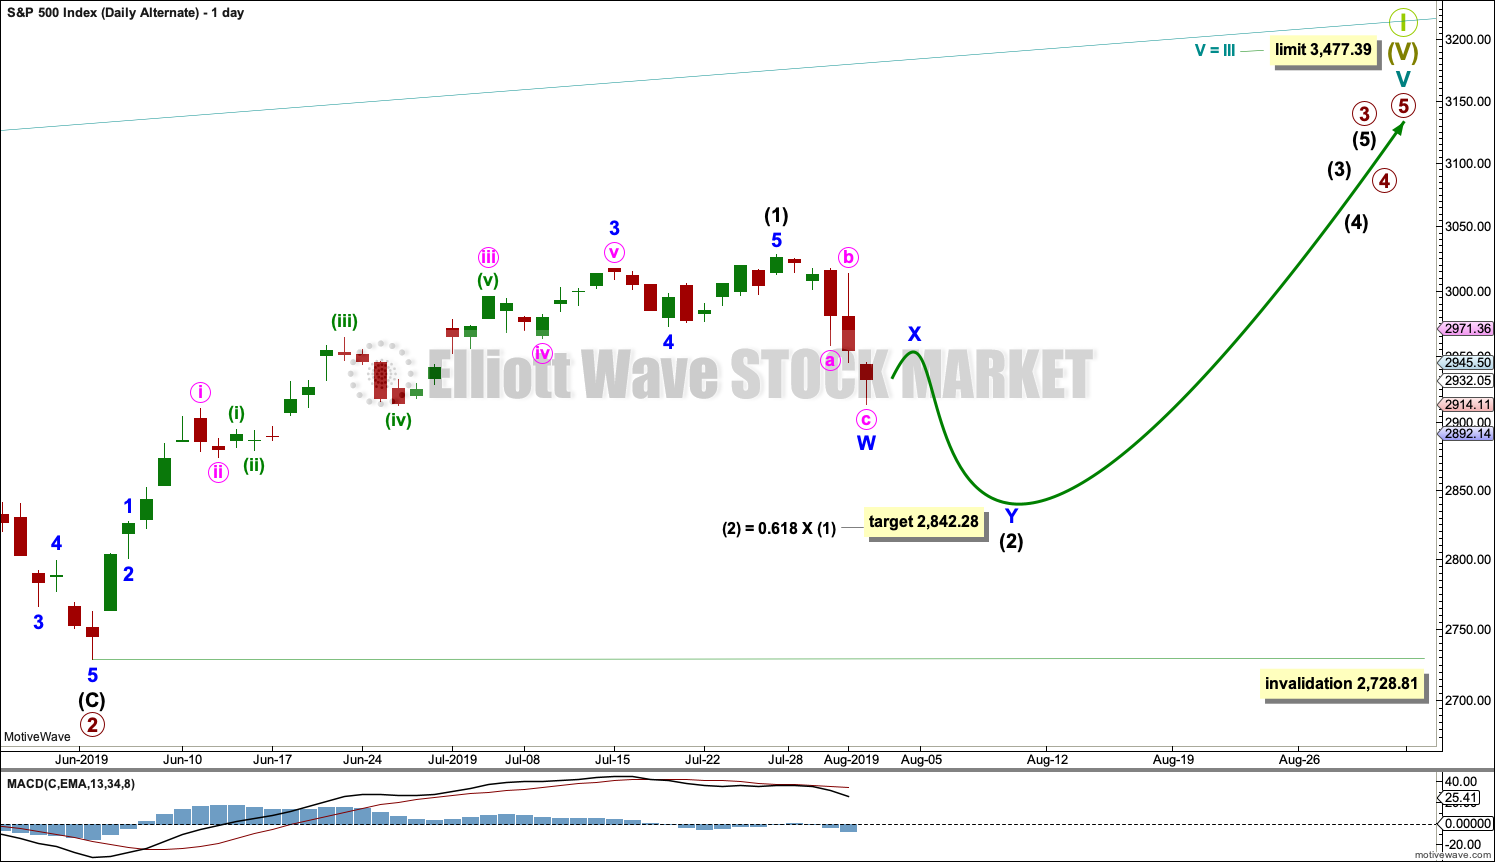
ALTERNATE DAILY CHART
Click chart to enlarge.
This wave count is identical to the main wave count up to the high labelled intermediate wave (1). Thereafter, the degree of labelling within intermediate wave (2) is moved down one degree. It is possible that intermediate wave (2) may continue lower for another week or two as a deeper double zigzag. The 0.618 Fibonacci ratio is a reasonable target.
Intermediate wave (2) may not move beyond the start of intermediate wave (1) below 2,728.81.
ALTERNATE HOURLY CHART
Click chart to enlarge.
Within a double zigzag, X waves are normally brief and shallow. It is possible that minor wave X may be over at Friday’s high, but it is also possible that it may continue higher before it is complete.
Unfortunately, there is no Elliott wave rule stating a limit for X waves within double zigzags or double combinations. Within combinations they may make new price extremes beyond the start of waves W or Y. There can be no upper invalidation point for this wave count for this reason.
SECOND WAVE COUNT
WEEKLY CHART
Click chart to enlarge.
This weekly chart is almost identical to the first weekly chart, with the sole exception being the degree of labelling.
This weekly chart moves the degree of labelling for the impulse beginning in March 2009 all down one degree. This difference is best viewed on monthly charts.
The impulse is still viewed as nearing an end; a fifth wave is still seen as needing to complete higher. This wave count labels it primary wave 5.
TECHNICAL ANALYSIS
WEEKLY CHART
Click chart to enlarge. Chart courtesy of StockCharts.com.
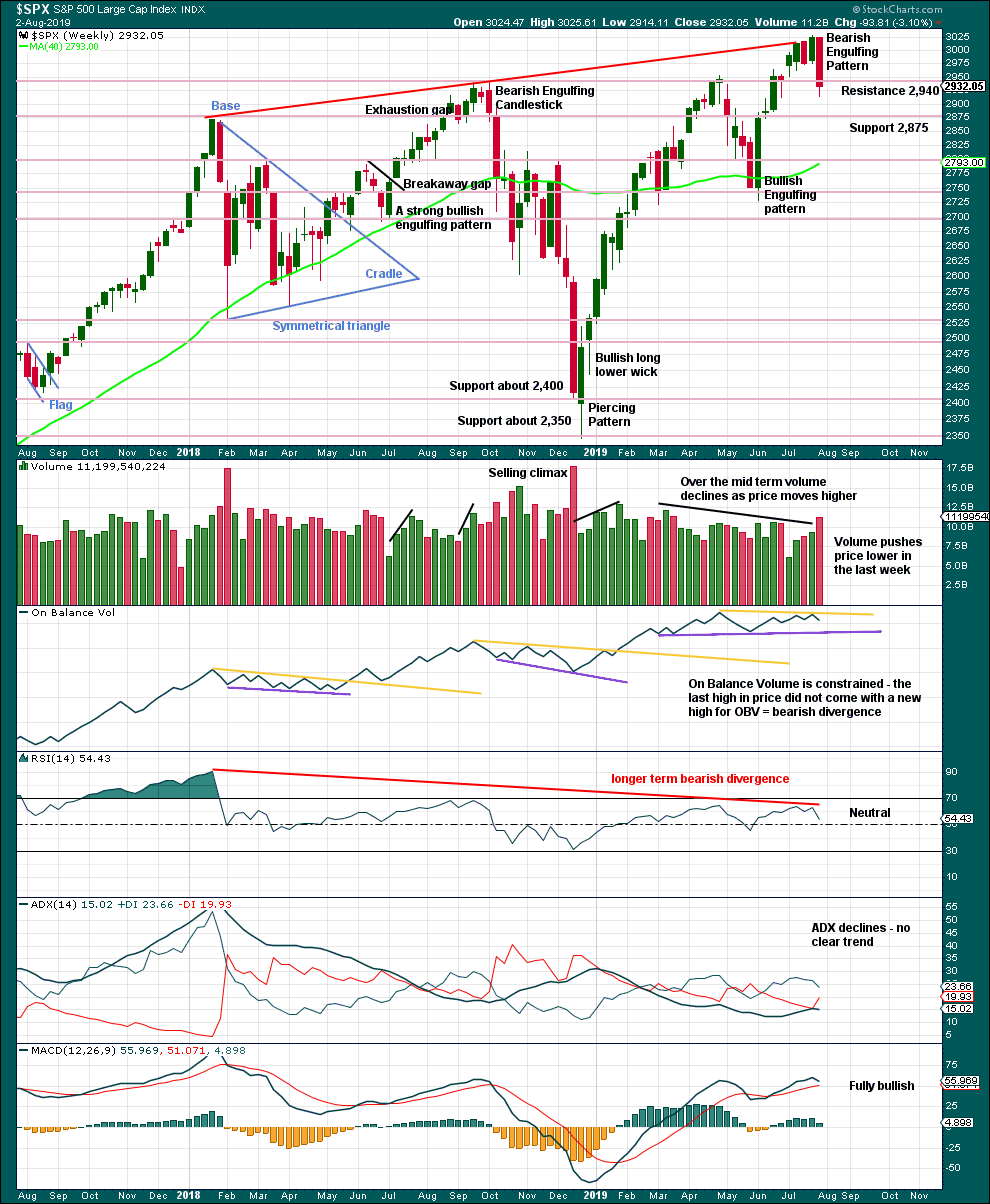
This week a very strong Bearish Engulfing candlestick pattern supports the alternate Elliott wave count. It has good support from volume.
DAILY CHART
Click chart to enlarge. Chart courtesy of StockCharts.com.
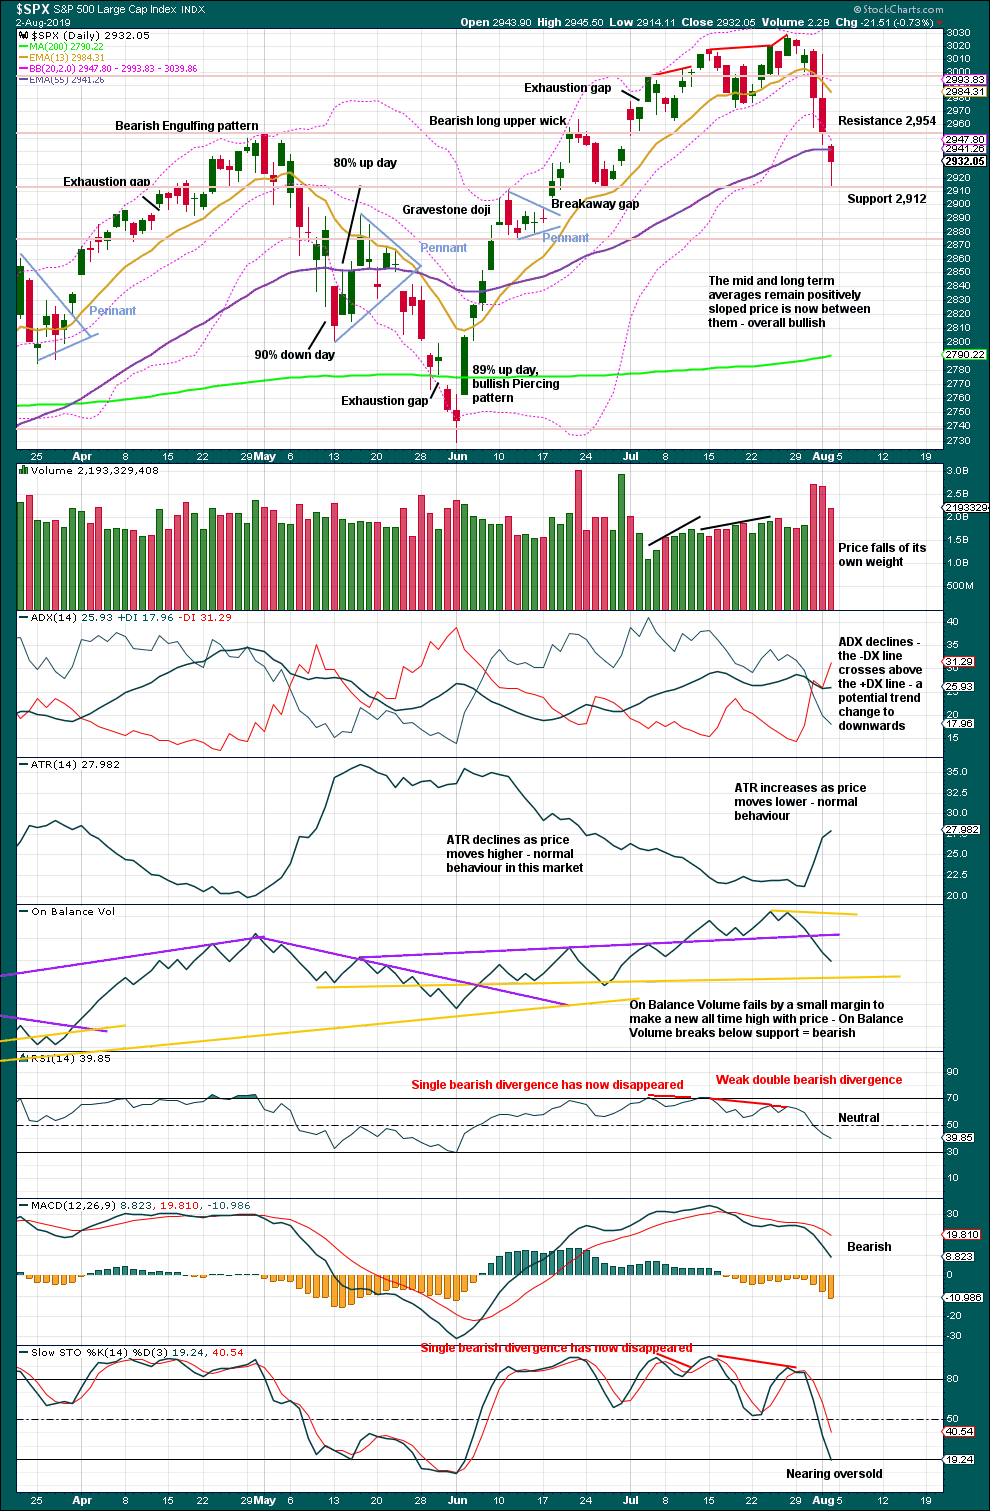
Support about 2,912 has been reached and from there price bounced up on Friday. The long lower wick on Friday’s candlestick is bullish for the short term.
There is still room for price to fall further before conditions reach oversold.
BREADTH – AD LINE
WEEKLY CHART
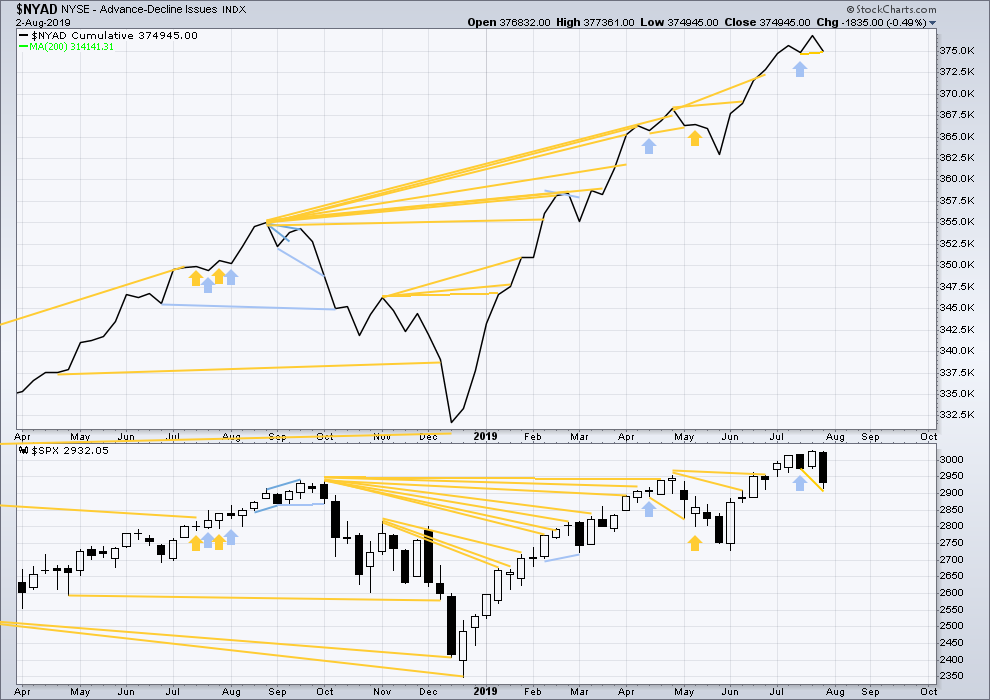
Click chart to enlarge. Chart courtesy of StockCharts.com. So that colour blind members are included, bearish signals
will be noted with blue and bullish signals with yellow.
Bear markets from the Great Depression and onwards have been preceded by an average minimum of 4 months divergence between price and the AD line with only two exceptions in 1946 and 1976. With the AD line making new all time highs again this week, the end of this bull market and the start of a new bear market is very likely a minimum of 4 months away, which is mid November 2019.
In all bear markets in the last 90 years there is some positive correlation (0.6022) between the length of bearish divergence and the depth of the following bear market. No to little divergence is correlated with more shallow bear markets. Longer divergence is correlated with deeper bear markets.
If a bear market does develop here, it comes after no bearish divergence. It would therefore more likely be shallow.
This week price has made a new low below the short term low two weeks prior, but the AD line has failed to make a corresponding new low by a small margin. This divergence is bullish for the short term and slightly supports the main Elliott wave count.
DAILY CHART
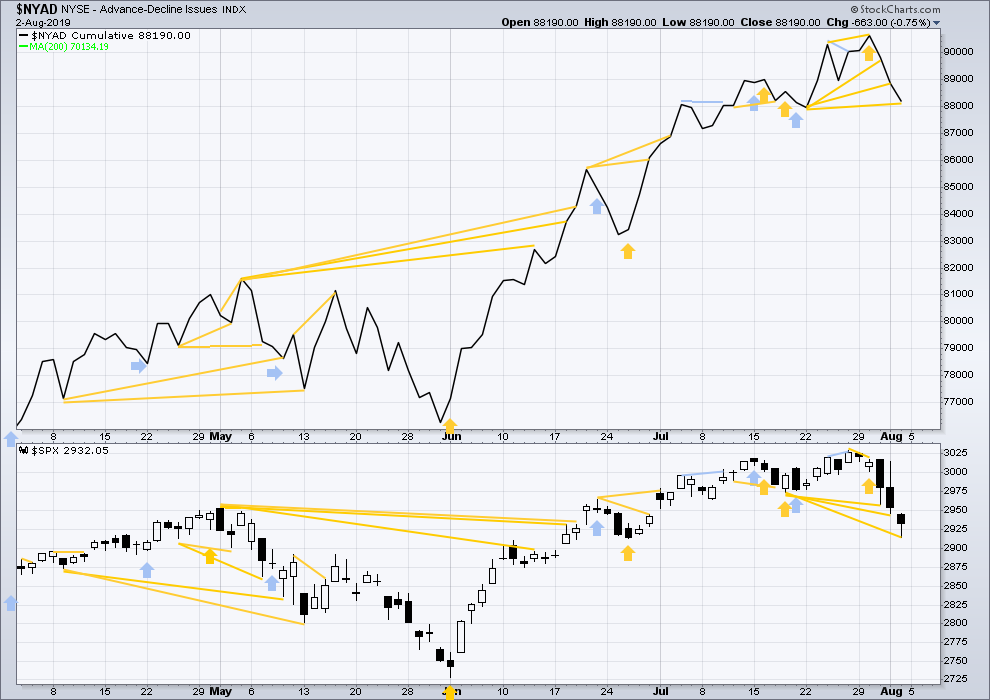
Click chart to enlarge. Chart courtesy of StockCharts.com. So that colour blind members are included, bearish signals
will be noted with blue and bullish signals with yellow.
Breadth should be read as a leading indicator.
Price has moved lower to make another new low below the prior swing low of the 18th / 22nd July, but the AD line has not. Downwards movement does not have support from a corresponding decline in market breadth. This divergence is bullish and suggests any further downwards movement here from price may be relatively limited.
Within this pullback, mid and large caps made new short-term swing lows first then small caps followed on Friday.
VOLATILITY – INVERTED VIX CHART
WEEKLY CHART
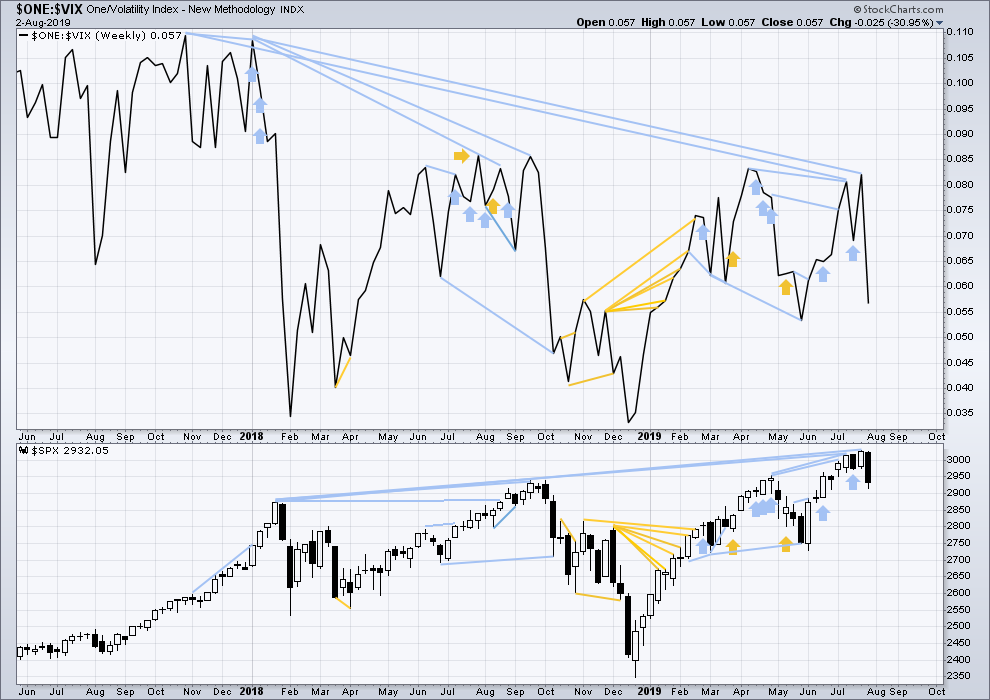
Click chart to enlarge. Chart courtesy of StockCharts.com. So that colour blind members are included, bearish signals
will be noted with blue and bullish signals with yellow.
The all time high for inverted VIX (which is the same as the low for VIX) was on 30th October 2017. There is now nearly one year and nine months of bearish divergence between price and inverted VIX.
The rise in price is not coming with a normal corresponding decline in VIX; VIX remains elevated. This long-term divergence is bearish and may yet develop further as the bull market matures.
This divergence may be an early warning, a part of the process of a top developing that may take years. It may not be useful in timing a trend change.
This week price and inverted VIX have both moved lower. Neither have made a new swing low below the prior swing low of the weeks beginning 28th May / 3rd June.
DAILY CHART
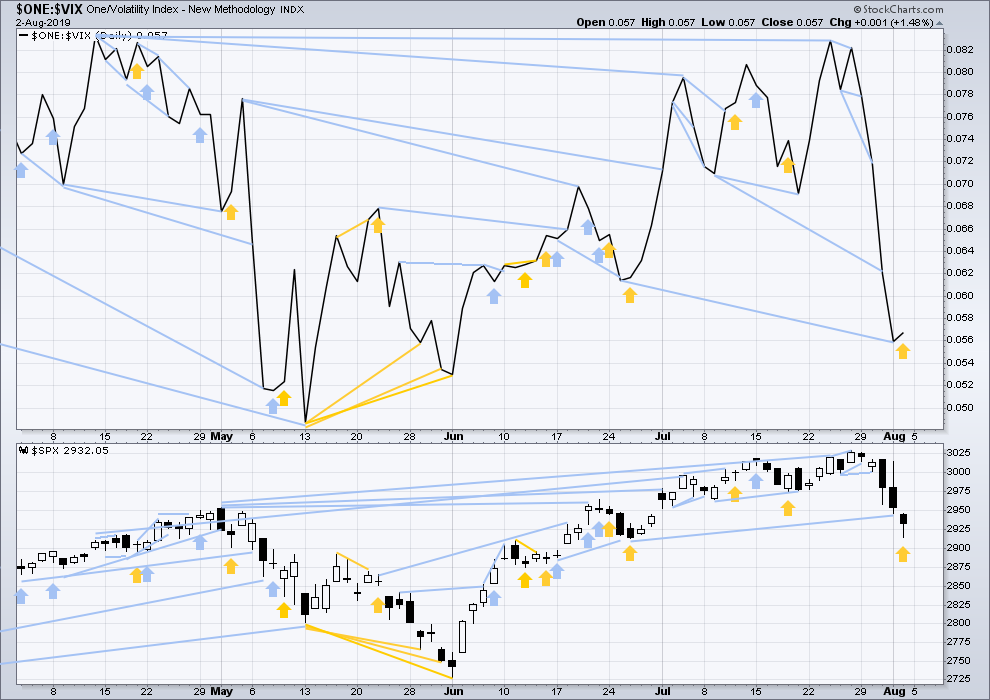
Click chart to enlarge. Chart courtesy of StockCharts.com. So that colour blind members are included, bearish signals
will be noted with blue and bullish signals with yellow.
Bearish mid-term divergence noted in last analysis between current lows and the prior swing low of 25th / 26th June remains, but after Friday’s downward movement it is very slight. It is considered too small to have any predictive value.
On Friday price moved lower, but inverted VIX has moved higher. Downwards movement on Friday did not come with a normal corresponding increase in VIX. This divergence is bullish for the short term and may offer a very small amount of support to the main Elliott wave count because it confirms bullish divergence between price and the AD line.
DOW THEORY
Dow Theory confirmed a bear market in December 2018. This does not necessarily mean a bear market at Grand Super Cycle degree though; Dow Theory makes no comment on Elliott wave counts. On the 25th of August 2015 Dow Theory also confirmed a bear market. The Elliott wave count sees that as part of cycle wave II. After Dow Theory confirmation of a bear market in August 2015, price went on to make new all time highs and the bull market continued.
DJIA: 23,344.52 – a close on the 19th of December at 23,284.97 confirms a bear market.
DJT: 9,806.79 – price has closed below this point on the 13th of December.
S&P500: 2,532.69 – a close on the 19th of December at 2,506.96 provides support to a bear market conclusion.
Nasdaq: 6,630.67 – a close on the 19th of December at 6,618.86 provides support to a bear market conclusion.
With all the indices having moved higher following a Dow Theory bear market confirmation, Dow Theory would confirm a bull market if the following highs are made:
DJIA: 26,951.81 – a close above this point has been made on the 3rd of July 2019.
DJT: 11,623.58 – to date DJT has failed to confirm an ongoing bull market.
S&P500: 2,940.91 – a close above this point was made on the 29th of April 2019.
Nasdaq: 8,133.30 – a close above this point was made on the 26th of April 2019.
Published @ 12:24 a.m. EST on August 3, 2019.
—
Careful risk management protects your trading account(s).
Follow my two Golden Rules:
1. Always trade with stops.
2. Risk only 1-5% of equity on any one trade.
—
New updates to this analysis are in bold.
Yikes! ES gaps down at new open. How low will it go?
It’s pretty ugly out there
Ouch
Hello to all. This might be just my imagination, but I can see a five count down from the high. The fifth wave was the longest, but the third wasn’t the shortest. That would make this the A wave with the B and C to follow. I would expect the C to end somewhere around the .78 for Kevin. Just my 2 cents.
Thanks Rob. Yes, an ABC down to the 78% or 100% seems quite possible here.
The hourly alternate was the one:
Updated chart. It may fit as a complete double zigzag.
QQQ turned right at its 61% retracement from june 3 low…
We’ll have to wait and see if this is just a correction or a beginning of a bear market…
200 points in 7 trading days is a hefty chunk.
But i’m in camp Rod 🙂 We were way oversold at the low of the day…
Yep. I’m on the sidelines today, unwilling to go short. Looking for a possible turn near here.
Okay, the expanding triangle count is “probably not correct”. I buy that wholeheartedly and have since I first heard about.
But IS there a legitimate way to wave count SPX that models the selling since the ATH as the start of a much higher degree correction than merely an intermediate 2? Until SPX cuts beneath the 78% level and then the 100% level, I’m not tooooo concerned. But looking both ways before crossing a street is always wise, or once every blue moon, we’ll get run over by a bus.
The expanding triangle is definitely one such “legitimate” count, but with extremely low probability. Is there another strongly bearish way to model this market, perhaps with higher probability than the expanding triangle model?
Possible bearish view: the rally from June low could be a B, and we are in wave C towards below June lows. We are in 3 of that C
I think you beat me.
Sure if still Cycle wIV correction. Cycle Wave C now completing expanded flat perhaps.
Correction. Meant Primary wC now in progress
Possible running triangle with Primary B extending past Primary wA. So we would have Primary C,D, and E to go.
Primary 2 could be an expanded flat. I may publish the idea for you shortly.
Like this:
intermediate (B) is 1.33 X intermediate (A), within the normal range of up to 1.38.
But intermediate (B) exhibits some strength, not weakness. Which is why I discarded this idea long ago. Technically, from a pure EW point of view, it’s possible. But it’s not supported by volume or the AD line.
Thank you Lara and others.
Wow, that’s some liquidation from the ATH.
Can we totally rule out the possibility that Primary Wave 2 is still in progress, unfolding as a flat?
We are reaching very over sold conditions. NYMO (McClellan Oscillator) is at -65 well below anything since March and near the Dec 2018 low. NYMO & SPX are below their lower BBs and VIX is well above its upper BB. This is a classic set up for a good buy the market signal.
I suspect we will see a strong rally followed by another new low, perhaps tomorrow or Wednesday. The Fear-Greed Index closed Friday at 27, indicating lots of fear. Today it should close below 20 which is a number one might see at a low.
All that being said, all these indicators can go lower or remain there for quite some time. Risk is high and increasing for intermediate and longer term time frames the lower we go. I will be looking for a short term long position coming up soon. I am traveling today and looking with great interest towards tomorrow and Wednesday.
Keep us advised Rodney, always appreciate your analysis.
I put on a broken wing butterfly on SPY last week centered at 289. My definite profit side is anything lower than that, but a Friday close in the 289 area would float that particular boat for me.
I’ve also got a TLT ‘fly (balanced) centered at 136. TLT has gone nuts to the upside and overshot that, BUT I would expect some corrective action and maybe, just maybe, that one can come back to me.
And then I can recoup some of today’s losses. Losing is part of the game, sadly.
BTW, almost the only stock going up in my watch list is PI. I bought some…(and it announced earnings so that risk event is past).
… and I am long off the low
oh yea…also got a GLD ‘fly centered at 139 (139-141-137) for Friday, and GLD is right in that zone presently.
So my week has high potential, despite my otherwise sea of red!
it’s illuminating to compare this correction (so far) to the May correction. That was a big ABC. So far, the action in this one matches the action of the A of that ABC (length of time/depth of correction). If it all plays out similarly (a B up then C down coming), the final low will be at the 76-78% fibo zone, in the 2790’s.
my revised RUT count, with alternate across bottom.
We’re very sorry everybody about the down time for the website today. This was wholly unexpected. Cesar has managed to get it mostly back to working now.
The contact form isn’t working. But you may email me admin@elliottwavestockmarket.com or Cesar at webmaster@elliottwavestockmarket.com if you need to.
Thank you all for your patience.
Hi Lara,
Is there any support from classic analysis to consider a larger cycle degree 4th wave as an expanding triangle. This would obviously imply a near-term very bearish view as we would be in the last leg down in the triangle. I suppose this would have a much higher cycle degree wave V top. I just keep seeing this chart being published by perms-bears and wanted to know if classic technical analysis could support such a view?
This question was asked… I think a couple of days ago?
Technically it’s possible. I know other EW counts are out there for this. However, in my research I have found 0 examples of expanding triangles.
I think I may have seen one once a few years back on the USD Index on the hourly chart.
They appear to be exceptionally rare EW structures. I would not be basing a wave count on one.
Excellent analysis as always, Lara. Thank you! I appreciate your objectivity and prudent use of both EW and standard technical analysis. I learn more each week.
(If I could ever get my trading to the same level as my learning from you, I’d be golden!)
Thank you very much Curtis
Any one else building a long ZN position?
There is some support to indicate an intermediate term liw is in pkace. However, lasting low points are much more common on Mondays and Tuesdays than Thursdays or Fridays. Look for a tet of 2900 coming early next week.
Please excuse the multitude of typographical errors.
1st out of the gate
Congratulations. May the SPX also be ‘out of the gate’ to a renewed uptrend.