
Despite a bullish move from the AD line yesterday, price has moved strongly lower. The short to mid-term picture is adjusted with new data, but the longer-term picture remains the same. Today the AD line indicates how much more downwards movement may be in store.
Summary: A breach of the best fit channel and a new swing low below the prior swing low of the 18th of July indicate the last upwards wave is most likely over and a new wave down or sideways has begun. This is now labelled intermediate wave (2). It may continue overall for a few more sessions, possibly as long as a week or two. The target is now at support at 2,912.
Thereafter, the bull market may resume with a third wave up that should exhibit strength.
The biggest picture, Grand Super Cycle analysis, is here.
Monthly charts were last published here, with video here. There are two further alternate monthly charts here, with video here.
ELLIOTT WAVE COUNTS
The two weekly Elliott wave counts below will be labelled First and Second. They may be about of even probability. When the fifth wave currently unfolding on weekly charts may be complete, then these two wave counts will diverge on the severity of the expected following bear market. To see an illustration of this future divergence monthly charts should be viewed.
FIRST WAVE COUNT
WEEKLY CHART
Click chart to enlarge.
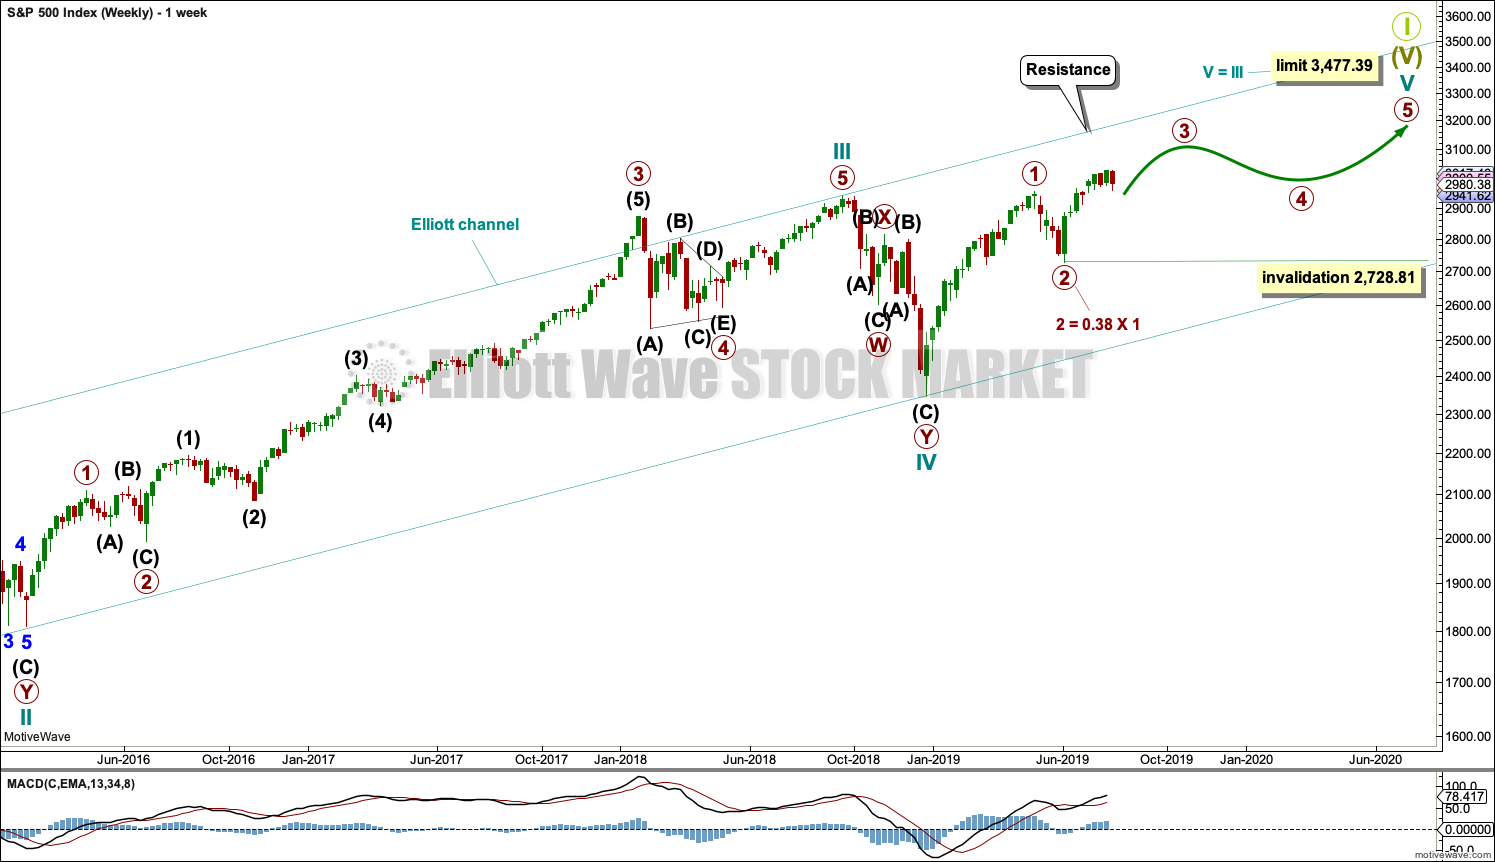
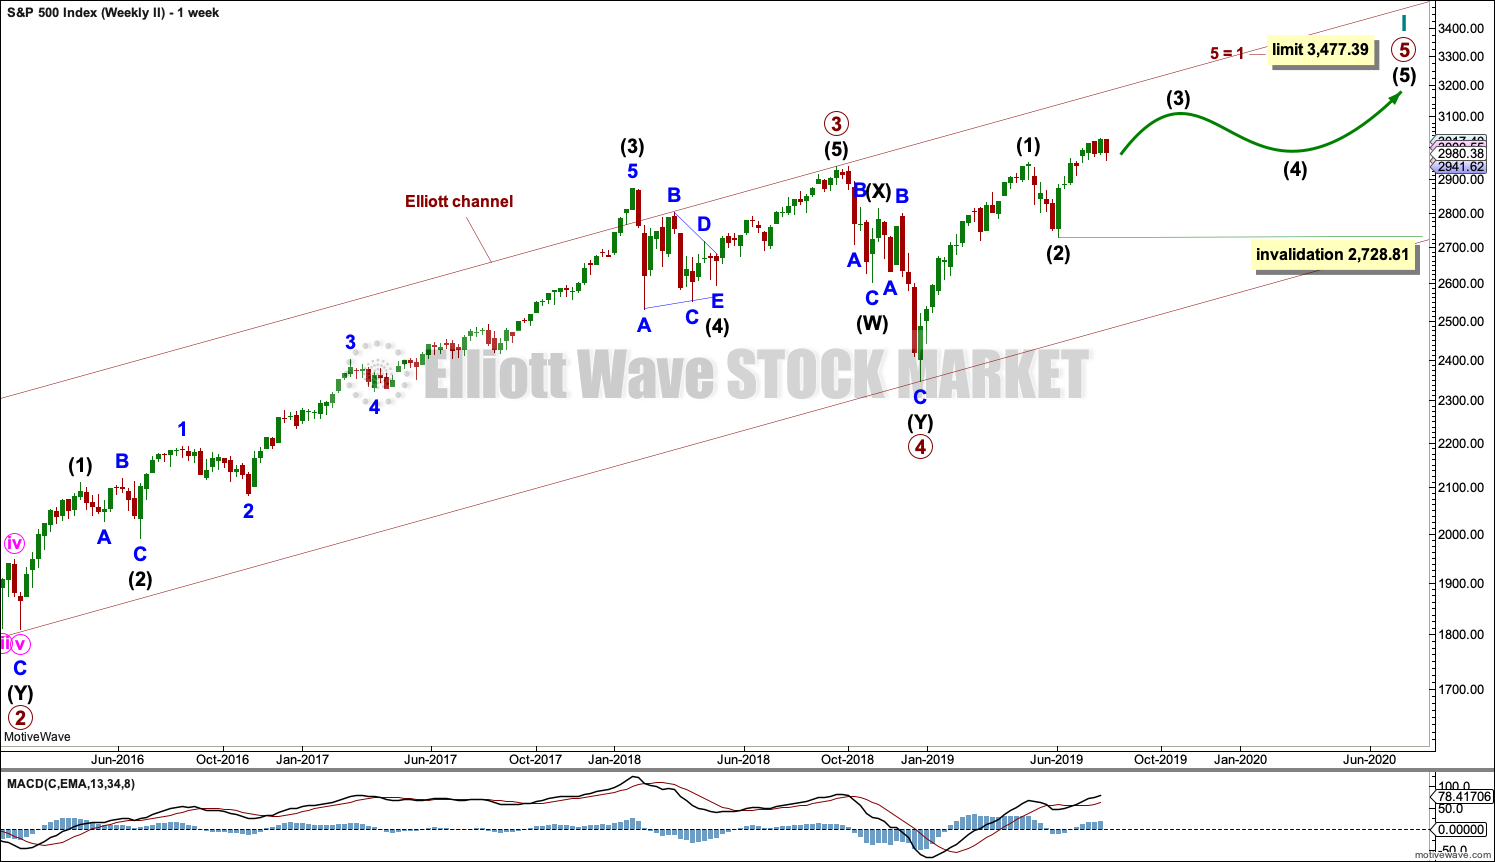
The basic Elliott wave structure consists of a five wave structure up followed by a three wave structure down (for a bull market). This wave count sees the bull market beginning in March 2009 as an incomplete five wave impulse and now within the last fifth wave, which is labelled cycle wave V. This impulse is best viewed on monthly charts. The weekly chart focusses on the end of it.
Elliott wave is fractal. This fifth wave labelled cycle wave V may end a larger fifth wave labelled Super Cycle wave (V), which may end a larger first wave labelled Grand Super Cycle wave I.
The teal Elliott channel is drawn using Elliott’s first technique about the impulse of Super Cycle wave (V). Draw the first trend line from the end of cycle wave I (off to the left of the chart, the weekly candlestick beginning 30th November 2014) to the end of cycle wave III, then place a parallel copy on the end of cycle wave II. This channel perfectly shows where cycle wave IV ended at support. The strongest portion of cycle wave III, the end of primary wave 3, overshoots the upper edge of the channel. This is a typical look for a third wave and suggests the channel is drawn correctly and the way the impulse is counted is correct.
Within Super Cycle wave (V), cycle wave III is shorter than cycle wave I. A core Elliott wave rule states that a third wave may never be the shortest. For this rule to be met in this instance, cycle wave V may not be longer in length than cycle wave III. This limit is at 3,477.39.
Within cycle wave V, primary waves 1 and 2 may now be complete. Within primary wave 3, no second wave correction may move beyond its start below 2,728.81.
Cycle wave V may subdivide either as an impulse or an ending diagonal. Impulses are much more common. Ending diagonals normally have second and fourth waves that are deep; the common depth is from 0.66 to 0.81 the prior wave. So far a correction within cycle wave V has not been deeper than 0.5, so a diagonal at this stage looks very unlikely (but remains possible).
In historic analysis, two further monthly charts have been published that do not have a limit to upwards movement and are more bullish than this wave count. Members are encouraged to consider those possibilities (links below summary) alongside the wave counts presented on a daily and weekly basis.
The daily chart below will now focus on price movement from the low of primary wave 2.
DAILY CHART
Click chart to enlarge.
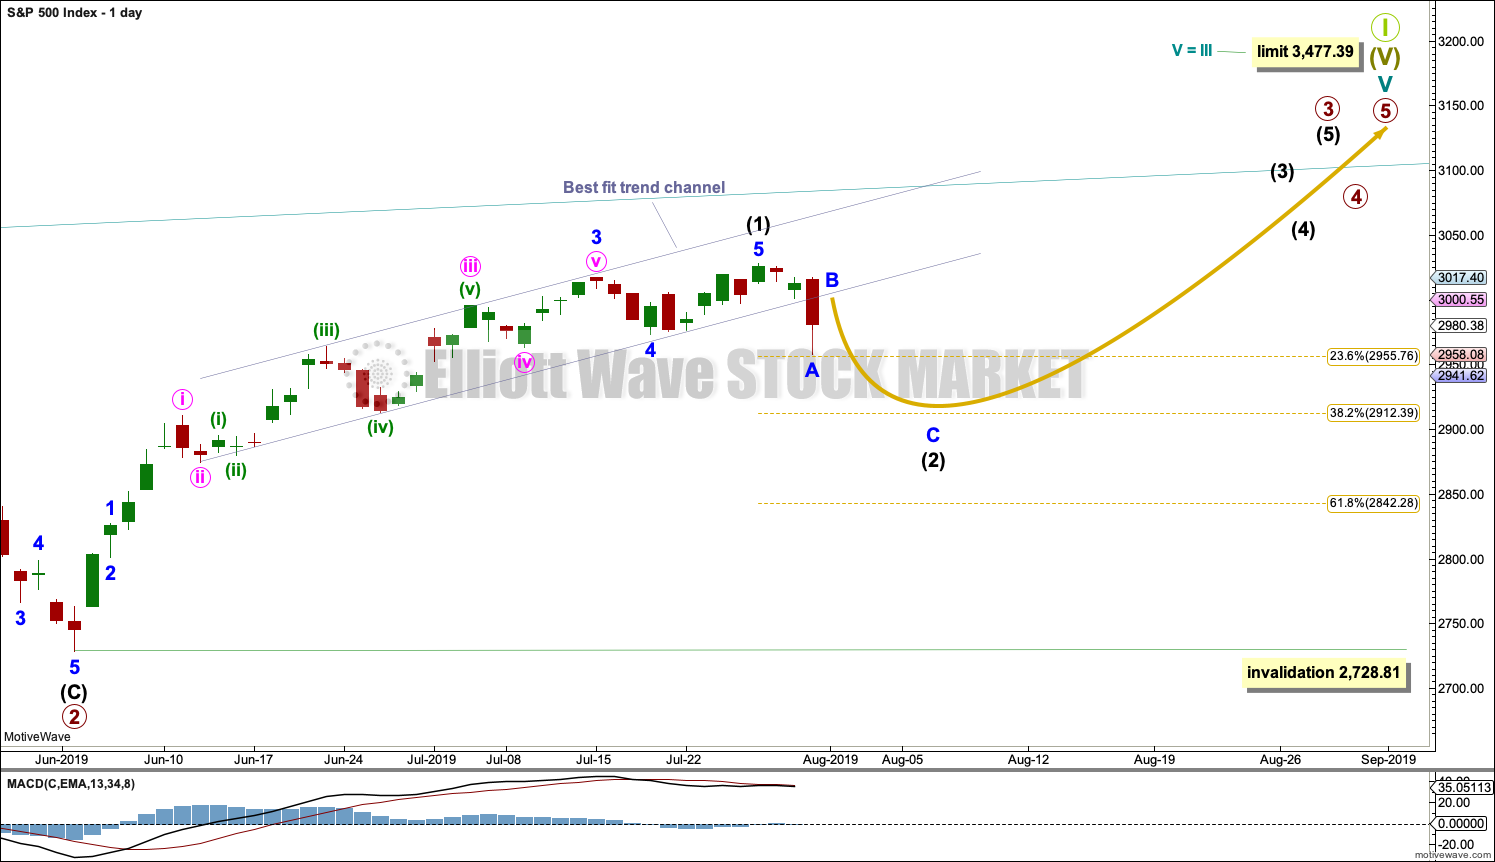
Cycle wave V must subdivide as a five wave motive structure. Within that five wave structure, only primary wave 1 may be complete.
The upwards wave labelled intermediate wave 1 fits neatly into a best fit channel. With a strong breach of that channel today, that wave is indicated as likely over and a correction to follow it may have begun.
Intermediate wave (2) may last a few days to a week or so. The first target would be about support at the 0.382 Fibonacci ratio. If price keeps falling through this first target, then the next target would be the 0.618 Fibonacci ratio, but this looks less likely.
Intermediate wave (2) may not move beyond the start of intermediate wave (1) below 2,728.81.
HOURLY CHART
Click chart to enlarge.
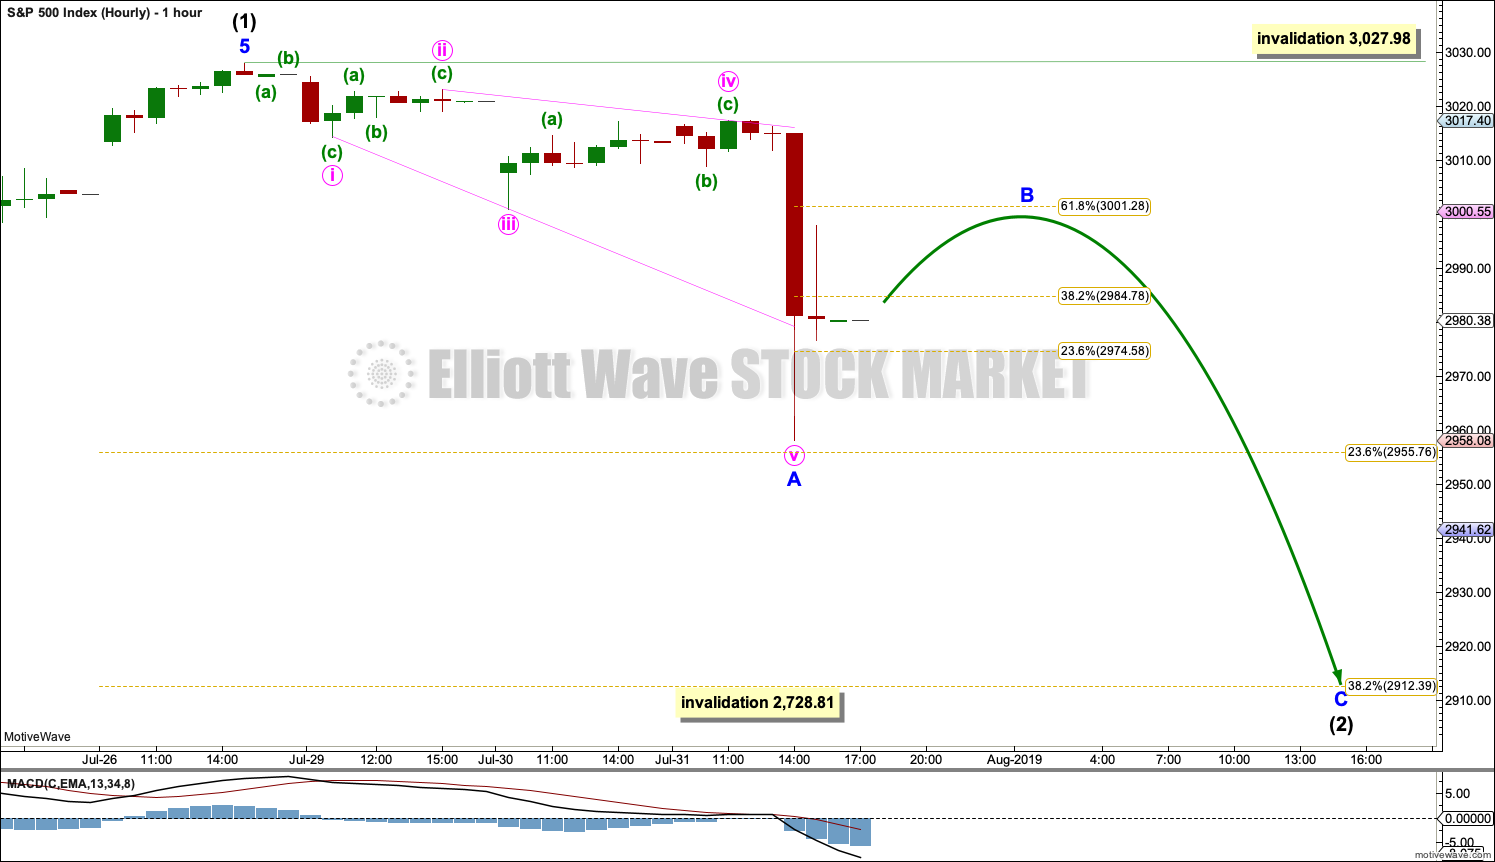
Intermediate wave (2) may subdivide as any corrective Elliott wave structure except a triangle. The most common structure for second waves is a zigzag.
Minor wave A fits as a leading expanding diagonal. If minor wave A is a five, then minor wave B may not move beyond its start above 3,027.98.
Minor wave B may subdivide as any one of more than 23 possible Elliott wave corrective structures. It may be a quick sharp zigzag or a more time consuming combination, triangle or flat. It may last a few days to a week or more.
When minor wave B may be complete, then minor wave C downwards should complete intermediate wave (2).
ALTERNATE HOURLY CHART
Click chart to enlarge.
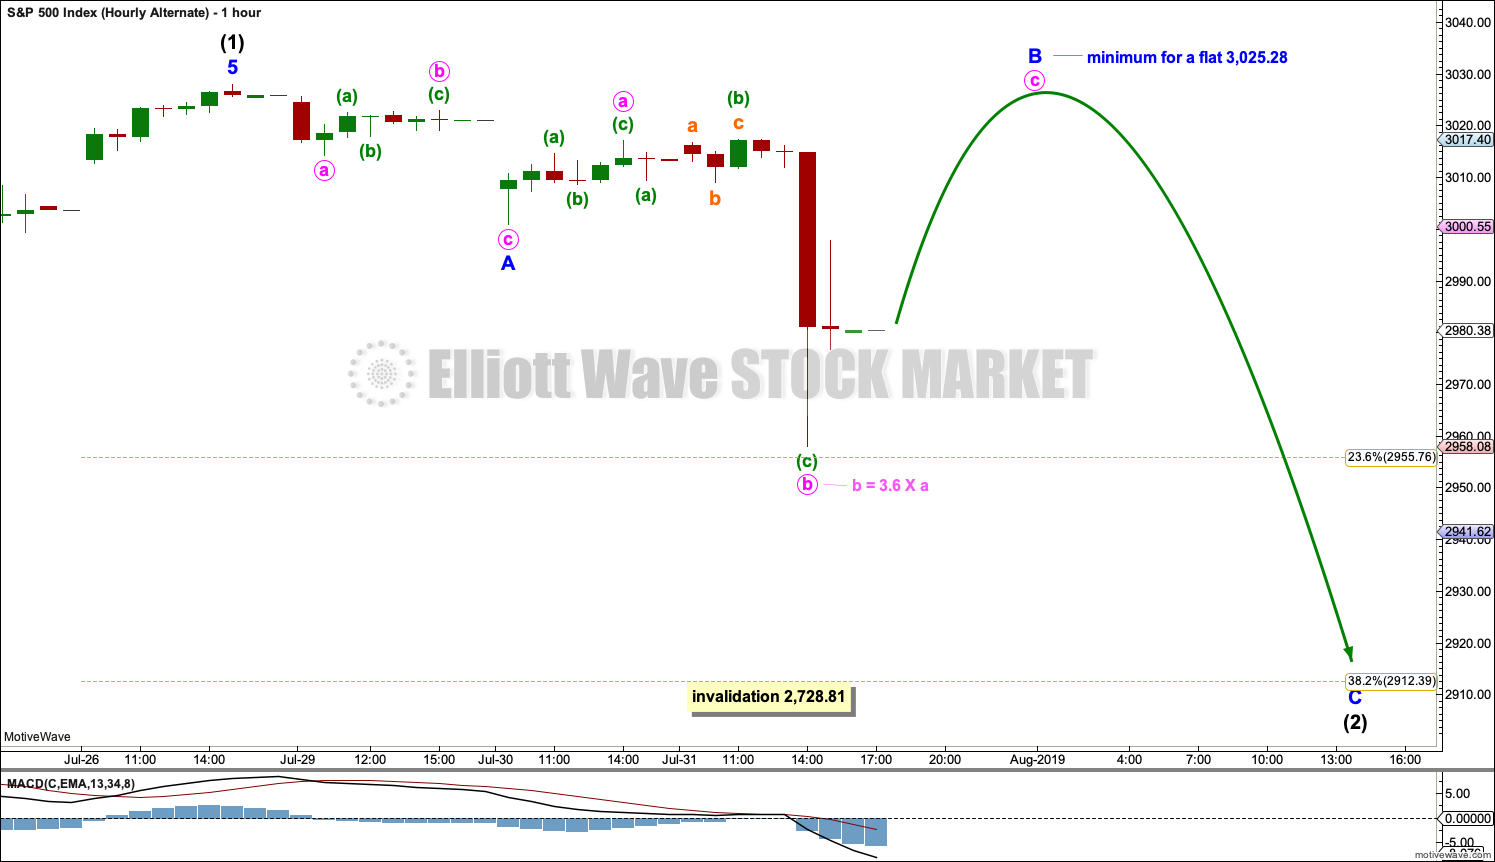
It is also possible that minor wave A was a brief shallow three, and minor wave B may be unfolding as a three.
A flat correction is indicated when A waves subdivide as threes. Within a flat correction, minor wave B must retrace a minimum 0.9 length of minor wave A at 3,025.28.
Thereafter, minor wave C downwards should unfold.
This wave count is an alternate because the structure of minor wave B has a very low probability. Minor wave B is labelled as an incomplete flat correction. Within the flat, minute wave b is much longer than the maximum allowable range of up to 2 times the length of minute wave a. However, this wave count is valid. There is no Elliott wave rule which states a maximum limit for B waves within flats, and my research so far shows they may occasionally be longer than 2.
SECOND WAVE COUNT
WEEKLY CHART
Click chart to enlarge.
This weekly chart is almost identical to the first weekly chart, with the sole exception being the degree of labelling.
This weekly chart moves the degree of labelling for the impulse beginning in March 2009 all down one degree. This difference is best viewed on monthly charts.
The impulse is still viewed as nearing an end; a fifth wave is still seen as needing to complete higher. This wave count labels it primary wave 5.
TECHNICAL ANALYSIS
WEEKLY CHART
Click chart to enlarge. Chart courtesy of StockCharts.com.
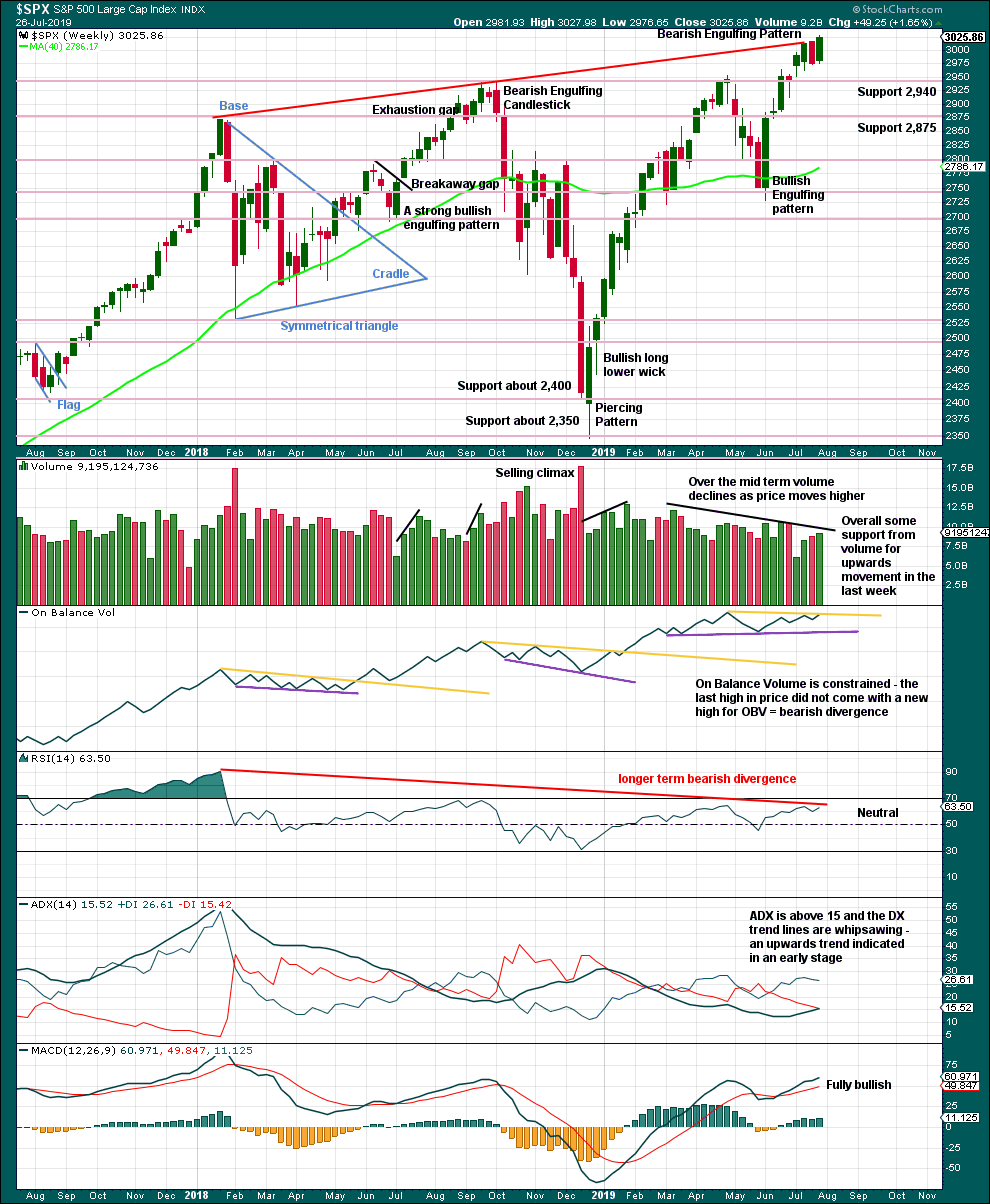
Last week volume offers some support to upwards movement, although the longer-term trend of declining volume with rising price persists.
Bearish divergence between price and On Balance Volume is too slight to be given much weight in this analysis. Sometimes this can just disappear, particularly when it is very weak.
Longer-term bearish divergence between price and RSI may develop further before a larger downwards trend begins to resolve it.
The strongest signal ADX can give is when it rises up from low levels and below both directional lines to 15 or above. Last week ADX gives a strong signal for an upwards trend, which may be in its relatively early stages.
DAILY CHART
Click chart to enlarge. Chart courtesy of StockCharts.com.
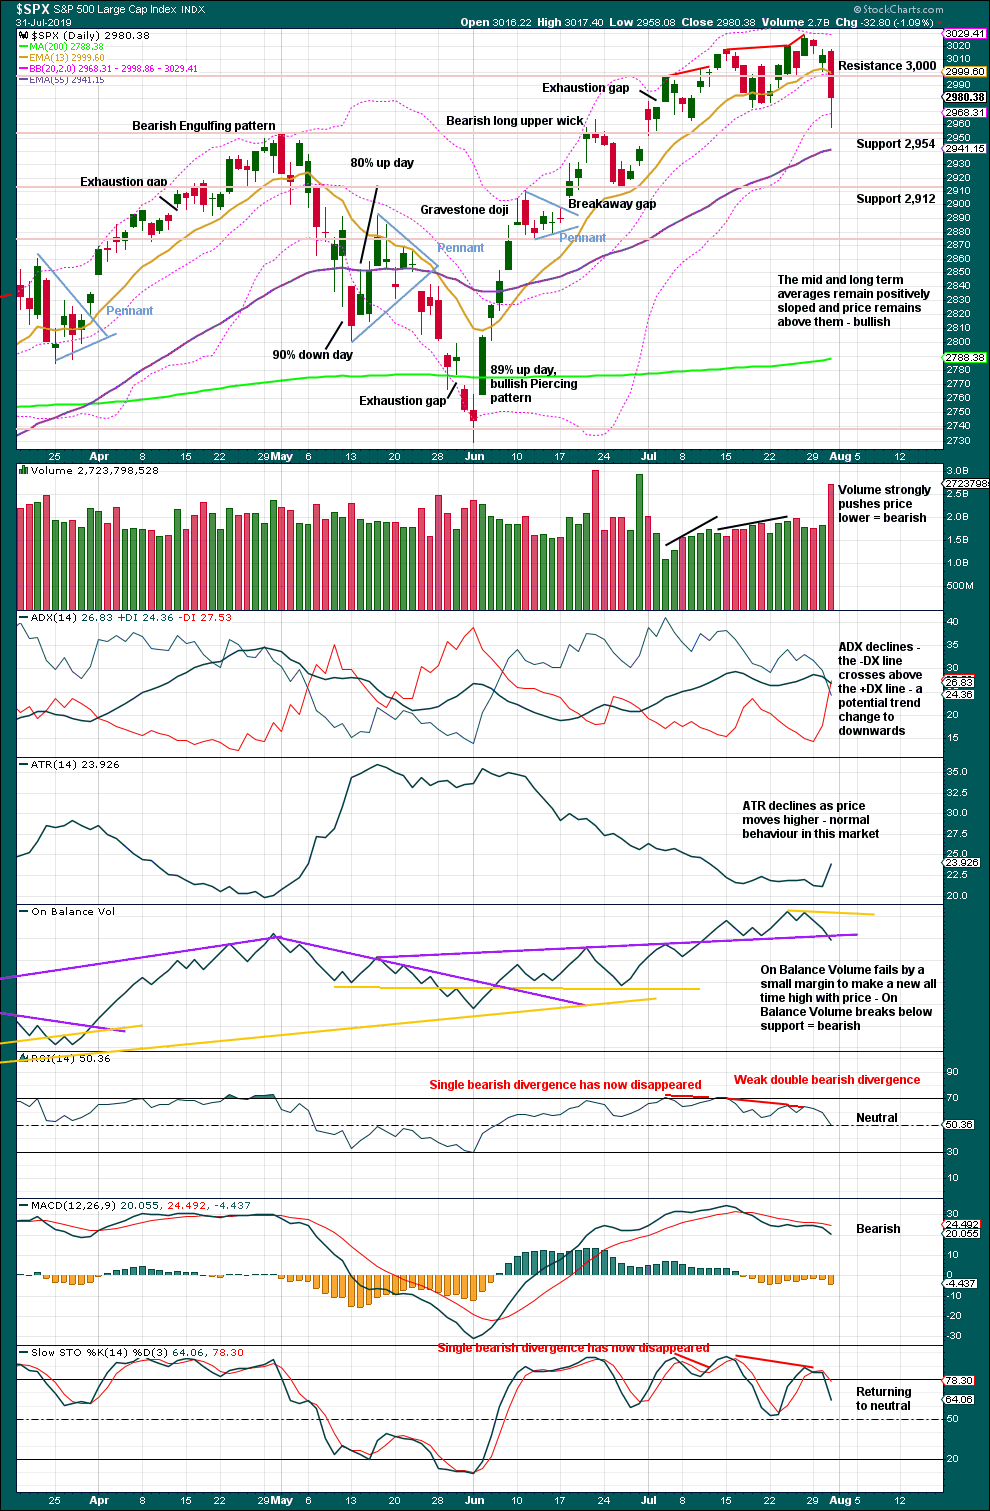
Support about 3,000 has now broken. Next support is about 2,954 and below that 2,912.
There was a series of higher lows and higher highs from the low on the 3rd of June, the basic definition of an upwards trend. Today is the first day within that trend that a new swing low has been made, indicating the possibility of a trend change. The new low today is below the prior swing low of the 18th of July. This supports the new Elliott wave count.
Volume strongly pushing price lower today suggests more downwards movement ahead. The long lower wick today is bullish, but the signal from volume is stronger.
The bearish signal from On Balance Volume supports the new Elliott wave count today.
BREADTH – AD LINE
WEEKLY CHART
Click chart to enlarge. Chart courtesy of StockCharts.com. So that colour blind members are included, bearish signals
will be noted with blue and bullish signals with yellow.
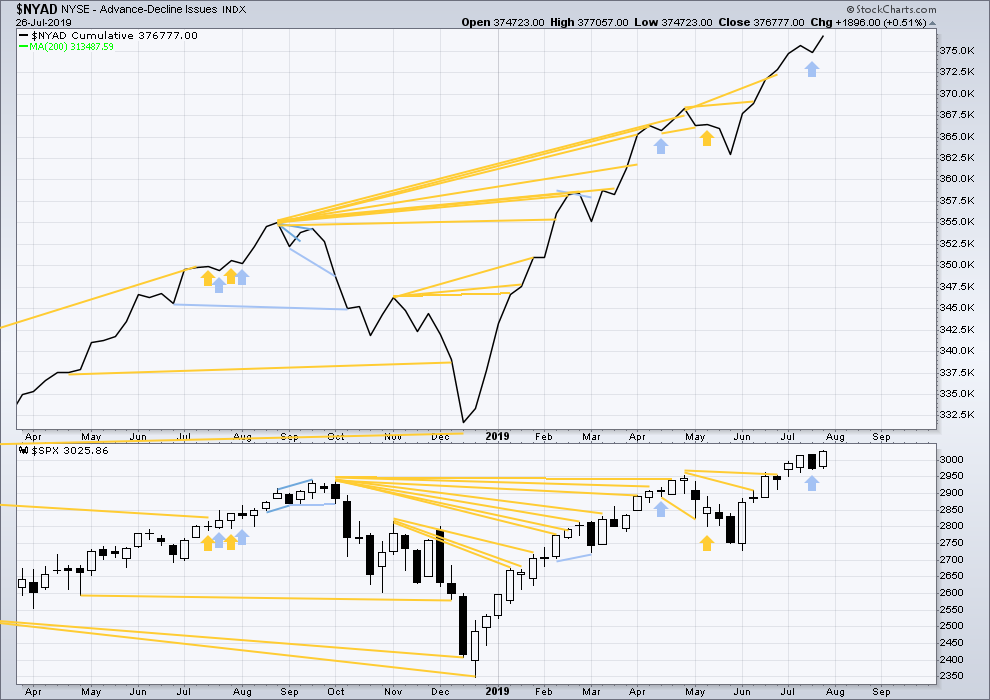
Bear markets from the Great Depression and onwards have been preceded by an average minimum of 4 months divergence between price and the AD line with only two exceptions in 1946 and 1976. With the AD line making new all time highs again this week, the end of this bull market and the start of a new bear market is very likely a minimum of 4 months away, which is mid November 2019.
In all bear markets in the last 90 years there is some positive correlation (0.6022) between the length of bearish divergence and the depth of the following bear market. No to little divergence is correlated with more shallow bear markets. Longer divergence is correlated with deeper bear markets.
If a bear market does develop here, it comes after no bearish divergence. It would therefore more likely be shallow.
Last week both price and the AD line make new all time highs on the weekly chart. There is no divergence.
Mid caps have now made a new all time high last week, but small caps remain below their all time high of 25th February 2019. Weakness is now predominantly in small caps. This is normal behaviour during the later stages of a bull market, and may be expected to develop further before the bull market may end. Tops are a process and that process may last months to even years.
DAILY CHART
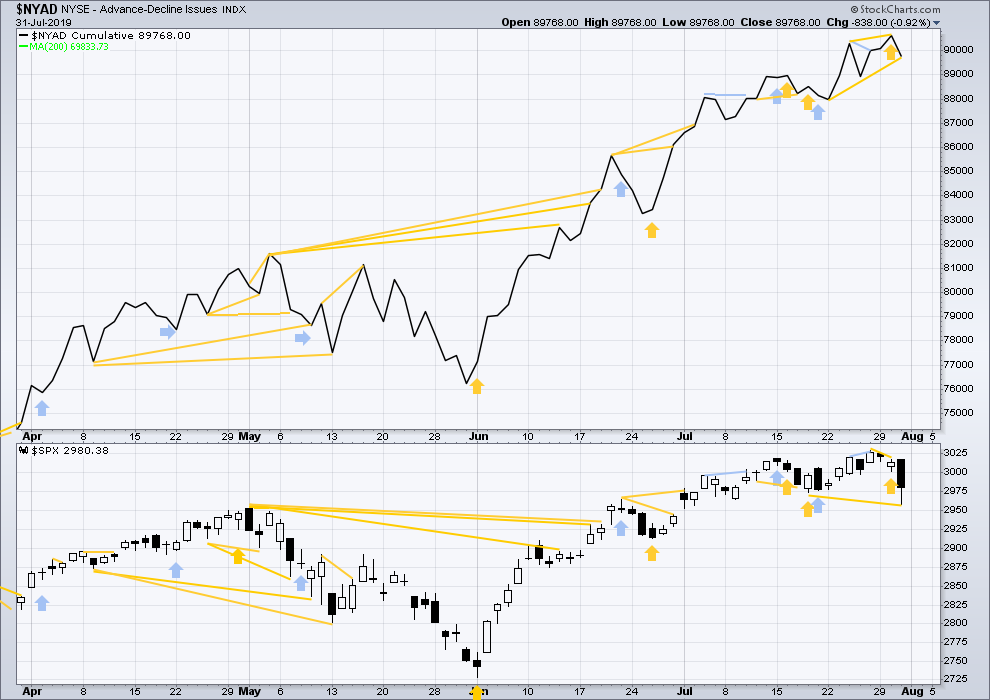
Click chart to enlarge. Chart courtesy of StockCharts.com. So that colour blind members are included, bearish signals
will be noted with blue and bullish signals with yellow.
Breadth should be read as a leading indicator.
Bullish divergence noted in yesterday’s analysis has not been followed by any upwards movement, so it is considered to have failed.
Today price has moved strongly lower to make a new low reasonably below the prior swing low of the 18th / 22nd July, but the AD line has not. Downwards movement does not have support from a corresponding decline in market breadth. This divergence is bullish and suggests any further downwards movement here from price may be relatively limited.
VOLATILITY – INVERTED VIX CHART
WEEKLY CHART
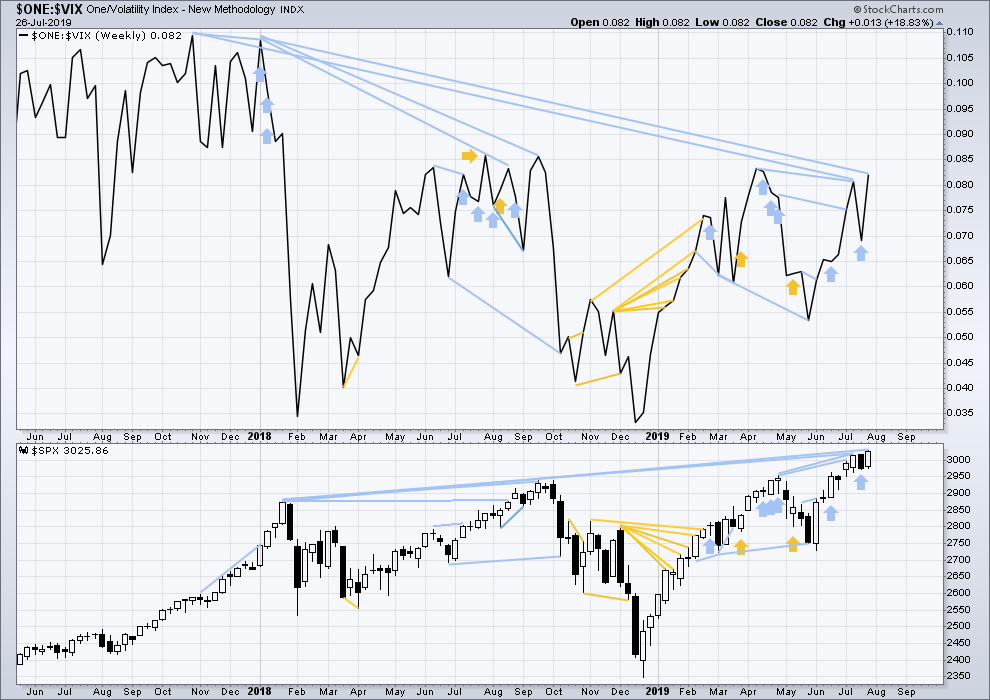
Click chart to enlarge. Chart courtesy of StockCharts.com. So that colour blind members are included, bearish signals
will be noted with blue and bullish signals with yellow.
The all time high for inverted VIX (which is the same as the low for VIX) was on 30th October 2017. There is now nearly one year and eight months of bearish divergence between price and inverted VIX.
The rise in price is not coming with a normal corresponding decline in VIX; VIX remains elevated. This long-term divergence is bearish and may yet develop further as the bull market matures.
This divergence may be an early warning, a part of the process of a top developing that may take years. It may not be useful in timing a trend change.
Last week price has made a new all time high, but inverted VIX still exhibits longer-term bearish divergence. For the short term, there is no divergence between price and inverted VIX for the last swing high two weeks ago.
DAILY CHART

Click chart to enlarge. Chart courtesy of StockCharts.com. So that colour blind members are included, bearish signals
will be noted with blue and bullish signals with yellow.
Bearish divergence noted in yesterday’s analysis (but not given weight) has now been followed by some strong downwards movement. It is considered to have been correct.
Today both price and inverted VIX have made new lows below the prior swing low of the 9th of July. There is no short-term divergence.
DOW THEORY
Dow Theory confirmed a bear market in December 2018. This does not necessarily mean a bear market at Grand Super Cycle degree though; Dow Theory makes no comment on Elliott wave counts. On the 25th of August 2015 Dow Theory also confirmed a bear market. The Elliott wave count sees that as part of cycle wave II. After Dow Theory confirmation of a bear market in August 2015, price went on to make new all time highs and the bull market continued.
DJIA: 23,344.52 – a close on the 19th of December at 23,284.97 confirms a bear market.
DJT: 9,806.79 – price has closed below this point on the 13th of December.
S&P500: 2,532.69 – a close on the 19th of December at 2,506.96 provides support to a bear market conclusion.
Nasdaq: 6,630.67 – a close on the 19th of December at 6,618.86 provides support to a bear market conclusion.
With all the indices having moved higher following a Dow Theory bear market confirmation, Dow Theory would confirm a bull market if the following highs are made:
DJIA: 26,951.81 – a close above this point has been made on the 3rd of July 2019.
DJT: 11,623.58 – to date DJT has failed to confirm an ongoing bull market.
S&P500: 2,940.91 – a close above this point was made on the 29th of April 2019.
Nasdaq: 8,133.30 – a close above this point was made on the 26th of April 2019.
Published @ 10:20 p.m. EST.
—
Careful risk management protects your trading account(s).
Follow my two Golden Rules:
1. Always trade with stops.
2. Risk only 1-5% of equity on any one trade.
—
New updates to this analysis are in bold.
Hi everybody, I hope you all managed to make a little $ off that move down today. The bounce at the open was expected, although it was deeper than the 0.618 Fibonacci ratio.
Minor B looks like it was a quick sharp zigzag. Minor C is now just 1.54 points short of equality in length with minor A, so intermediate (2) could be over here.
But I’m going to wait for Lowry’s data and Stockcharts data to be finalised for the session before I can draw a conclusion about this.
I could move the degree of labelling within intermediate (2) all down one, this could be only wave A of a flat, or wave W of a double combination or double zigzag.
Thank you Lara!
Going short with first stop at an hourly close above this breakdown candle
thanks Don!
Looks like a lot of folks had a similar idea, bingo! Either that or…there’s news?
Oh snap…yea, from the usual “news” source. Heavens to murgatroid.
Kevin aka Snagglepuss
I guess I gave away the decade during which I grew up…
Hi, I was wondering how many subscribers use the Motivewave chart package?
I have an old version to which I can no longer connnect as of a few weeks ago and I am wondering whether to purchase a new package. It seems quite expensive for what it is, although useful to replicate Lara’s wave labelling.
Any views on this would be helpful.
Hi Nick, I have been using MW for many years and find it a very versatile platform, especially for EW analysis. That being said I utilize the programability of MW In order to create propriety indicators and trading systems. This is provided through MW’s robust API. It requires an understanding of the JAVA language, however that is not overly complex. MW also has programmers available to code your indicators or trading system to the your specifications. Hope that helps
P.S. Executes trades directly from chart.
Interesting. It is exactly the difficulty of the API in MW that keeps me from bothering much with it. The hurdles for custom indicators are far far greater than the simplicity of coding up EasyLanguage scripts or ThinkScript for ToS. I managed to get to the point of having a working Eclipse that would build my Java code and was able to install it…but then the challenge of WRITING the code I wanted presented itself, and I found that there was next to nothing available as examples. I gave up. Would be awesome if they could somehow front all of that with a simple and easy to use scripting language interface (though that’s probably not feasible). So the only value it really has for me is the simplicity of EW counting. Otherwise, the tech analysis tools on it are IMO less usable than ToS, and of ToS has far more custom tools available (because of the wider user base and ease of scripting), some of which I really value. So…I stick with ToS.
Hi Kevin,
Not sure if you will catch my reply below that I wrote yesterday re your chart.
Cheers
Peter
Works if you call the top of [i] as 2958.06. Otherwise you get overlap between [i] and [iv].
Even then the 4 looks too big for the 2.
If 4 ended at 2973.09, then 5 and (1) at 3027.98, it would have the right “look”
Thanks.
Here’s /ES with a wave count that largely matches Lara’s, and wonders if the intermediate 2 might be a now complete WXY. W and X sure look like 3 waves, and Y does too…and more and more as price rises here. Though that could be a 4 and 5 down is coming to complete a flat with a 5 wave C (instead of 3 wave Y).
Oh right, this has the same problem. Subtle…well, I still wonder if the overall correction started “one peak back” and is either a big flat (to go deeper down in C) or a combination (now complete).
Look at rates today, they are all down across the board and much lower for the week. If FOMC comments would have driven rates higher, the sell off would make more sense. Looking where rates are at now and reclaiming 3k, I wouldn’t be surprised if there is some kind of bottom in now…
That’s my thinking. That said, I took the opportunity just this moment to exit my overhead butterflies in SPX and RUT (IWM) at a tiny loss. I’ve learned the hard way to not casually dismiss Lara’s calls.
First!
The most important statement to me is from the second sentence of today’s analysis, “the longer-term picture remains the same.” When Minor C of Intermediate 2 completes, we will have a great opportunity to join the longer term trend if one is not already long. We will also have a good short term trade entry point as it will be the start of an Intermediate degree 3rd wave!. Patience.
Thanks Rodney.
Yes, the structure of cycle V is still incomplete. Primary 3 has still not moved far enough above the end of primary 1 to allow room for primary 4 to unfold.
The bull market shows no signs yet of being over.
Which means corrections are an opportunity.