
Another test of support today saw price bounce again.
The AD line today sends a strong indication of what to expect tomorrow; this supports the Elliott wave count.
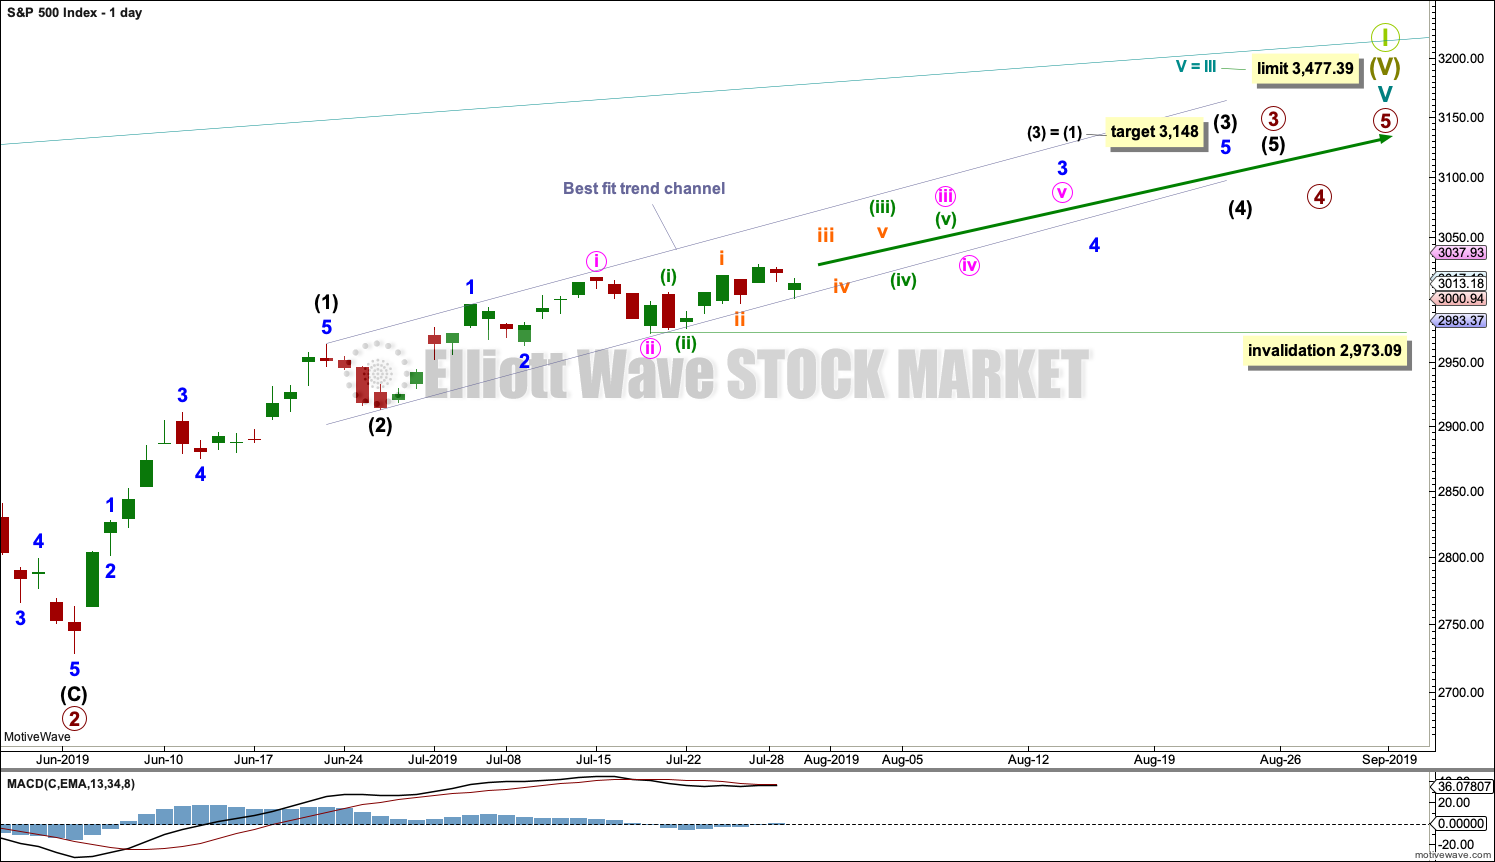
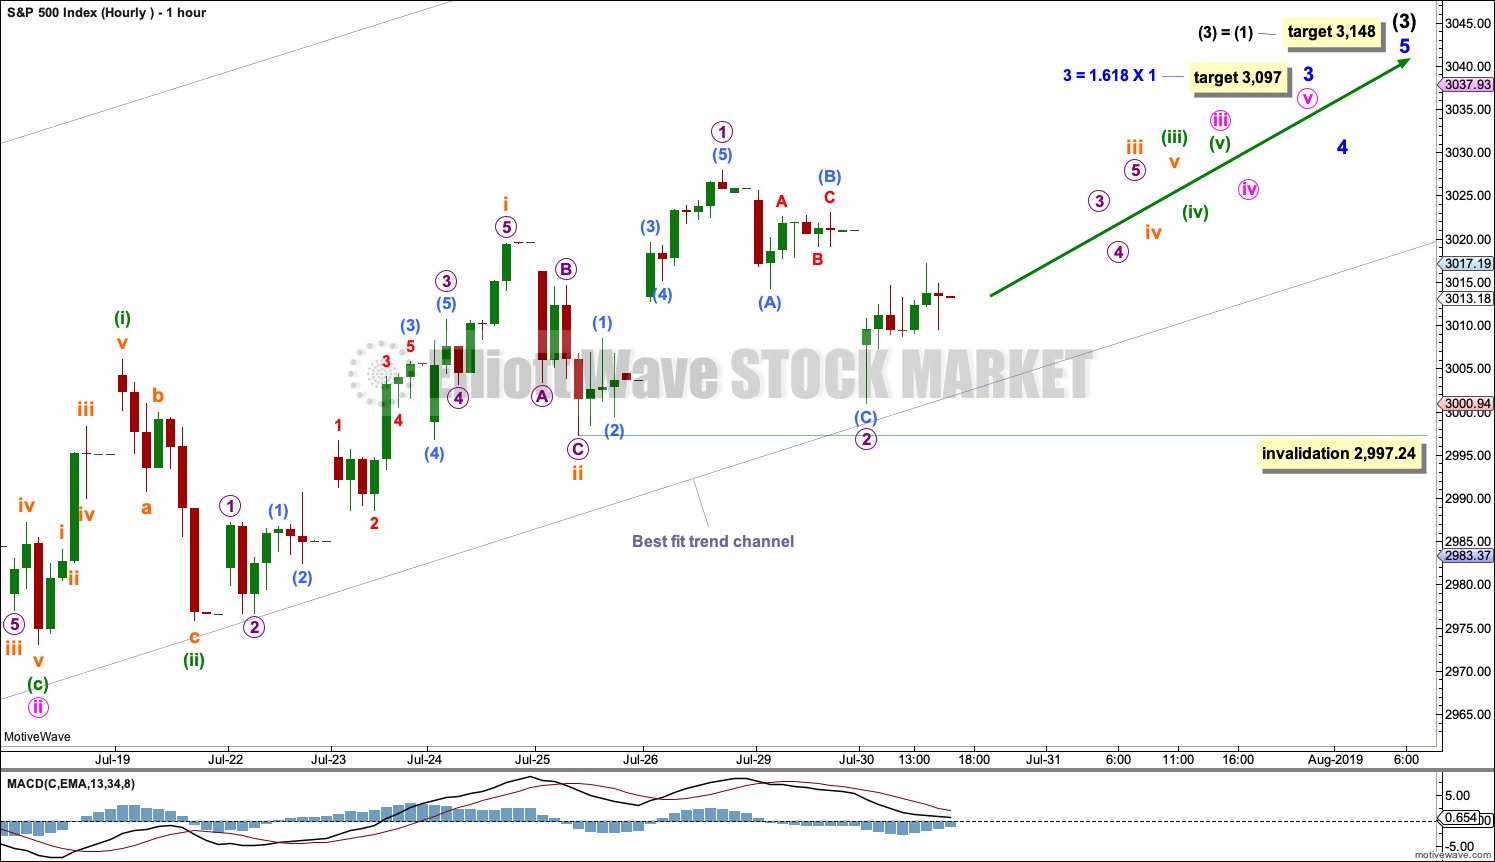
Summary: A short-term target for the middle of a third wave to end is now at 3,097. A mid-term target for a third wave at intermediate degree is at 3,148.
Use the best fit trend channel as a guide to where pullbacks may find support along the way up.
The biggest picture, Grand Super Cycle analysis, is here.
Monthly charts were last published here, with video here. There are two further alternate monthly charts here, with video here.
ELLIOTT WAVE COUNTS
The two weekly Elliott wave counts below will be labelled First and Second. They may be about of even probability. When the fifth wave currently unfolding on weekly charts may be complete, then these two wave counts will diverge on the severity of the expected following bear market. To see an illustration of this future divergence monthly charts should be viewed.
FIRST WAVE COUNT
WEEKLY CHART
Click chart to enlarge.
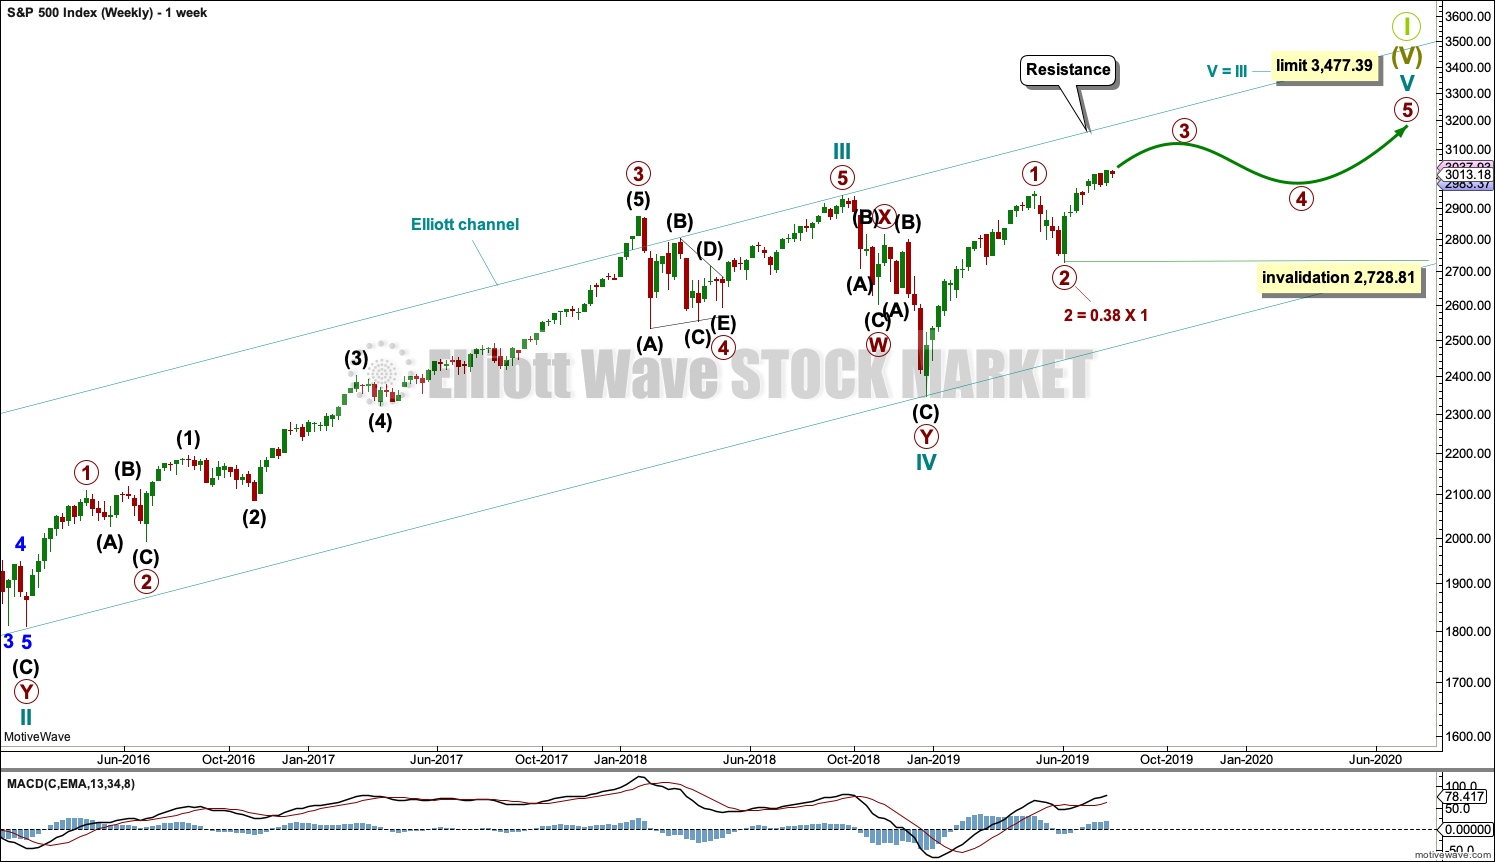
The basic Elliott wave structure consists of a five wave structure up followed by a three wave structure down (for a bull market). This wave count sees the bull market beginning in March 2009 as an incomplete five wave impulse and now within the last fifth wave, which is labelled cycle wave V. This impulse is best viewed on monthly charts. The weekly chart focusses on the end of it.
Elliott wave is fractal. This fifth wave labelled cycle wave V may end a larger fifth wave labelled Super Cycle wave (V), which may end a larger first wave labelled Grand Super Cycle wave I.
The teal Elliott channel is drawn using Elliott’s first technique about the impulse of Super Cycle wave (V). Draw the first trend line from the end of cycle wave I (off to the left of the chart, the weekly candlestick beginning 30th November 2014) to the end of cycle wave III, then place a parallel copy on the end of cycle wave II. This channel perfectly shows where cycle wave IV ended at support. The strongest portion of cycle wave III, the end of primary wave 3, overshoots the upper edge of the channel. This is a typical look for a third wave and suggests the channel is drawn correctly and the way the impulse is counted is correct.
Within Super Cycle wave (V), cycle wave III is shorter than cycle wave I. A core Elliott wave rule states that a third wave may never be the shortest. For this rule to be met in this instance, cycle wave V may not be longer in length than cycle wave III. This limit is at 3,477.39.
Within cycle wave V, primary waves 1 and 2 may now be complete. Within primary wave 3, no second wave correction may move beyond its start below 2,728.81.
Cycle wave V may subdivide either as an impulse or an ending diagonal. Impulses are much more common. Ending diagonals normally have second and fourth waves that are deep; the common depth is from 0.66 to 0.81 the prior wave. So far a correction within cycle wave V has not been deeper than 0.5, so a diagonal at this stage looks very unlikely (but remains possible).
In historic analysis, two further monthly charts have been published that do not have a limit to upwards movement and are more bullish than this wave count. Members are encouraged to consider those possibilities (links below summary) alongside the wave counts presented on a daily and weekly basis.
The daily chart below will now focus on price movement from the low of primary wave 2.
DAILY CHART
Click chart to enlarge.
Cycle wave V must subdivide as a five wave motive structure. Within that five wave structure, primary waves 1 and 2 may be complete.
Primary wave 3 must move above the end of primary wave 1 (this rule has now been met). Primary wave 3 may only subdivide as an impulse.
This wave count now sees a series of six first and second waves complete: primary, intermediate, minor, minute, minuette and subminuette. The middle of a third wave up may be underway. It may be expected to exhibit some increase in momentum, and it may have support from volume.
Within minute wave iii, no second wave correction may move beyond the start of its first wave below 2,973.09.
HOURLY CHART
Click chart to enlarge.
This wave count now sees a series of seven first and second waves complete. This wave count now expects further strength in upwards movement.
The last pullbacks labelled minute wave ii, minuette wave (ii) and now the low today for micro wave 2 have all found support about the lower edge of the best fit channel. This trend line may continue to show support.
Subminuette wave iii needs to move far enough above the end of subminuette wave i to allow room for subminuette wave iv to unfold and remain above subminuette wave i price territory.
If it continues any lower, then micro wave 2 may not move beyond the start of micro wave 1 below 2,997.24.
SECOND WAVE COUNT
WEEKLY CHART
Click chart to enlarge.
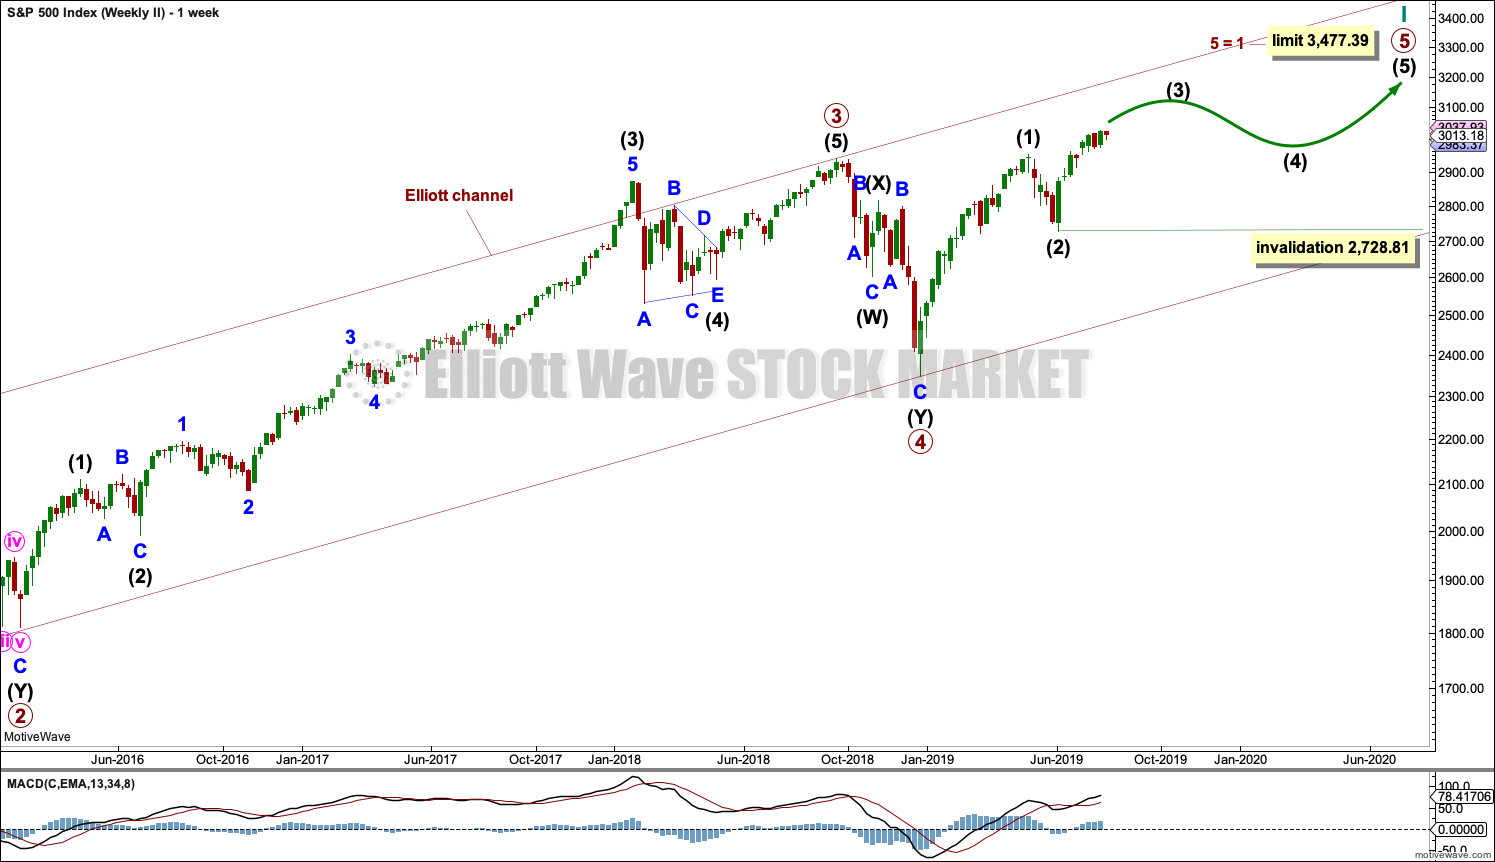
This weekly chart is almost identical to the first weekly chart, with the sole exception being the degree of labelling.
This weekly chart moves the degree of labelling for the impulse beginning in March 2009 all down one degree. This difference is best viewed on monthly charts.
The impulse is still viewed as nearing an end; a fifth wave is still seen as needing to complete higher. This wave count labels it primary wave 5.
TECHNICAL ANALYSIS
WEEKLY CHART
Click chart to enlarge. Chart courtesy of StockCharts.com.
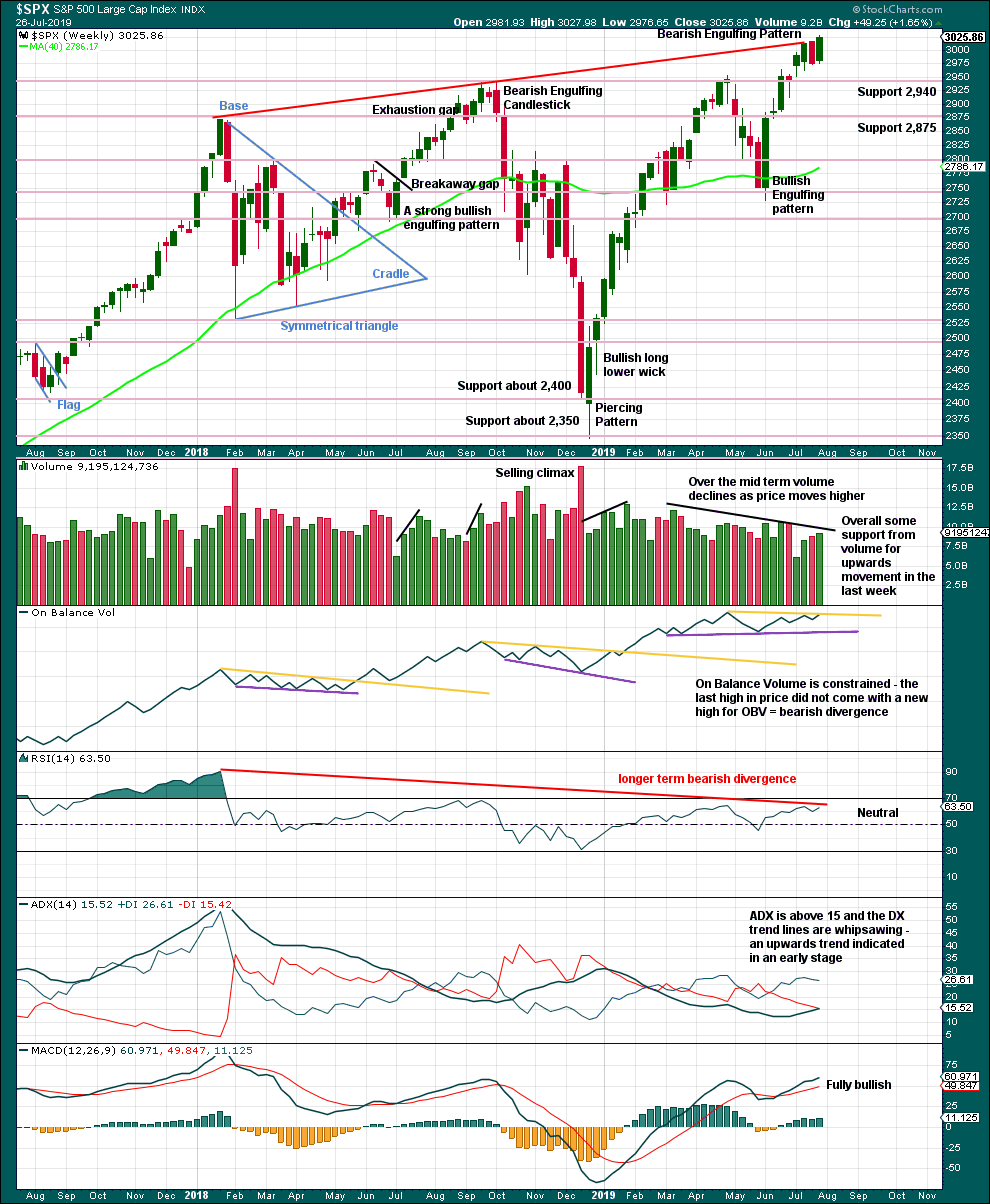
Last week volume offers some support to upwards movement, although the longer-term trend of declining volume with rising price persists.
Bearish divergence between price and On Balance Volume is too slight to be given much weight in this analysis. Sometimes this can just disappear, particularly when it is very weak.
Longer-term bearish divergence between price and RSI may develop further before a larger downwards trend begins to resolve it.
The strongest signal ADX can give is when it rises up from low levels and below both directional lines to 15 or above. Last week ADX gives a strong signal for an upwards trend, which may be in its relatively early stages.
DAILY CHART
Click chart to enlarge. Chart courtesy of StockCharts.com.
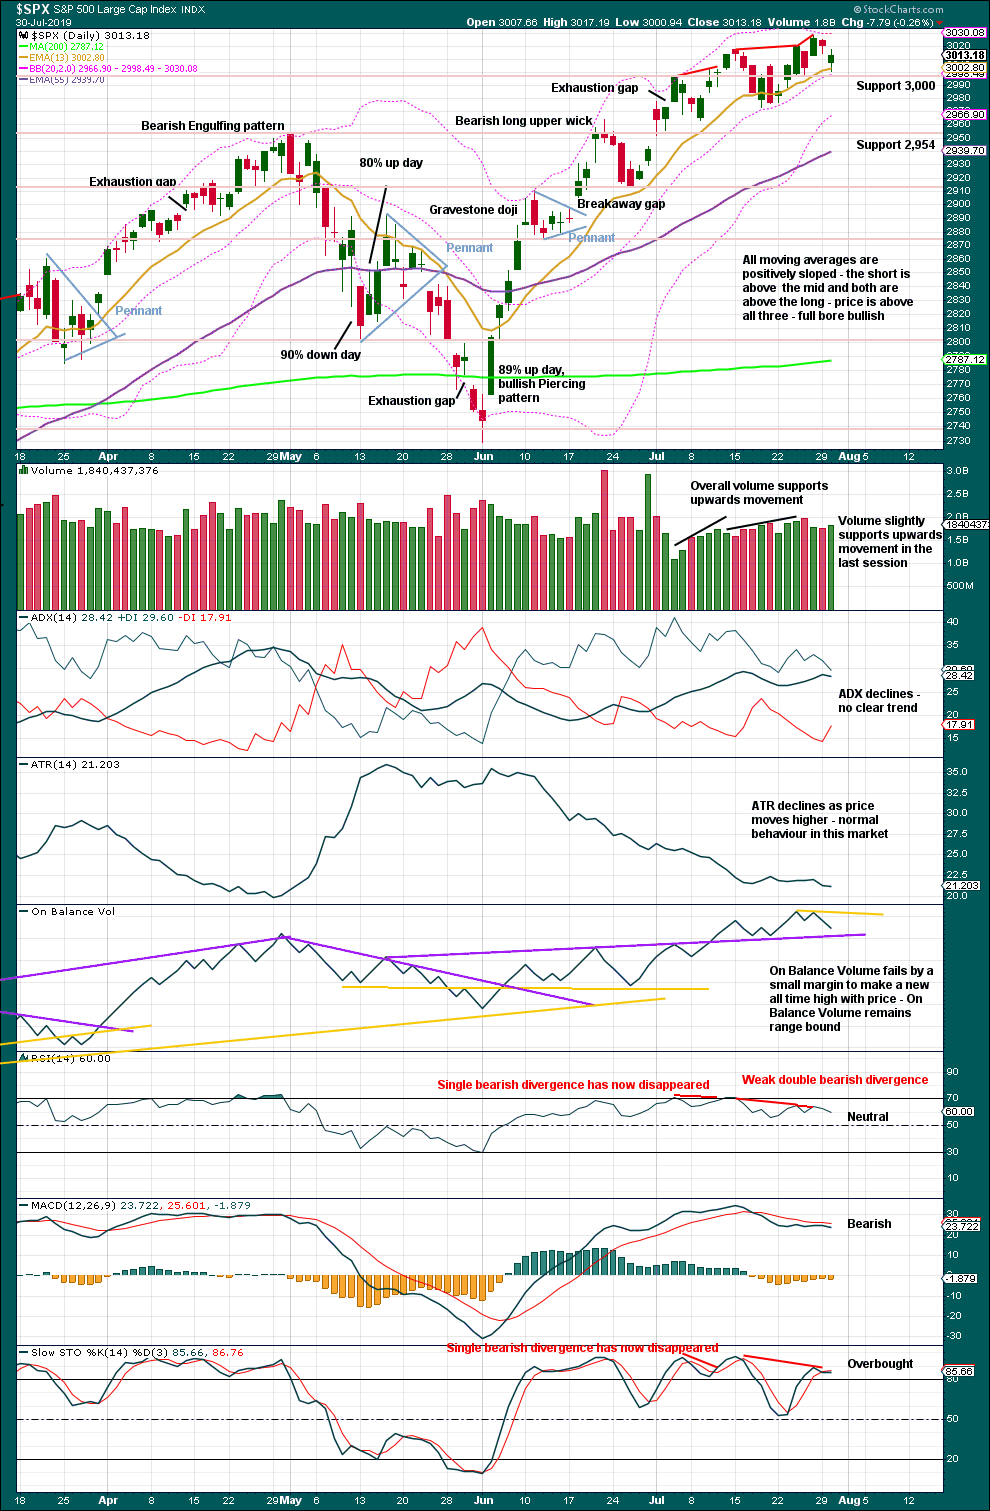
Support about 3,000 has again been tested today and has held. It may continue to do so.
The support and resistance line added yesterday to On Balance Volume was breached again today. At that stage, it was too weak for technical significance and was removed. On Balance Volume is restrained. A breakout may offer a signal.
A little support today from volume is bullish.
BREADTH – AD LINE
WEEKLY CHART
Click chart to enlarge. Chart courtesy of StockCharts.com. So that colour blind members are included, bearish signals
will be noted with blue and bullish signals with yellow.
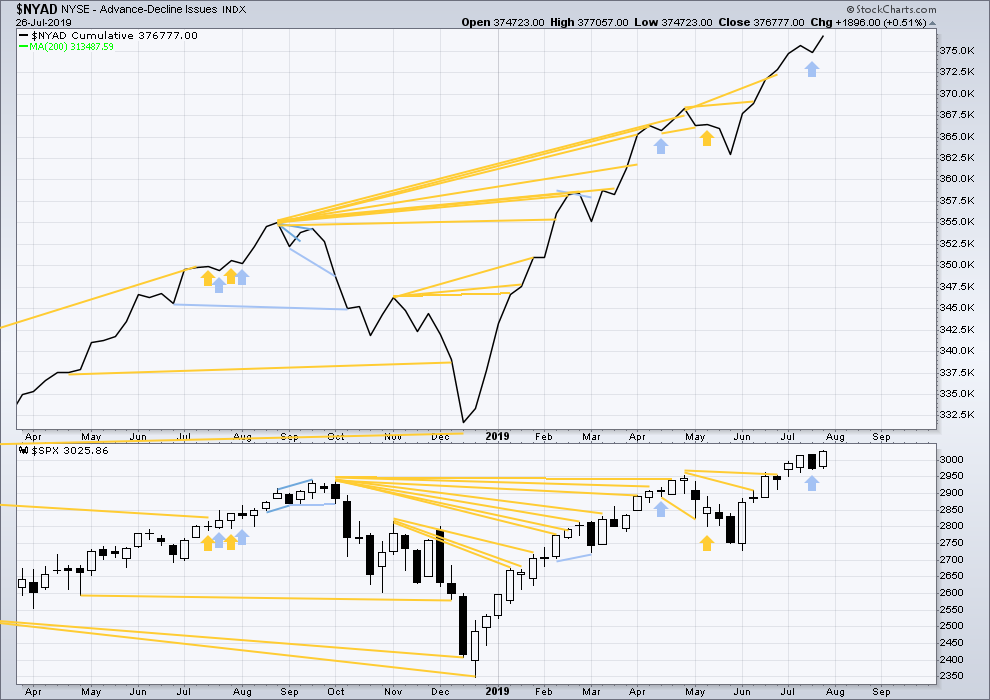
Bear markets from the Great Depression and onwards have been preceded by an average minimum of 4 months divergence between price and the AD line with only two exceptions in 1946 and 1976. With the AD line making new all time highs again this week, the end of this bull market and the start of a new bear market is very likely a minimum of 4 months away, which is mid November 2019.
In all bear markets in the last 90 years there is some positive correlation (0.6022) between the length of bearish divergence and the depth of the following bear market. No to little divergence is correlated with more shallow bear markets. Longer divergence is correlated with deeper bear markets.
If a bear market does develop here, it comes after no bearish divergence. It would therefore more likely be shallow.
Last week both price and the AD line make new all time highs on the weekly chart. There is no divergence.
Mid caps have now made a new all time high last week, but small caps remain below their all time high of 25th February 2019. Weakness is now predominantly in small caps. This is normal behaviour during the later stages of a bull market, and may be expected to develop further before the bull market may end. Tops are a process and that process may last months to even years.
DAILY CHART
Click chart to enlarge. Chart courtesy of StockCharts.com. So that colour blind members are included, bearish signals
will be noted with blue and bullish signals with yellow.
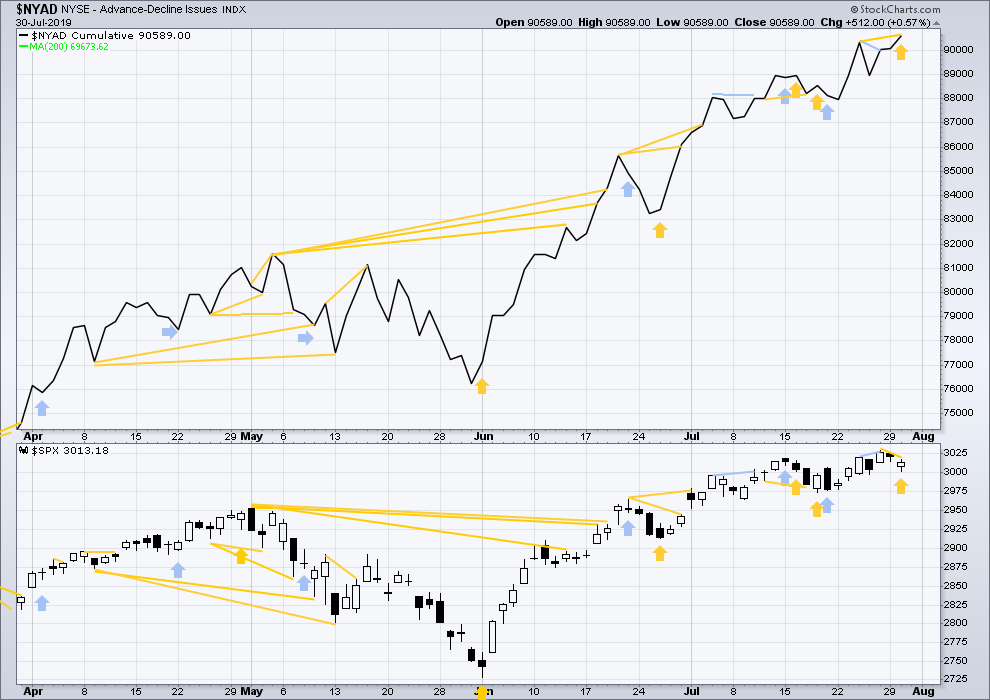
Breadth should be read as a leading indicator.
Bearish divergence between the AD line and price for the short term noted in last analysis has now been followed by some downwards movement. It may be resolved here.
Today price has moved lower, but the AD line has moved higher. There is single day bullish divergence. The AD line has today made a new all time high, but price has not; this divergence is bullish. This supports the Elliott wave count.
VOLATILITY – INVERTED VIX CHART
WEEKLY CHART
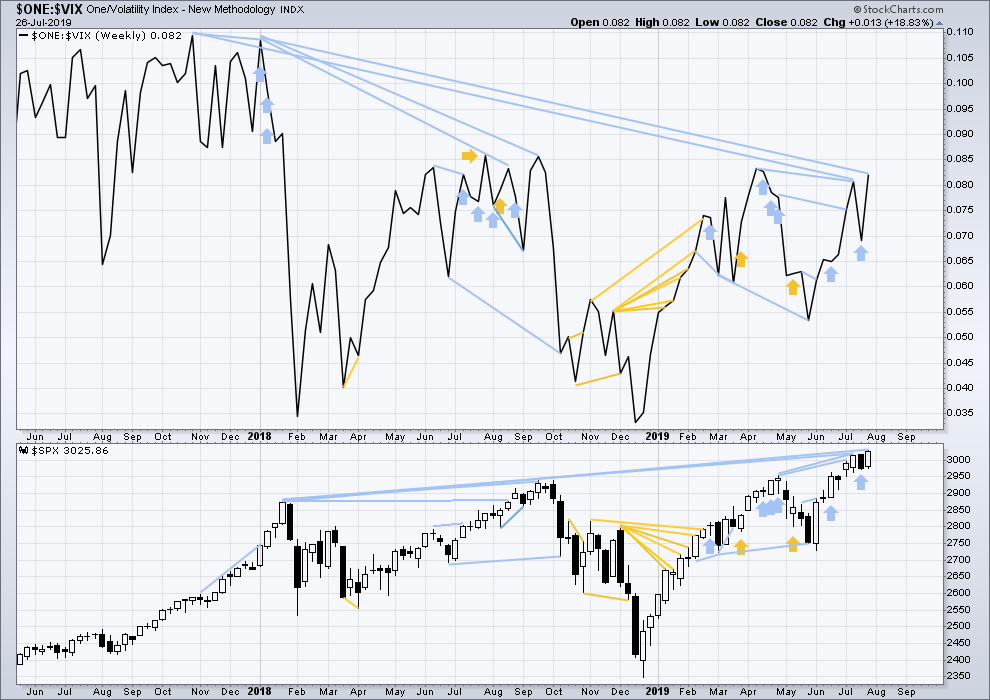
Click chart to enlarge. Chart courtesy of StockCharts.com. So that colour blind members are included, bearish signals
will be noted with blue and bullish signals with yellow.
The all time high for inverted VIX (which is the same as the low for VIX) was on 30th October 2017. There is now nearly one year and eight months of bearish divergence between price and inverted VIX.
The rise in price is not coming with a normal corresponding decline in VIX; VIX remains elevated. This long-term divergence is bearish and may yet develop further as the bull market matures.
This divergence may be an early warning, a part of the process of a top developing that may take years. It may not be useful in timing a trend change.
Last week price has made a new all time high, but inverted VIX still exhibits longer-term bearish divergence. For the short term, there is no divergence between price and inverted VIX for the last swing high two weeks ago.
DAILY CHART
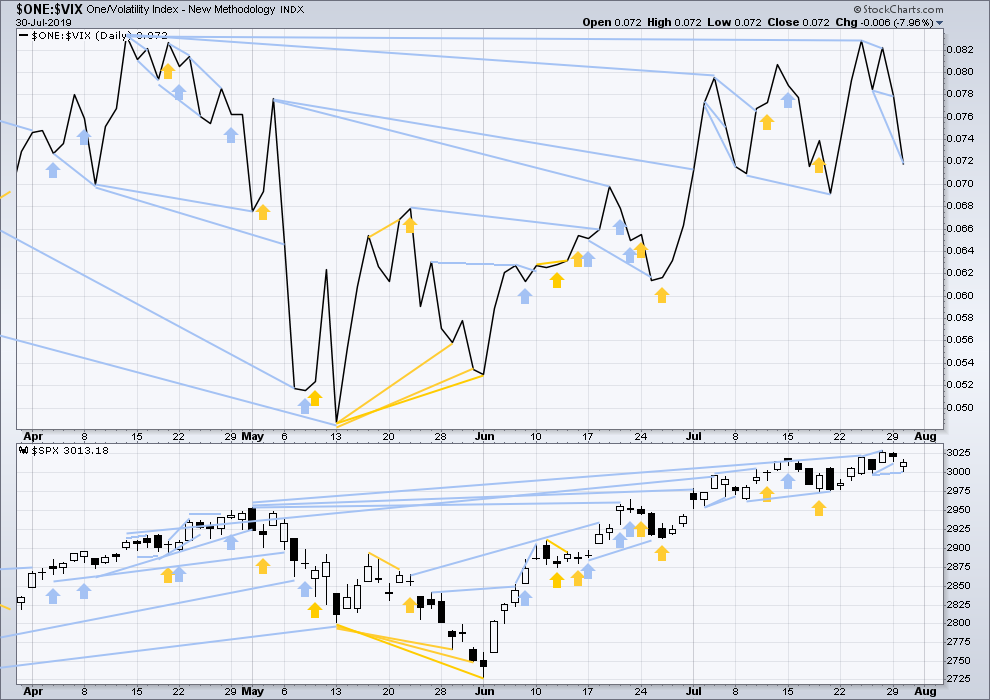
Click chart to enlarge. Chart courtesy of StockCharts.com. So that colour blind members are included, bearish signals
will be noted with blue and bullish signals with yellow.
Bearish divergence noted has been followed by some downwards movement. It may be resolved here.
Today price has moved lower as has inverted VIX. Inverted VIX has made a new low below the low three sessions prior, but price has not. This divergence is bearish for the short term but is given no weight in this analysis today because it is contradicted by the AD line.
DOW THEORY
Dow Theory confirmed a bear market in December 2018. This does not necessarily mean a bear market at Grand Super Cycle degree though; Dow Theory makes no comment on Elliott wave counts. On the 25th of August 2015 Dow Theory also confirmed a bear market. The Elliott wave count sees that as part of cycle wave II. After Dow Theory confirmation of a bear market in August 2015, price went on to make new all time highs and the bull market continued.
DJIA: 23,344.52 – a close on the 19th of December at 23,284.97 confirms a bear market.
DJT: 9,806.79 – price has closed below this point on the 13th of December.
S&P500: 2,532.69 – a close on the 19th of December at 2,506.96 provides support to a bear market conclusion.
Nasdaq: 6,630.67 – a close on the 19th of December at 6,618.86 provides support to a bear market conclusion.
With all the indices having moved higher following a Dow Theory bear market confirmation, Dow Theory would confirm a bull market if the following highs are made:
DJIA: 26,951.81 – a close above this point has been made on the 3rd of July 2019.
DJT: 11,623.58 – to date DJT has failed to confirm an ongoing bull market.
S&P500: 2,940.91 – a close above this point was made on the 29th of April 2019.
Nasdaq: 8,133.30 – a close above this point was made on the 26th of April 2019.
Published @ 09:39 p.m. EST.
—
Careful risk management protects your trading account(s).
Follow my two Golden Rules:
1. Always trade with stops.
2. Risk only 1-5% of equity on any one trade.
—
New updates to this analysis are in bold.
Daily chart updated:
Because the trend channel which contained all movement from the low on 3rd June is now strongly breached, this looks like a new wave. The wave up from 3rd June to 26th July looks like one wave, this downwards movement looks like a correction for it.
I’ll still expect this correction to be relatively shallow, that’s been the pattern for a fair time now for the S&P. The 0.382 Fibonacci ratio may be favoured.
If price falls through that, the 0.618 Fibonacci ratio may then be considered.
I’m going to label the upwards wave intermediate (1) and this downwards wave intermediate (2). It will most likely be a zigzag.
Hourly chart for the new daily chart above:
Intermediate (2) would most likely be a zigzag. Minor A may be a leading expanding diagonal
If minor A is a five, then minor B may not move beyond its start
As a “what if” I’ve charted the possibility of minor A being a three. If that’s the case, then minor B must also be a three.
The problem then becomes that minor B is way more than the normal maximum range of up to 2X minor A. This looks wrong.
I may not publish this in next analysis, but I want to put it here so you know I’m considering different possibilities for intermediate (2) and why I may discard this one at this time.
This was my try…
Works if you call the top of [i] as 2958.06. Otherwise you get overlap between [i] and [iv].
Even then the 4 looks too big for the 2.
If 4 ended at 2973.09 then 5 and (1) at 3027.98 it would have the right “look”
I have a bad feeling about this Fed announcement, given the price action for the last few days. Hope I’m wrong…
Put on a broken wing ‘fly on IWM for Aug 16 yesterday.
Check my website for other stock set ups I’m seeing, multiple updates a day. specktrading dot com.
Lara with the number of first and second waves getting higher and higher, I’m wondering, despite the truncation, whether minute ii ended at 2975.86 rather than 2973.09.
I have a new wave count 🙁
first boom!