
An upwards day fits both Elliott wave counts. Price remains below the invalidation / confidence point.
Summary: A deeper and more time consuming correction may reach to 2,839 or below. This has support from some bearish divergence between price and all of the AD line, VIX and On Balance Volume, and a Bearish Engulfing candlestick pattern on the weekly chart.
A bullish Elliott wave count remains valid while price remains above 2,963.44. A new high above 3,017.80 would invalidate the bearish wave count and add confidence to the bullish wave count. For this count, a short-term target for the middle of a third wave to end is now at 3,097. A mid-term target for a third wave at intermediate degree is at 3,148.
The biggest picture, Grand Super Cycle analysis, is here.
Monthly charts were last published here, with video here. There are two further alternate monthly charts here, with video here.
ELLIOTT WAVE COUNTS
The two weekly Elliott wave counts below will be labelled First and Second. They may be about of even probability. When the fifth wave currently unfolding on weekly charts may be complete, then these two wave counts will diverge on the severity of the expected following bear market. To see an illustration of this future divergence monthly charts should be viewed.
FIRST WAVE COUNT
WEEKLY CHART
Click chart to enlarge.
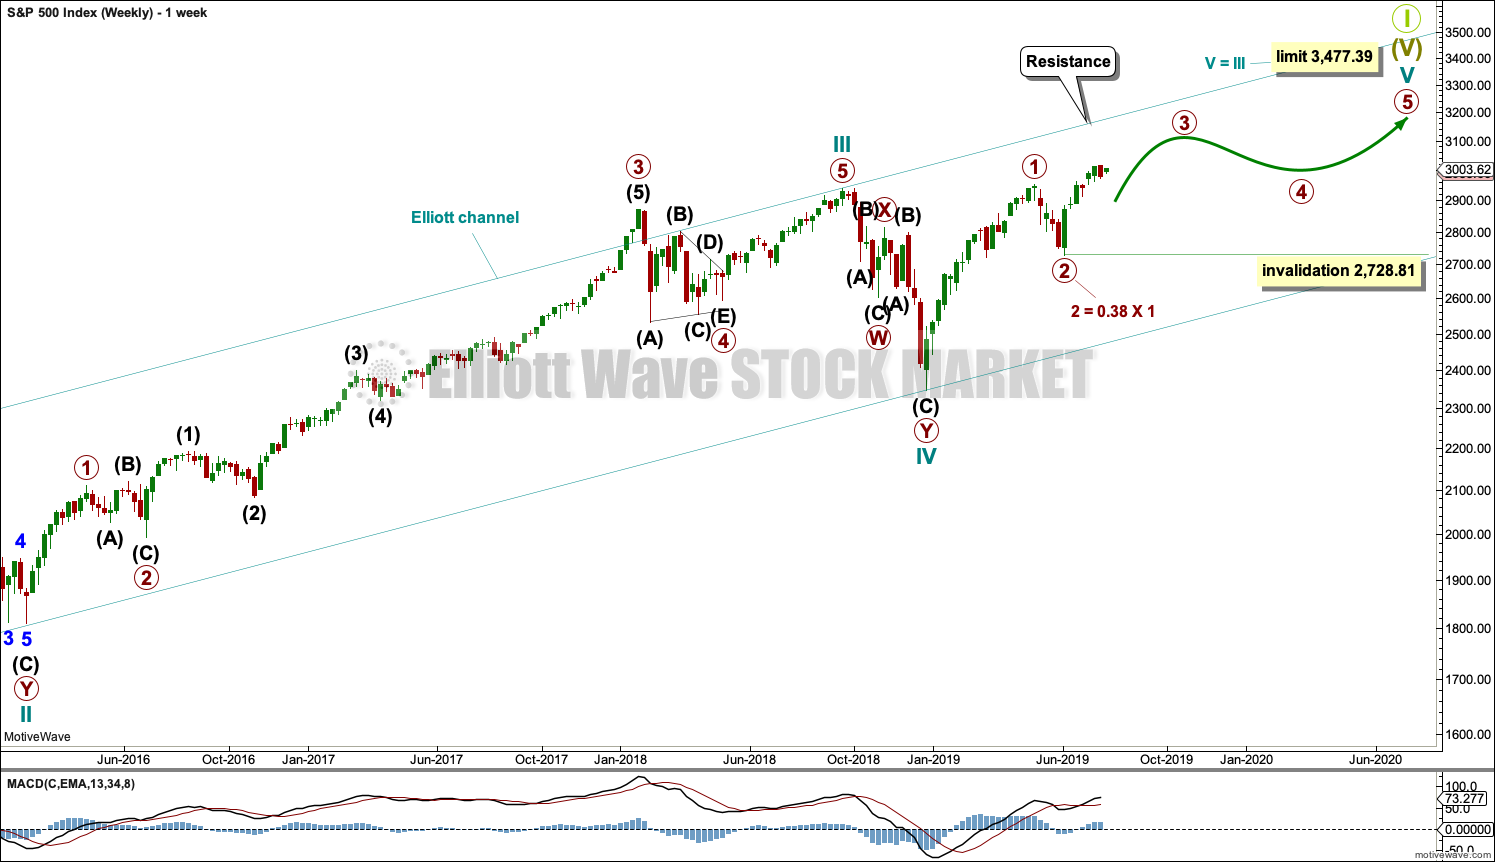
The basic Elliott wave structure consists of a five wave structure up followed by a three wave structure down (for a bull market). This wave count sees the bull market beginning in March 2009 as an incomplete five wave impulse and now within the last fifth wave, which is labelled cycle wave V. This impulse is best viewed on monthly charts. The weekly chart focusses on the end of it.
Elliott wave is fractal. This fifth wave labelled cycle wave V may end a larger fifth wave labelled Super Cycle wave (V), which may end a larger first wave labelled Grand Super Cycle wave I.
The teal Elliott channel is drawn using Elliott’s first technique about the impulse of Super Cycle wave (V). Draw the first trend line from the end of cycle wave I (off to the left of the chart, the weekly candlestick beginning 30th November 2014) to the end of cycle wave III, then place a parallel copy on the end of cycle wave II. This channel perfectly shows where cycle wave IV ended at support. The strongest portion of cycle wave III, the end of primary wave 3, overshoots the upper edge of the channel. This is a typical look for a third wave and suggests the channel is drawn correctly and the way the impulse is counted is correct.
Within Super Cycle wave (V), cycle wave III is shorter than cycle wave I. A core Elliott wave rule states that a third wave may never be the shortest. For this rule to be met in this instance, cycle wave V may not be longer in length than cycle wave III. This limit is at 3,477.39.
Within cycle wave V, primary waves 1 and 2 may now be complete. Within primary wave 3, no second wave correction may move beyond its start below 2,728.81.
Cycle wave V may subdivide either as an impulse or an ending diagonal. Impulses are much more common. Ending diagonals normally have second and fourth waves that are deep; the common depth is from 0.66 to 0.81 the prior wave. So far a correction within cycle wave V has not been deeper than 0.5, so a diagonal at this stage looks very unlikely (but remains possible).
In historic analysis, two further monthly charts have been published that do not have a limit to upwards movement and are more bullish than this wave count. Members are encouraged to consider those possibilities (links below summary) alongside the wave counts presented on a daily and weekly basis.
Daily charts below will now focus on price movement from the low of primary wave 2.
DAILY CHART
Click chart to enlarge.
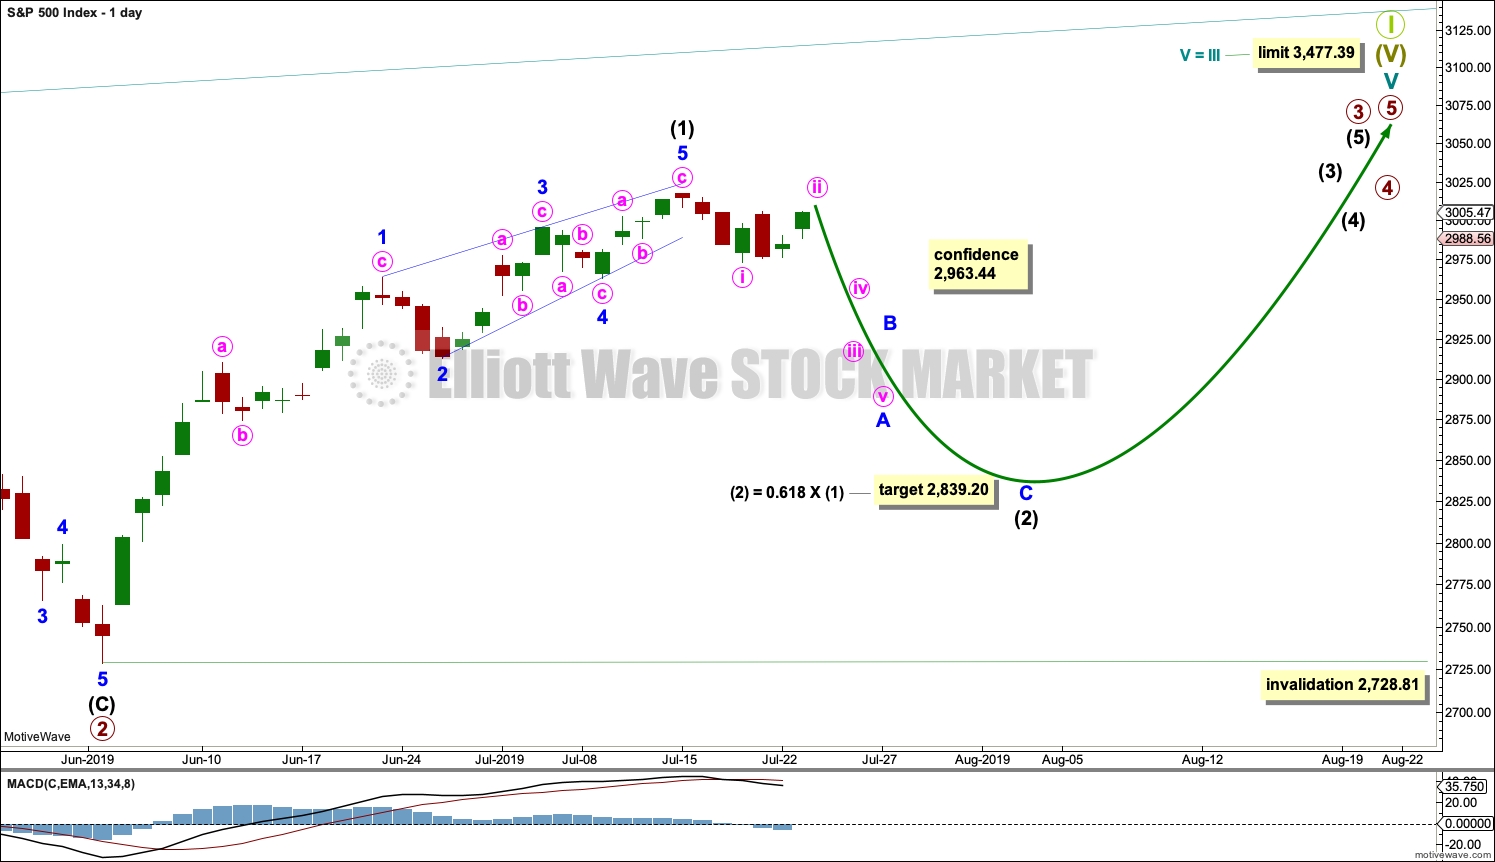
Cycle wave V must subdivide as a five wave motive structure. Within that five wave structure, primary waves 1 and 2 may be complete.
Primary wave 3 must move above the end of primary wave 1 (this rule has now been met). Primary wave 3 may only subdivide as an impulse.
Within the impulse of primary wave 3, intermediate wave (1) may be complete.
It is possible that intermediate wave (1) was over at the last high as a leading contracting diagonal. Within the diagonal, all sub-waves appear to be zigzags, as they most commonly are within leading diagonals. Minor wave 4 overlaps minor wave 1 price territory, as it must within a diagonal. The trend lines converge. This structure meets all Elliott wave rules.
Second wave corrections following leading diagonals in first wave positions are commonly very deep. Intermediate wave (2) may be expected to reach down to the 0.618 Fibonacci ratio of intermediate wave (1) or below.
Intermediate wave (2) may not move beyond the start of intermediate wave (1) below 2,728.81.
Intermediate wave (2) may last a few weeks.
HOURLY CHART
Click chart to enlarge.
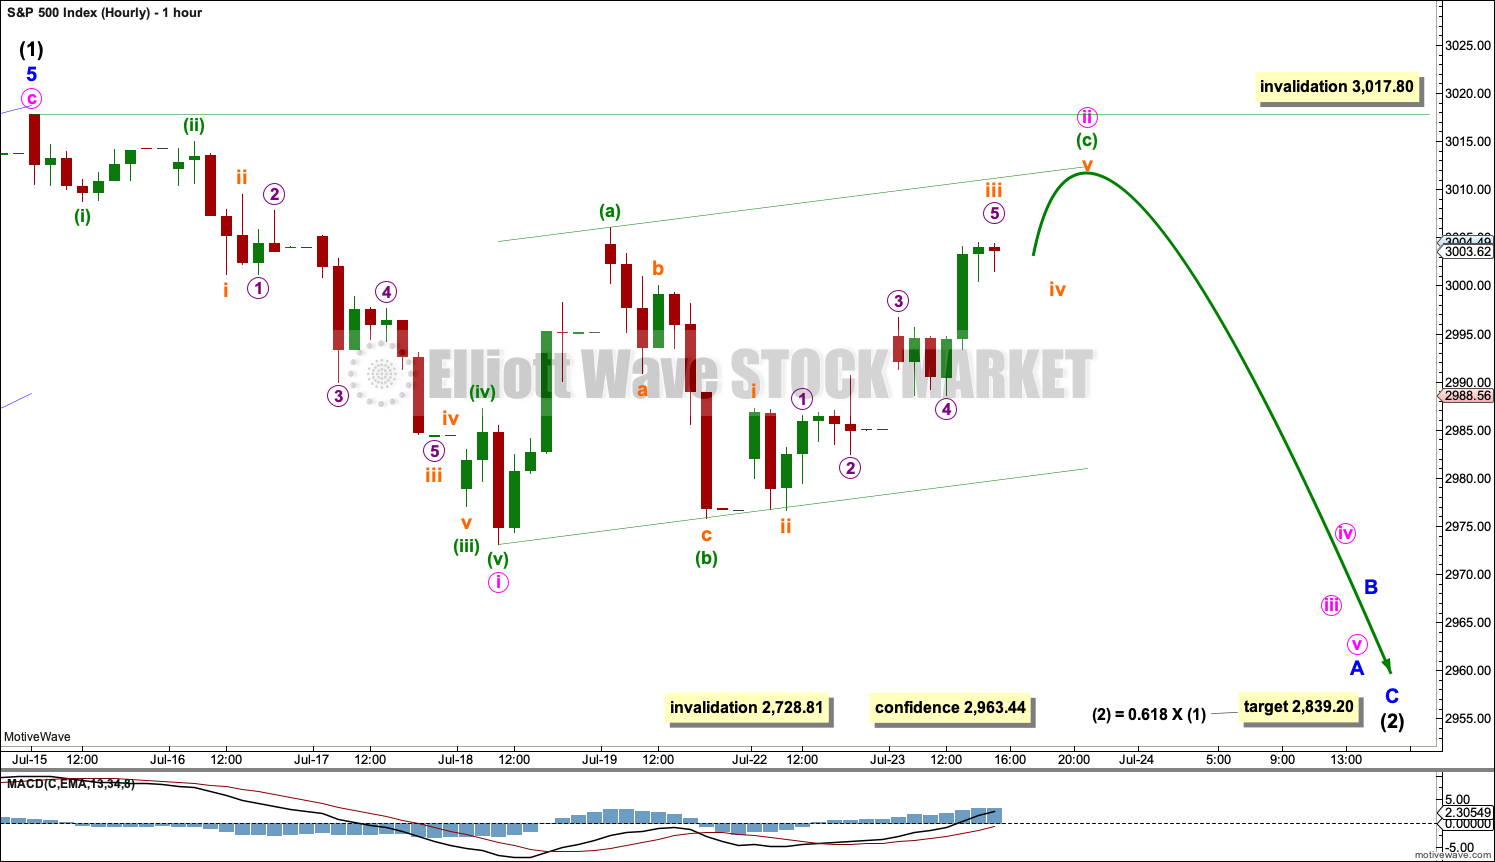
Intermediate wave (2) should be expected to be relatively time consuming and deep, and so minor wave A would most likely be incomplete.
Intermediate wave (2) would most likely subdivide as a zigzag, although it may be any Elliott wave corrective structure except a triangle. A zigzag subdivides 5-3-5.
Minor wave A would most likely subdivide as a five wave impulse. Within minor wave A, minute wave i only may be complete.
Minute wave ii may be unfolding as a relatively time consuming zigzag. Minuette wave (c) must complete as a five wave structure. The final fifth wave of subminuette wave v may move a little higher when markets open tomorrow. Minute wave ii may end at resistance at the upper edge of the green channel which contains it.
Minute wave ii may not move beyond the start of minute wave i above 3,017.80.
If this wave count is invalidated by a new high above 3,017.80 tomorrow, then it would be discarded in favour of the alternate below.
ALTERNATE DAILY CHART
Click chart to enlarge.
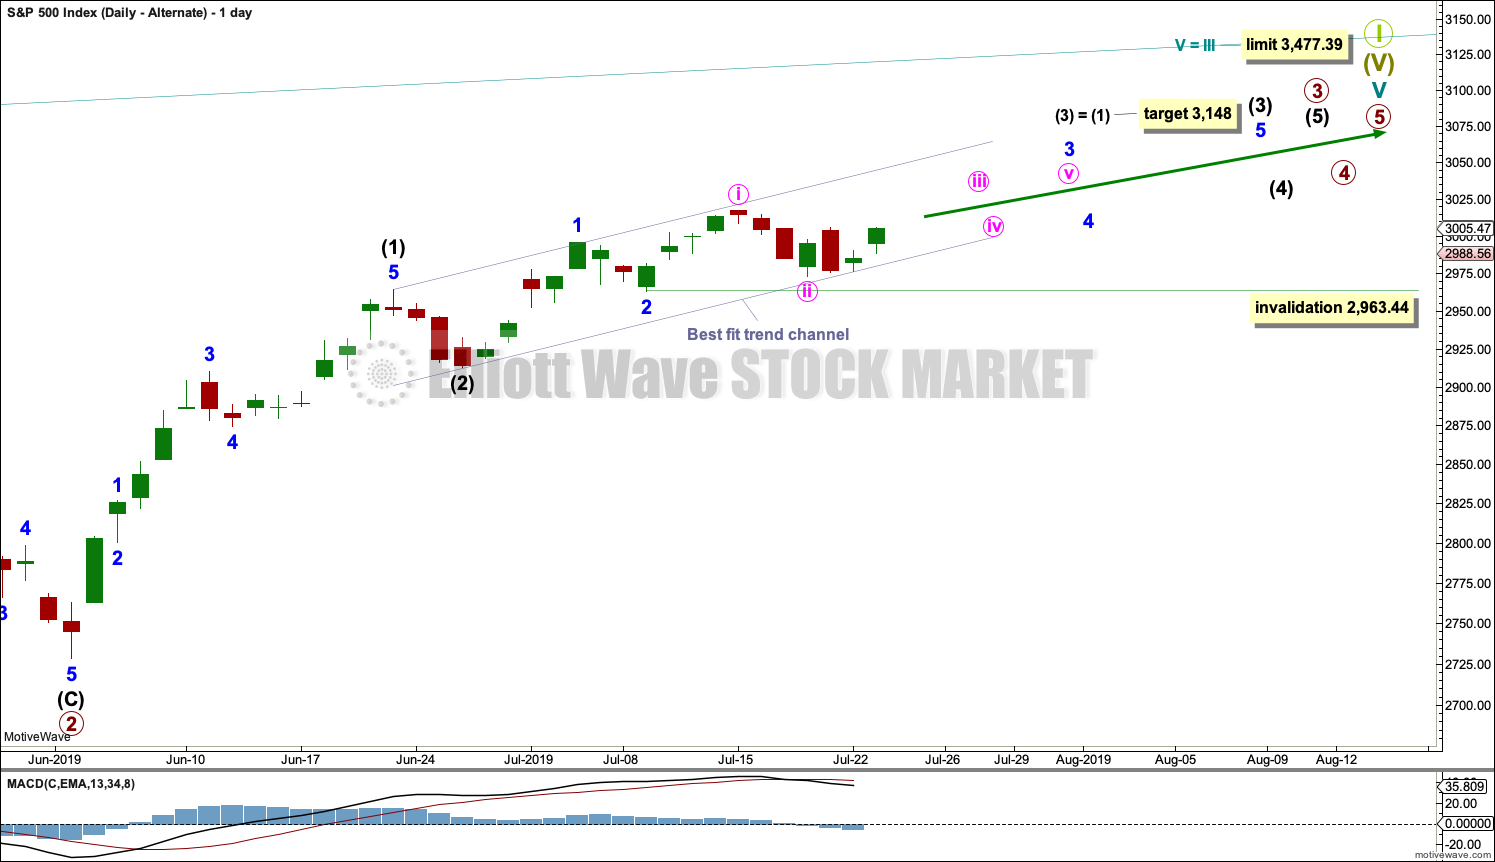
It remains possible that within primary wave 3 both intermediate waves (1) and (2) are complete. Within intermediate wave (3), both minor waves 1 and 2 may be complete. Within minor wave 3, minute wave ii should be over at the last low if it is to remain within the best fit channel.
Minute wave ii may not move beyond the start of minute wave i below 2,963.44.
ALTERNATE HOURLY CHART
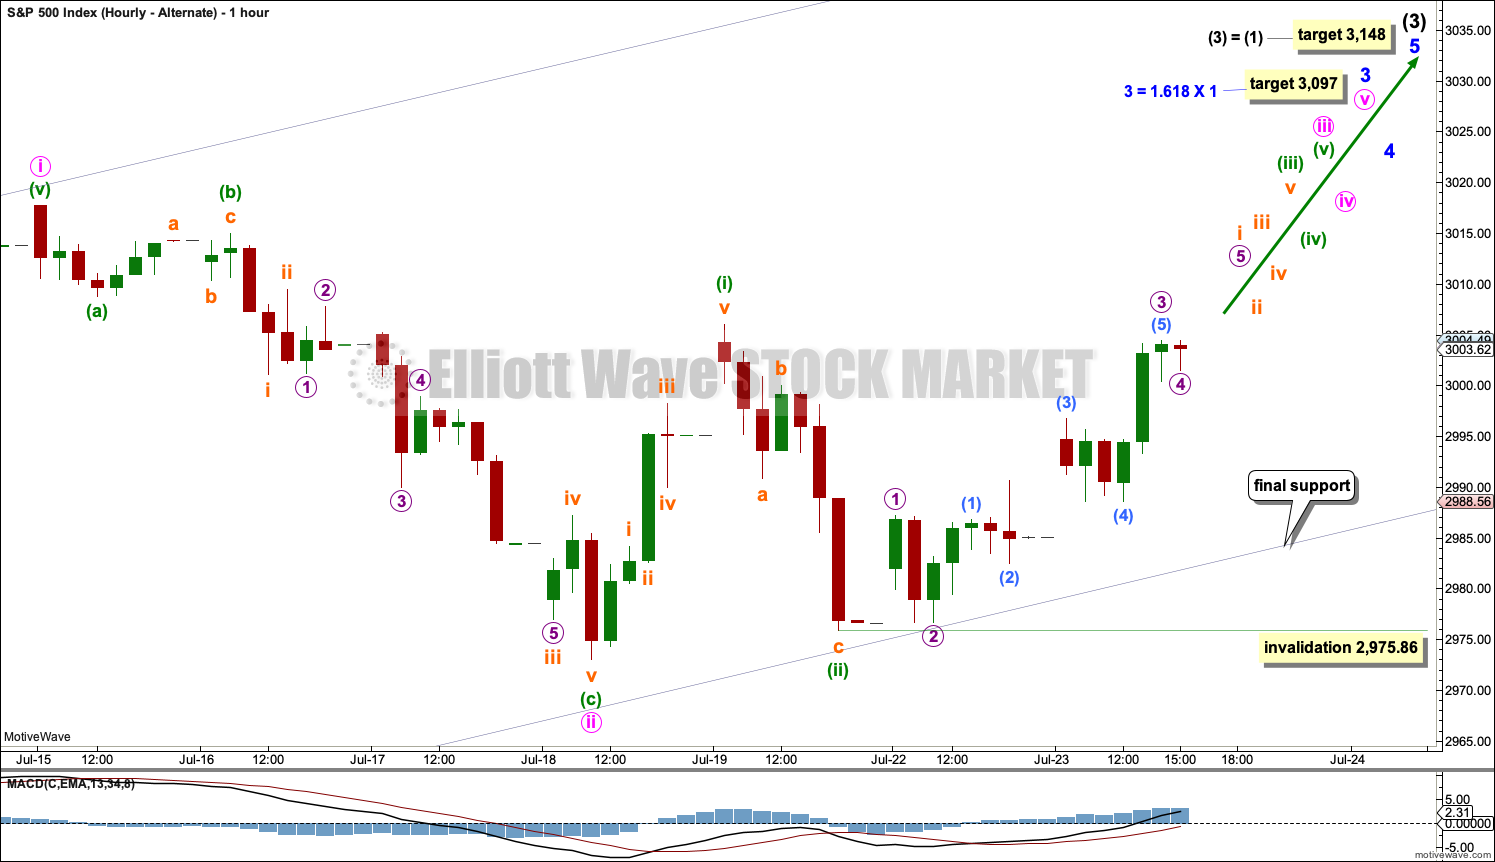
Click chart to enlarge.
This wave count now sees a series of five overlapping first and second waves complete. This wave count now expects explosive upwards movement this week.
A new all time high, which has some support from volume, would indicate this wave count should be correct. At that stage, targets may be used (calculated to expect common Fibonacci Ratios).
SECOND WAVE COUNT
WEEKLY CHART
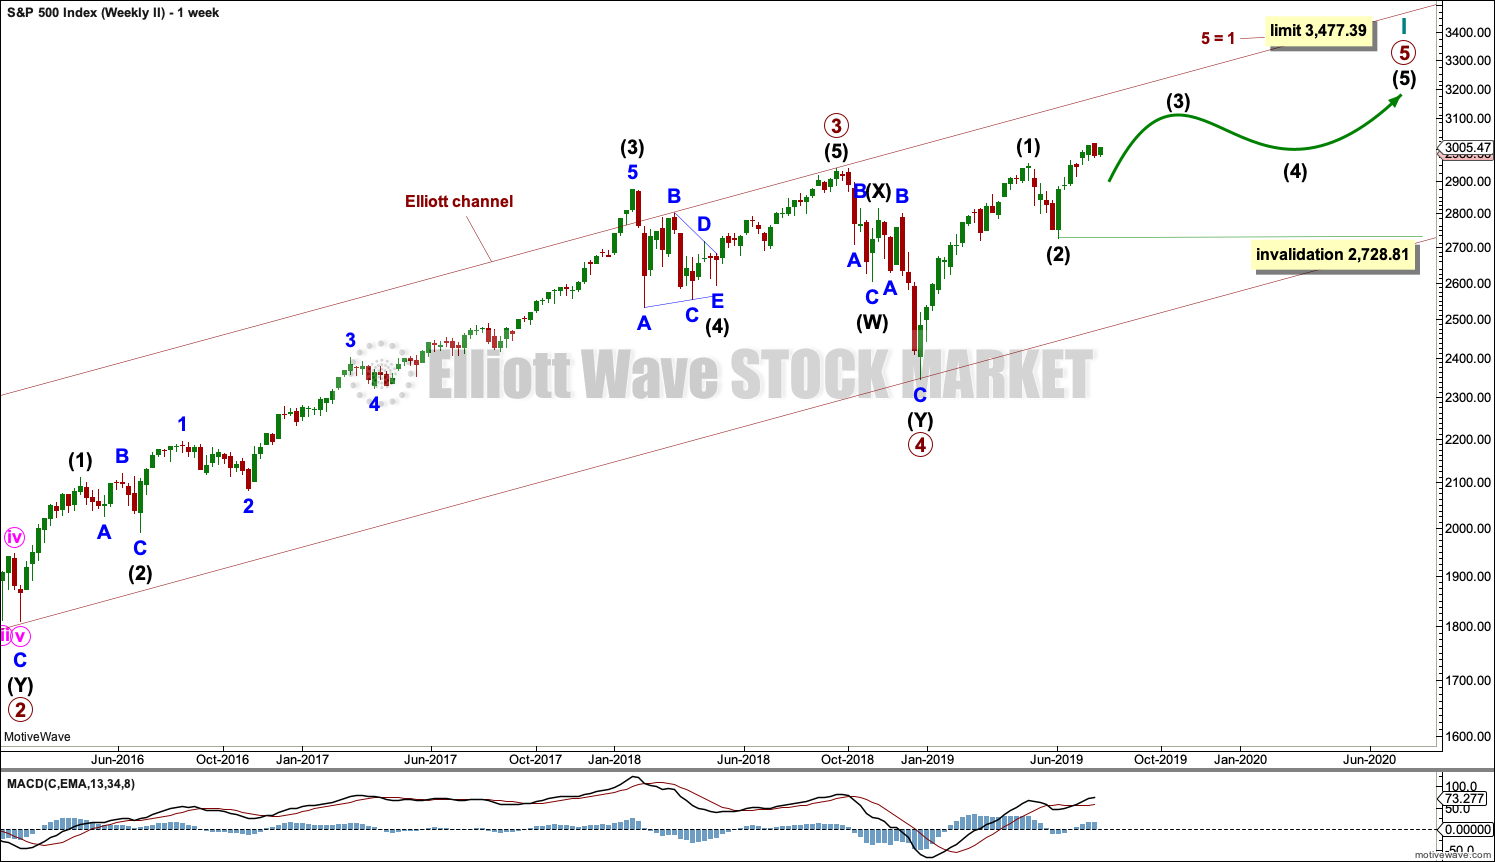
Click chart to enlarge.
This weekly chart is almost identical to the first weekly chart, with the sole exception being the degree of labelling.
This weekly chart moves the degree of labelling for the impulse beginning in March 2009 all down one degree. This difference is best viewed on monthly charts.
The impulse is still viewed as nearing an end; a fifth wave is still seen as needing to complete higher. This wave count labels it primary wave 5.
TECHNICAL ANALYSIS
WEEKLY CHART
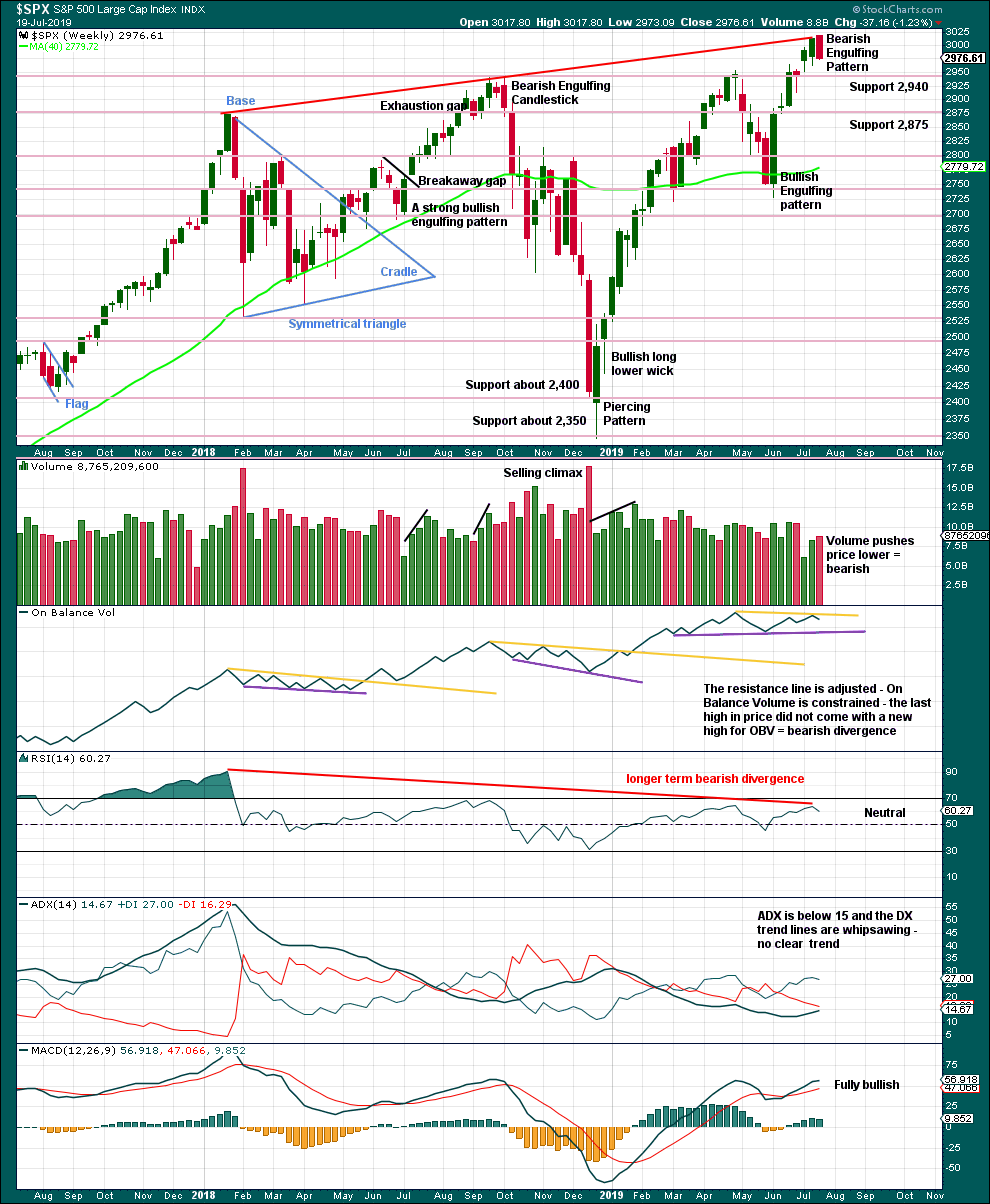
Click chart to enlarge. Chart courtesy of StockCharts.com.
Last week completes a strong Bearish Engulfing candlestick pattern. Coming after an upwards movement, this is a reversal pattern. It has support from volume; it is taken seriously in this analysis.
The red line illustrating bearish divergence is also a resistance line, which was perfectly met last week.
Longer-term bearish divergence between price and RSI fits the Elliott wave count: the most extreme reading from RSI corresponds with the end of a third wave, and now a fifth wave at cycle or primary degree exhibits some weakness compared to the third wave.
DAILY CHART
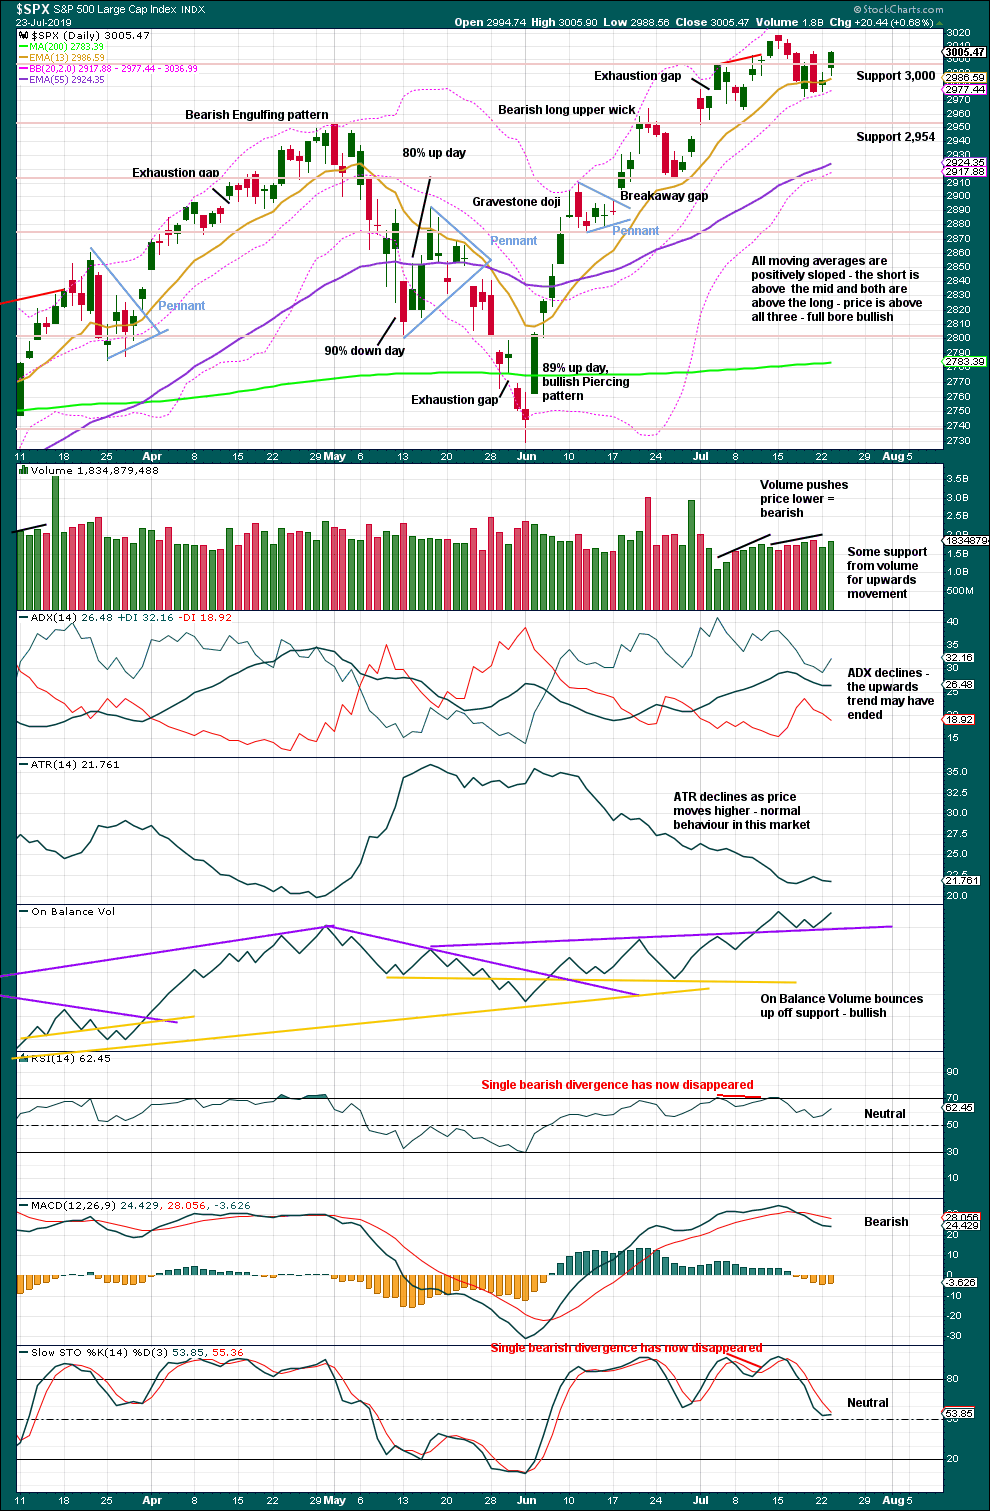
Click chart to enlarge. Chart courtesy of StockCharts.com.
A reasonably strong upwards day today has some support from volume. Price has closed near the high, which is bullish. This suggests more upwards movement tomorrow.
BREADTH – AD LINE
WEEKLY CHART
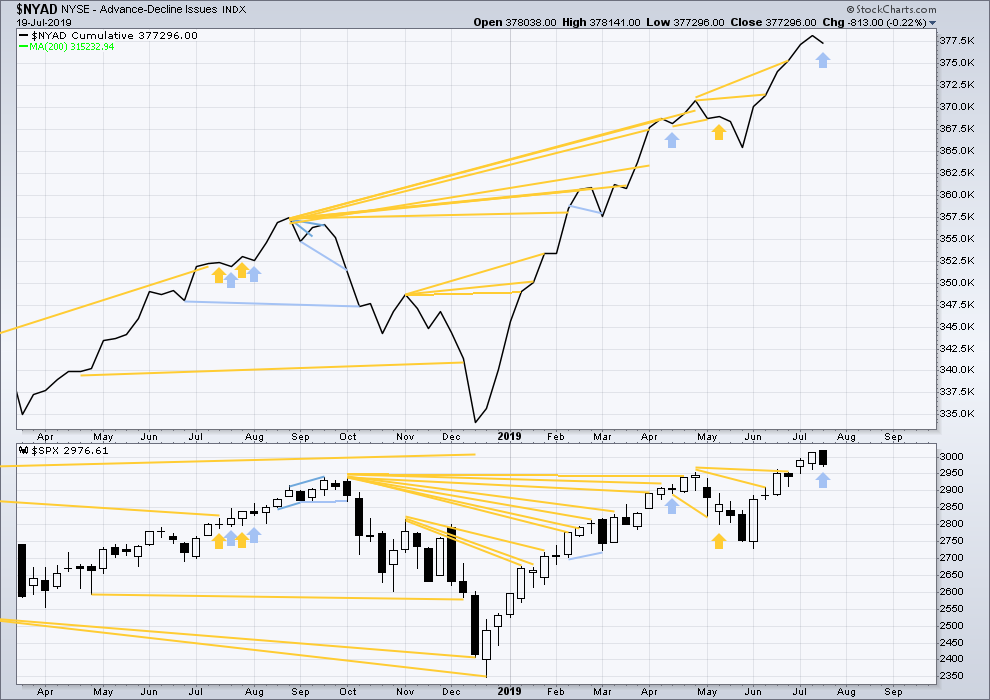
Click chart to enlarge. Chart courtesy of StockCharts.com. So that colour blind members are included, bearish signals
will be noted with blue and bullish signals with yellow.
Bear markets from the Great Depression and onwards have been preceded by an average minimum of 4 months divergence between price and the AD line with only two exceptions in 1946 and 1976. With the AD line making new all time highs again this week, the end of this bull market and the start of a new bear market is very likely a minimum of 4 months away, which is mid November 2019.
In all bear markets in the last 90 years there is some positive correlation (0.6022) between the length of bearish divergence and the depth of the following bear market. No to little divergence is correlated with more shallow bear markets. Longer divergence is correlated with deeper bear markets.
If a bear market does develop here, it comes after no bearish divergence. It would therefore more likely be shallow.
Last week the AD line again makes new all time highs with price. Upwards movement has good support from rising market breadth, indicating a healthy bull market.
Last week price has moved higher with a higher high and a higher low, although the candlestick has closed red. The AD line has declined. This is short-term bearish divergence.
Mid caps remain below their all time high of 24th April 2019, and small caps remain below their all time high of 25th February 2019. Weakness is beginning to develop in small caps and mid caps. This is normal behaviour during the later stages of a bull market, and may be expected to develop further before the bull market may end. Tops are a process and that process may last months to even years.
DAILY CHART
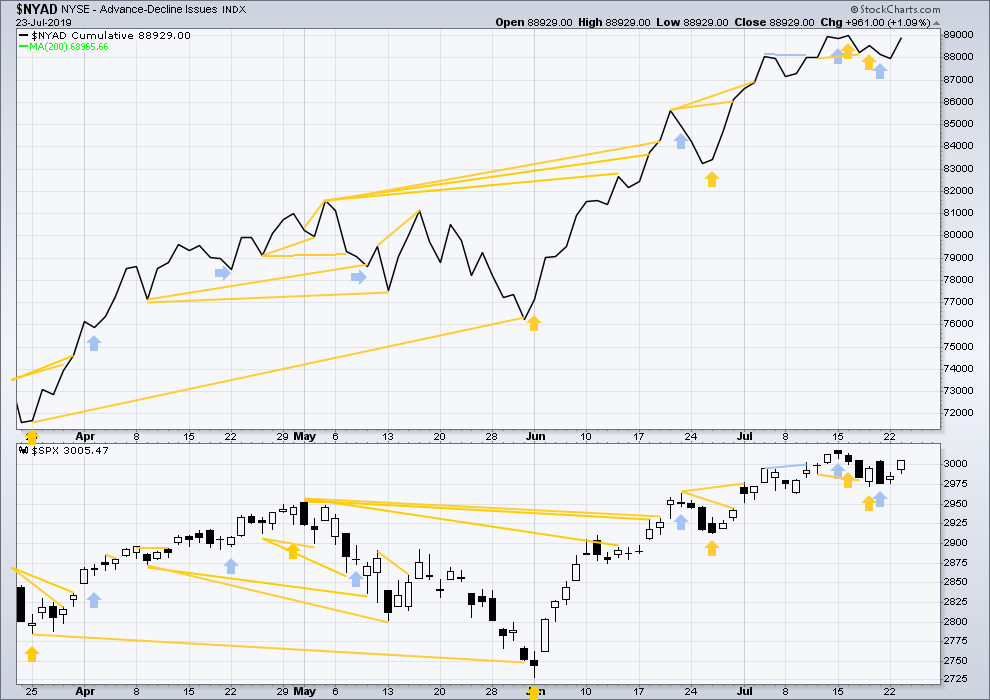
Click chart to enlarge. Chart courtesy of StockCharts.com. So that colour blind members are included, bearish signals
will be noted with blue and bullish signals with yellow.
Breadth should be read as a leading indicator.
Bearish divergence remains and has not yet been followed by any downwards movement. It may yet be followed by downwards movement in the next one to few days.
Both price and the AD line have moved higher today, but neither have made new highs. There is no new divergence.
VOLATILITY – INVERTED VIX CHART
WEEKLY CHART
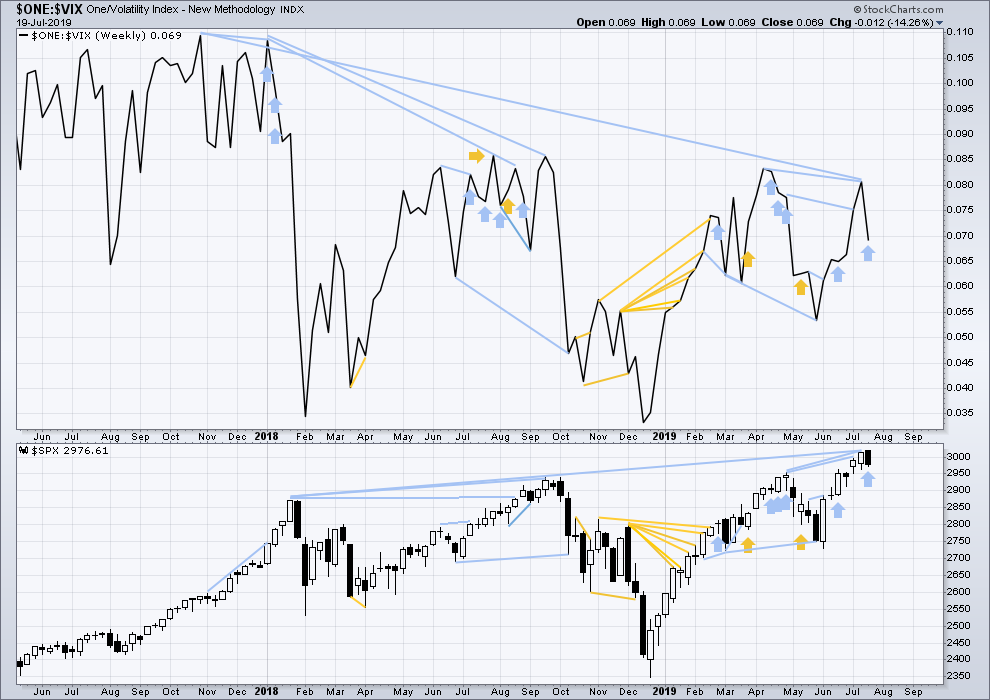
Click chart to enlarge. Chart courtesy of StockCharts.com. So that colour blind members are included, bearish signals
will be noted with blue and bullish signals with yellow.
The all time high for inverted VIX (which is the same as the low for VIX) was on 30th October 2017. There is now nearly one year and eight months of bearish divergence between price and inverted VIX.
The rise in price is not coming with a normal corresponding decline in VIX; VIX remains elevated. This long-term divergence is bearish and may yet develop further as the bull market matures.
This divergence may be an early warning, a part of the process of a top developing that may take years. It may not be useful in timing a trend change.
Last week inverted VIX has moved lower while price has moved higher. This divergence is bearish.
DAILY CHART
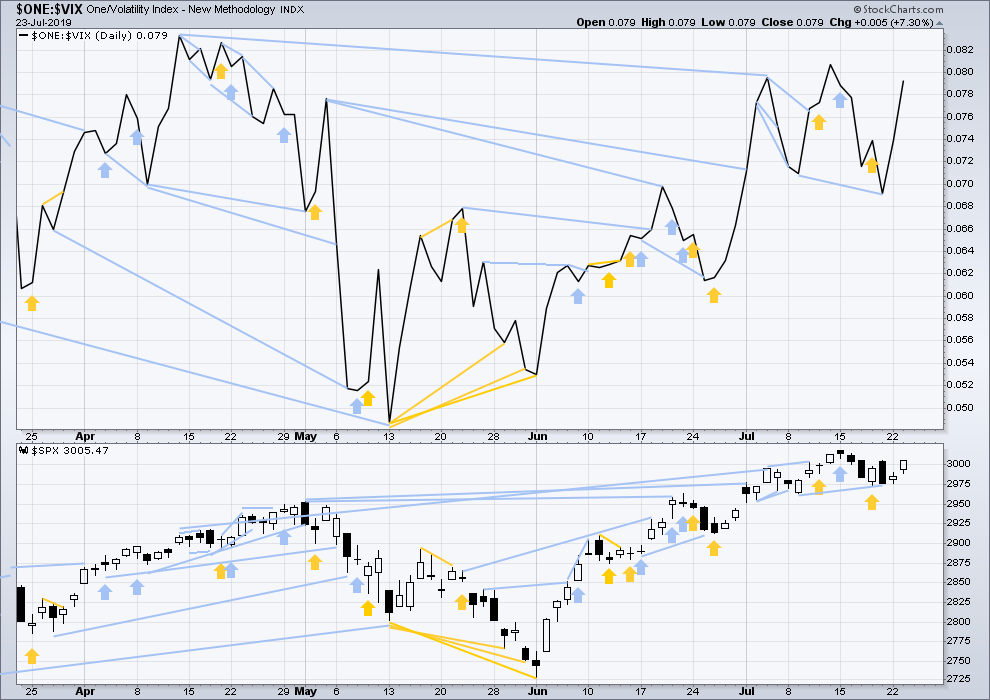
Click chart to enlarge. Chart courtesy of StockCharts.com. So that colour blind members are included, bearish signals
will be noted with blue and bullish signals with yellow.
Bearish divergence has not yet been followed by any downwards movement. It may be in the next one to few days.
Today both price and inverted VIX have moved higher, but neither have made new highs above the prior swing high of the 12th/15th of July. There is no new divergence.
DOW THEORY
Dow Theory confirmed a bear market in December 2018. This does not necessarily mean a bear market at Grand Super Cycle degree though; Dow Theory makes no comment on Elliott wave counts. On the 25th of August 2015 Dow Theory also confirmed a bear market. The Elliott wave count sees that as part of cycle wave II. After Dow Theory confirmation of a bear market in August 2015, price went on to make new all time highs and the bull market continued.
DJIA: 23,344.52 – a close on the 19th of December at 23,284.97 confirms a bear market.
DJT: 9,806.79 – price has closed below this point on the 13th of December.
S&P500: 2,532.69 – a close on the 19th of December at 2,506.96 provides support to a bear market conclusion.
Nasdaq: 6,630.67 – a close on the 19th of December at 6,618.86 provides support to a bear market conclusion.
With all the indices having moved higher following a Dow Theory bear market confirmation, Dow Theory would confirm a bull market if the following highs are made:
DJIA: 26,951.81 – a close above this point has been made on the 3rd of July 2019.
DJT: 11,623.58 – to date DJT has failed to confirm an ongoing bull market.
S&P500: 2,940.91 – a close above this point was made on the 29th of April 2019.
Nasdaq: 8,133.30 – a close above this point was made on the 26th of April 2019.
Published @ 09:11 p.m. EST.
—
Careful risk management protects your trading account(s).
Follow my two Golden Rules:
1. Always trade with stops.
2. Risk only 1-5% of equity on any one trade.
—
New updates to this analysis are in bold.
A new all time high invalidates any bearish count and gives some confidence for the bullish count.
Only one count left again now.
So, despite bearish signals and a bearish candlestick on the weekly chart, price keeps going up.
In a bull market surprises are to the upside. Today is an excellent example. This is one good reason why I am staying long in my long term account and not reacting to lower degree waves. I don’t want to react to hypothetical possibilities either.
Enjoying sun at the Pacific ocean!
Yes indeed.
The Bearish Engulfing pattern on the weekly chart has failed utterly to be followed by any downwards movement.
Candlestick patterns are one of the more reliable TA indicators. But they don’t always work.
Wouldn’t it be nice if there was just one thing in TA that always worked?
Slowly levitating. Ever. So. Slowly.
If this is a 3rd wave at multiple degrees, it sure is off to a sluggish start. Feels a lot like Lara’s main hourly count. At least for now…
Not until it (a) starts going down and (b) starts going down impulsively. Sluggish up ward action is still upward action. That said, we might be set up for a Grand Double Top here, it’s close enough on the daily chart to call it that if price turns back down sharply, and if a massive double top with head and shoulders sets up here…yea, it could be Interesting to the down side! But first price would have to start going the other direction. Sure looks like the ATH is going to fall here and the bear case dissolved…but it ain’t over until it’s over.
BTW, I just put on a SPY butterfly for Aug 16 right where the current trend line says price is headed. 304-307.5-311, only $67/fly, and a max payoff of $270/fly.
Agreed. But we could also be printing a flat or expanded flat here. (I just can’t shake off that bearish vibe quite yet.)
Never saw confirming price action for the I2 (close, but no cigar). Couldn’t ever really feel that bearish vibe.
Here’s how I see the overhead price landscape.
except for the price type for the middle line…should be 3203, not 3103! my bad…
” we could also be printing a flat or expanded flat”
I don’t want to publish such a count, it would see minor A way way too short and brief. It just looks all kinds of wrong.
If you are looking to get short…
Maybe a decent entry was at the circle on this ES 4hour Heikin-Ashi chart
Going short when the daily trend is now “up”, and the hourly trend is “strong up”, can be unhealthy for your bottom line.
That said, we might get turn signals here. We all know this is just about where the hourly main calls for a turn, and yea, the 78.6% level was tagged. But today so far is showing strength, not weakness. That could change though.
Hey, a gap down open and then a push up and THROUGH the gap?
Haven’t seen that in awhile. Can 2917 fall today and the bear count gets zapped? That would float my boat.
Stock set up updates all session long on my website at specktrading btw. AMD and OZM (cited one and two days ago) breaking upward nicely, also MCK appears to be triggering to the long side now. Check it out.
Yes that would be great.
RTY very strong today, seems like the long awaited 3 has started
Yea I like the set up and the trigger in RUT.
RUT has been a great trade today ??
Bam!