
Downwards movement at the end of Friday’s session remains above the invalidation point on the hourly chart and within the short-term best fit channel. However, at the end of the week a pattern on the weekly chart along with the AD line and inverted VIX suggest a new Elliott wave count.
Summary: A new Elliott wave count on the daily chart expects a deeper more time consuming correction which may reach to 2,939 or below. This has support from some bearish divergence between price and all of the AD line, VIX and On Balance Volume, and a Bearish Engulfing candlestick pattern on the weekly chart.
A bullish Elliott wave count remains valid while price remains above 2,963.44. For this count, a short-term target for the middle of a third wave to end is now at 3,097. A mid-term target for a third wave at intermediate degree is at 3,148.
The biggest picture, Grand Super Cycle analysis, is here.
Monthly charts were last published here, with video here. There are two further alternate monthly charts here, with video here.
ELLIOTT WAVE COUNTS
The two weekly Elliott wave counts below will be labelled First and Second. They may be about of even probability. When the fifth wave currently unfolding on weekly charts may be complete, then these two wave counts will diverge on the severity of the expected following bear market. To see an illustration of this future divergence monthly charts should be viewed.
FIRST WAVE COUNT
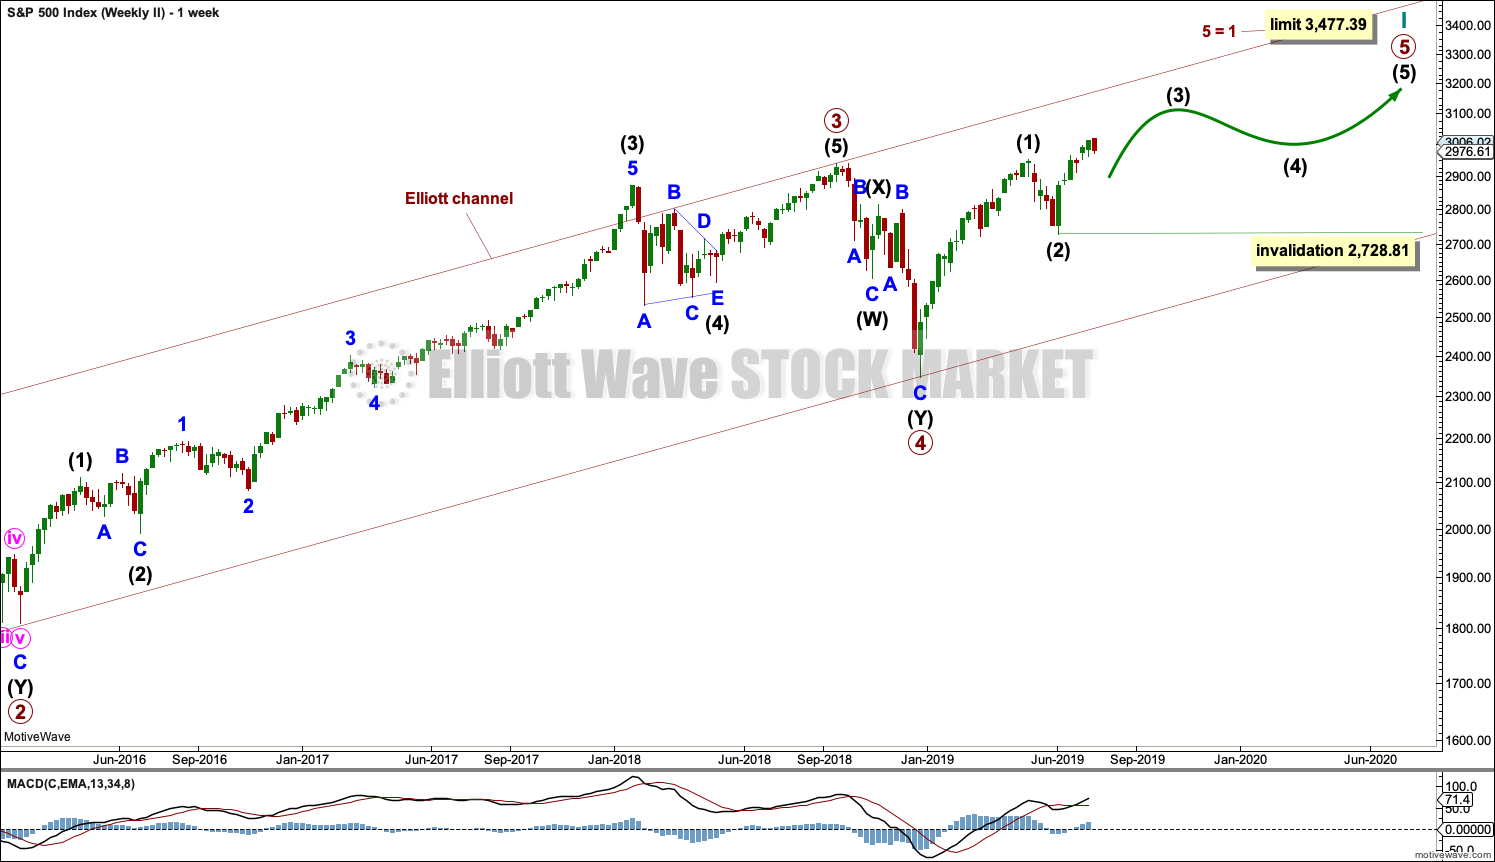
WEEKLY CHART
Click chart to enlarge.
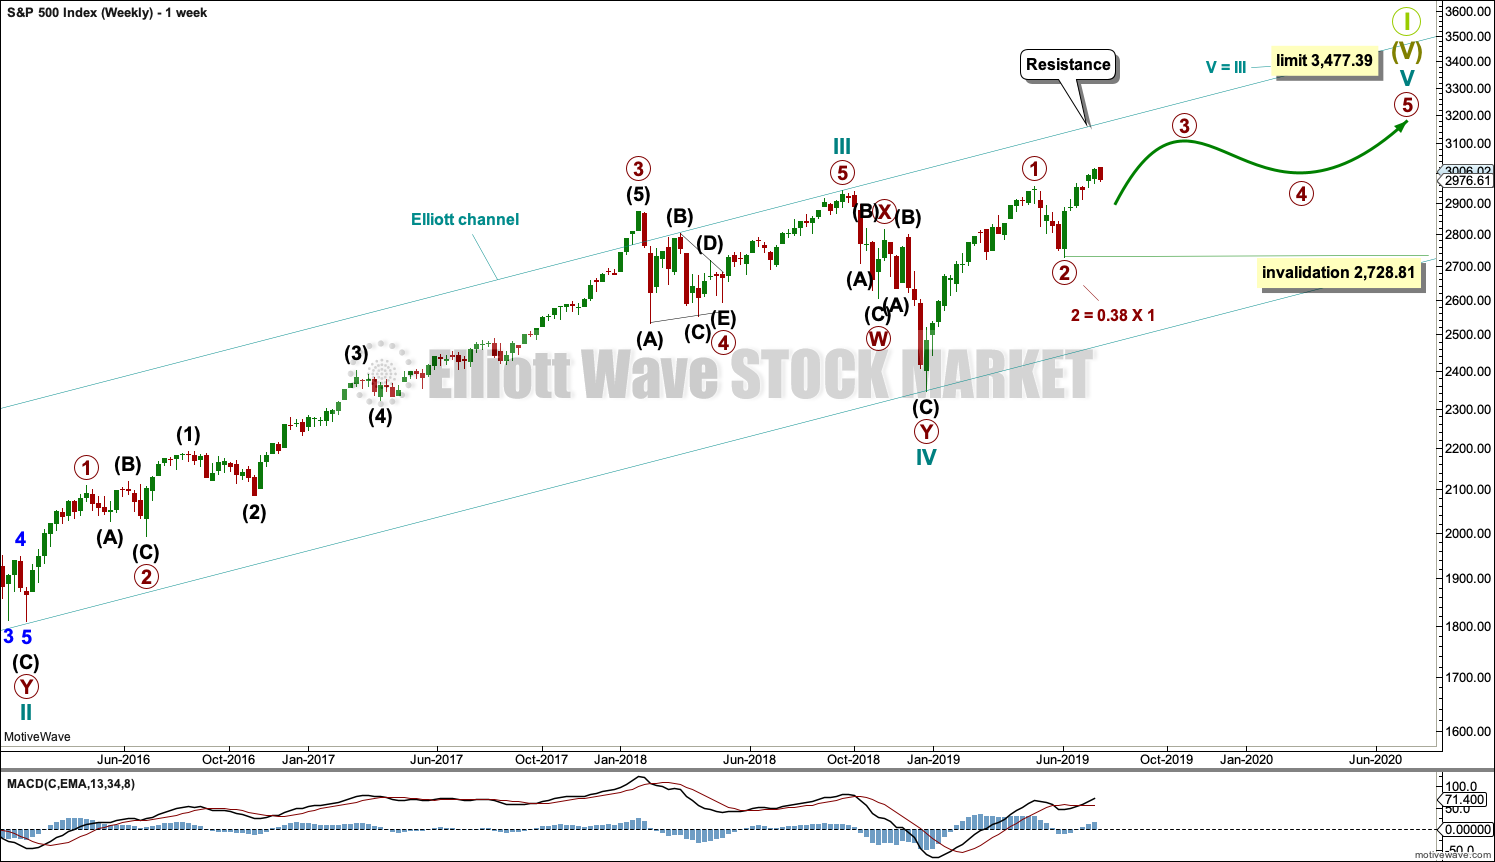
The basic Elliott wave structure consists of a five wave structure up followed by a three wave structure down (for a bull market). This wave count sees the bull market beginning in March 2009 as an incomplete five wave impulse and now within the last fifth wave, which is labelled cycle wave V. This impulse is best viewed on monthly charts. The weekly chart focusses on the end of it.
Elliott wave is fractal. This fifth wave labelled cycle wave V may end a larger fifth wave labelled Super Cycle wave (V), which may end a larger first wave labelled Grand Super Cycle wave I.
The teal Elliott channel is drawn using Elliott’s first technique about the impulse of Super Cycle wave (V). Draw the first trend line from the end of cycle wave I (off to the left of the chart, the weekly candlestick beginning 30th November 2014) to the end of cycle wave III, then place a parallel copy on the end of cycle wave II. This channel perfectly shows where cycle wave IV ended at support. The strongest portion of cycle wave III, the end of primary wave 3, overshoots the upper edge of the channel. This is a typical look for a third wave and suggests the channel is drawn correctly and the way the impulse is counted is correct.
Within Super Cycle wave (V), cycle wave III is shorter than cycle wave I. A core Elliott wave rule states that a third wave may never be the shortest. For this rule to be met in this instance, cycle wave V may not be longer in length than cycle wave III. This limit is at 3,477.39.
Within cycle wave V, primary waves 1 and 2 may now be complete. Within primary wave 3, no second wave correction may move beyond its start below 2,728.81.
Cycle wave V may subdivide either as an impulse or an ending diagonal. Impulses are much more common. Ending diagonals normally have second and fourth waves that are deep; the common depth is from 0.66 to 0.81 the prior wave. So far a correction within cycle wave V has not been deeper than 0.5, so a diagonal at this stage looks very unlikely (but remains possible).
In historic analysis, two further monthly charts have been published that do not have a limit to upwards movement and are more bullish than this wave count. Members are encouraged to consider those possibilities (links below summary) alongside the wave counts presented on a daily and weekly basis.
Daily charts below will now focus on price movement from the high of primary wave 1.
DAILY CHART
Click chart to enlarge.
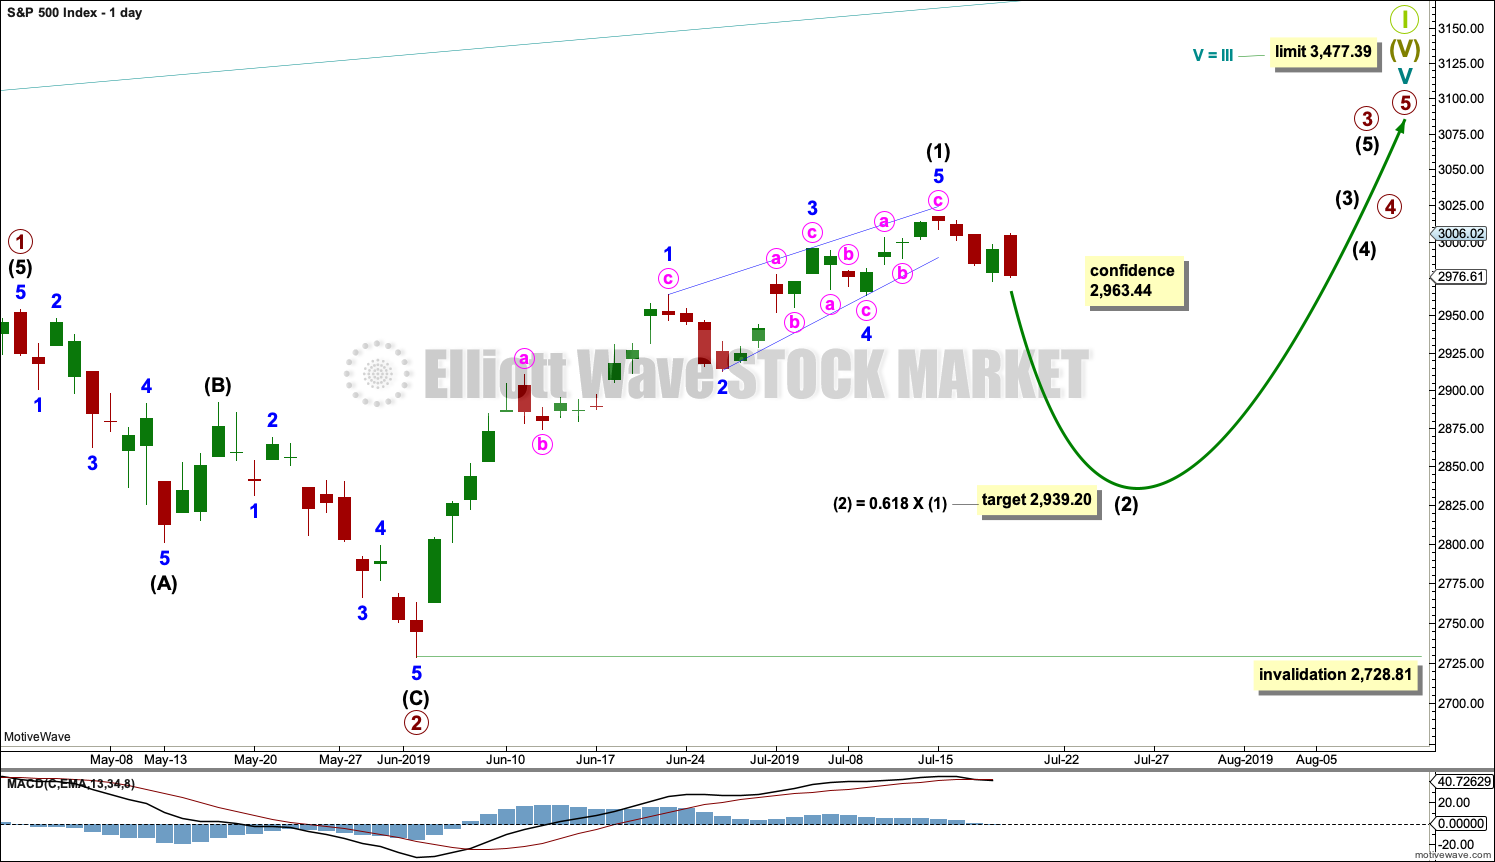
Cycle wave V must subdivide as a five wave motive structure. Within that five wave structure, primary waves 1 and 2 may be complete.
Primary wave 3 must move above the end of primary wave 1 (this rule has now been met). Primary wave 3 may only subdivide as an impulse.
Within the impulse of primary wave 3, intermediate wave (1) may be complete.
At the end of this week, the wave count at the daily chart level is changed after a judgement made from classic technical analysis. Thank you to Kevin for charting this idea.
It is possible that intermediate wave (1) was over at the last high as a leading contracting diagonal. Within the diagonal, all sub-waves appear to be zigzags, as they most commonly are within leading diagonals. Minor wave 4 overlaps minor wave 1 price territory, as it must within a diagonal. The trend lines converge. This structure meets all Elliott wave rules.
Second wave corrections following leading diagonals in first wave positions are commonly very deep. Intermediate wave (2) may be expected to reach down to the 0.618 Fibonacci ratio of intermediate wave (1) or below.
Intermediate wave (2) may not move beyond the start of intermediate wave (1) below 2,728.81.
Intermediate wave (2) may last a few weeks.
HOURLY CHART
Click chart to enlarge.
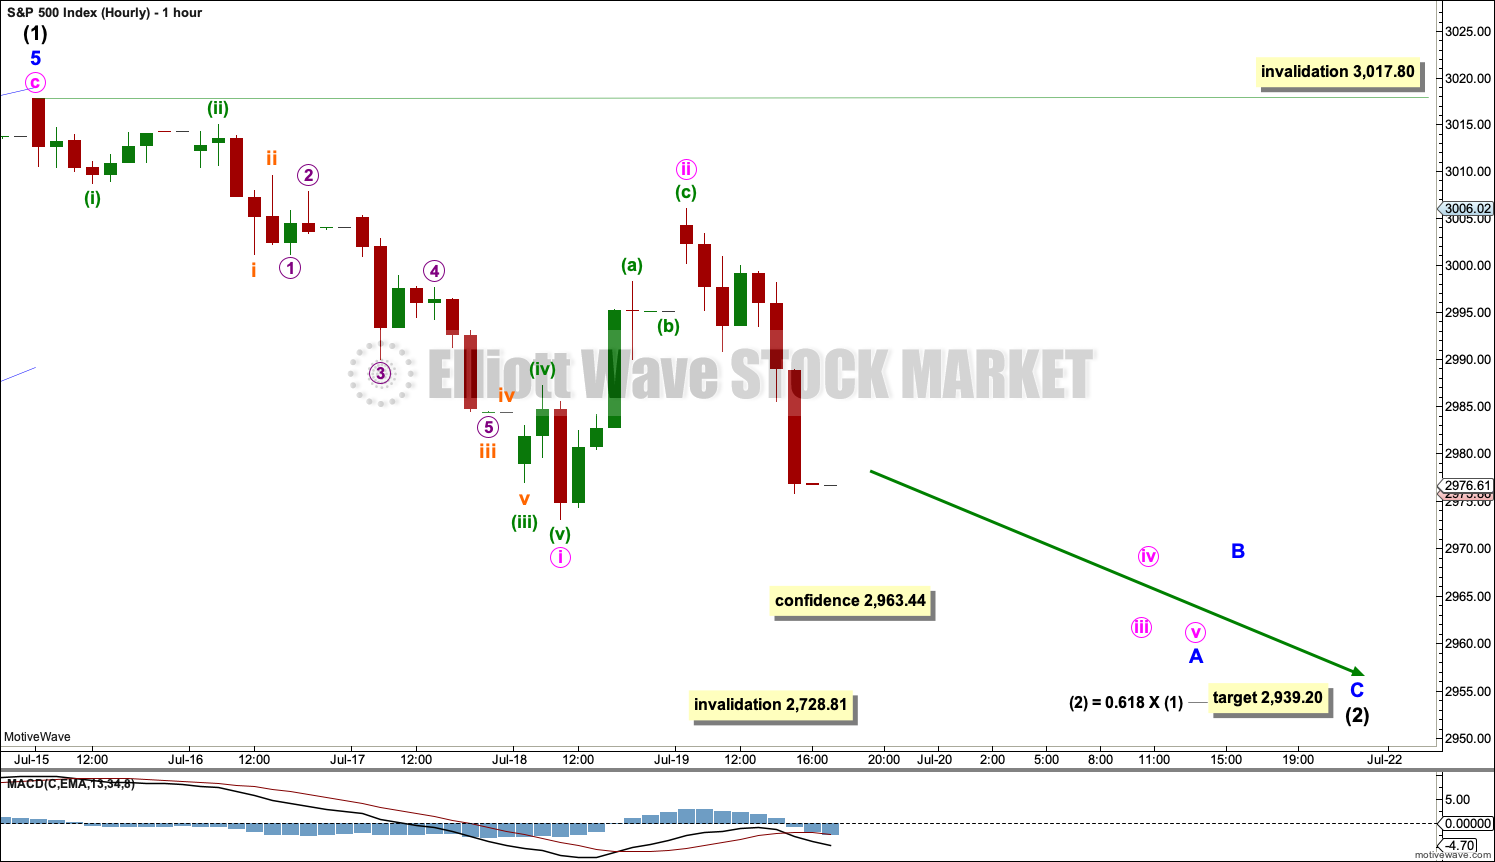
Intermediate wave (2) should be expected to be relatively time consuming and deep, and so minor wave A would most likely be incomplete.
Intermediate wave (2) would most likely subdivide as a zigzag, although it may be any Elliott wave corrective structure except a triangle. A zigzag subdivides 5-3-5.
Minor wave A would most likely subdivide as a five wave impulse. Within minor wave A, minute wave i may be complete and minute wave ii may also be complete. But if minute wave ii continues higher as a flat, double zigzag or combination, it may not move beyond the start of minute wave i above 3,017.80.
ALTERNATE DAILY CHART
Click chart to enlarge.
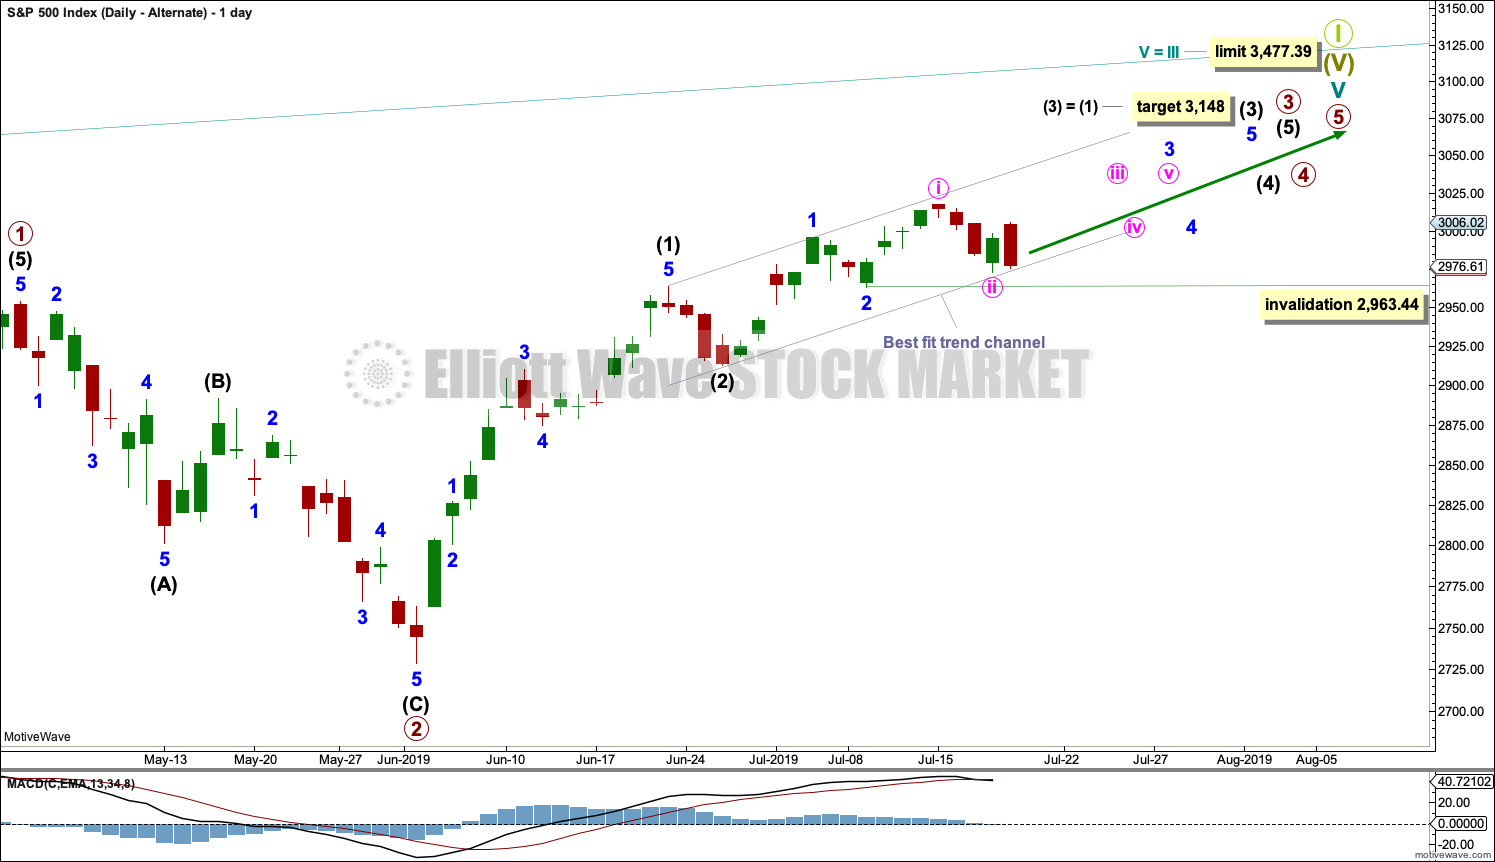
Up until the end of this week, this was the main wave count. Today it is judged to be an alternate.
It remains possible that within primary wave 3 both intermediate waves (1) and (2) are complete. Within intermediate wave (3), both minor waves 1 and 2 may be complete. Within minor wave 3, minute wave ii should be over at the last low if it is to remain within the best fit channel.
Minute wave ii may not move beyond the start of minute wave i below 2,963.44.
ALTERNATE HOURLY CHART
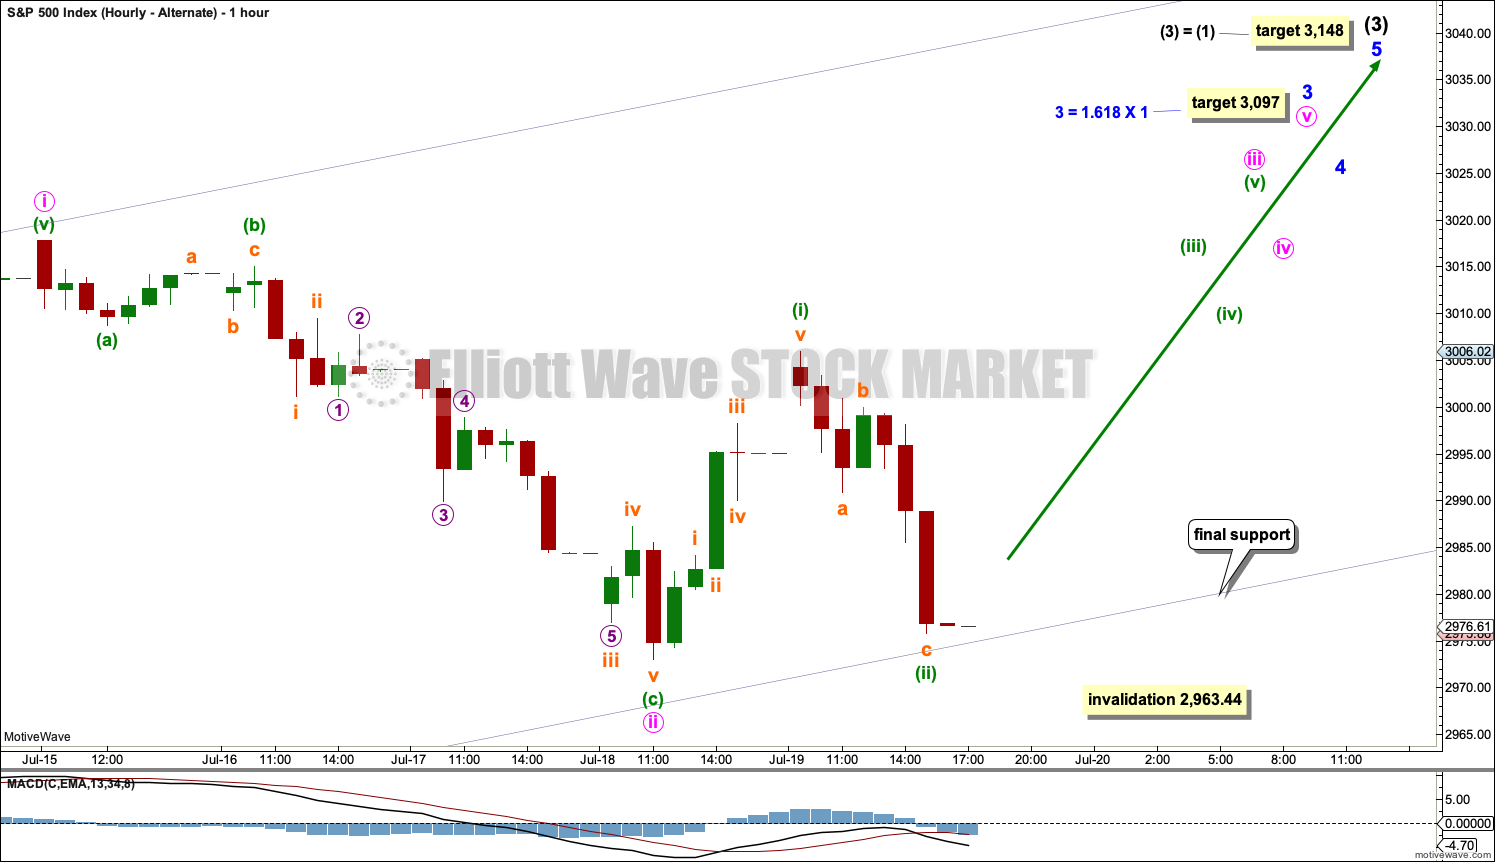
Click chart to enlarge.
This wave count now sees a series of five overlapping first and second waves complete. This wave count now expects explosive upwards movement next week.
A new all time high, which has some support from volume, would indicate this wave count should be correct. At that stage, targets may be used (calculated to expect common Fibonacci Ratios).
SECOND WAVE COUNT
WEEKLY CHART
Click chart to enlarge.
This weekly chart is almost identical to the first weekly chart, with the sole exception being the degree of labelling.
This weekly chart moves the degree of labelling for the impulse beginning in March 2009 all down one degree. This difference is best viewed on monthly charts.
The impulse is still viewed as nearing an end; a fifth wave is still seen as needing to complete higher. This wave count labels it primary wave 5.
SECOND ALTERNATE WAVE COUNT
DAILY CHART
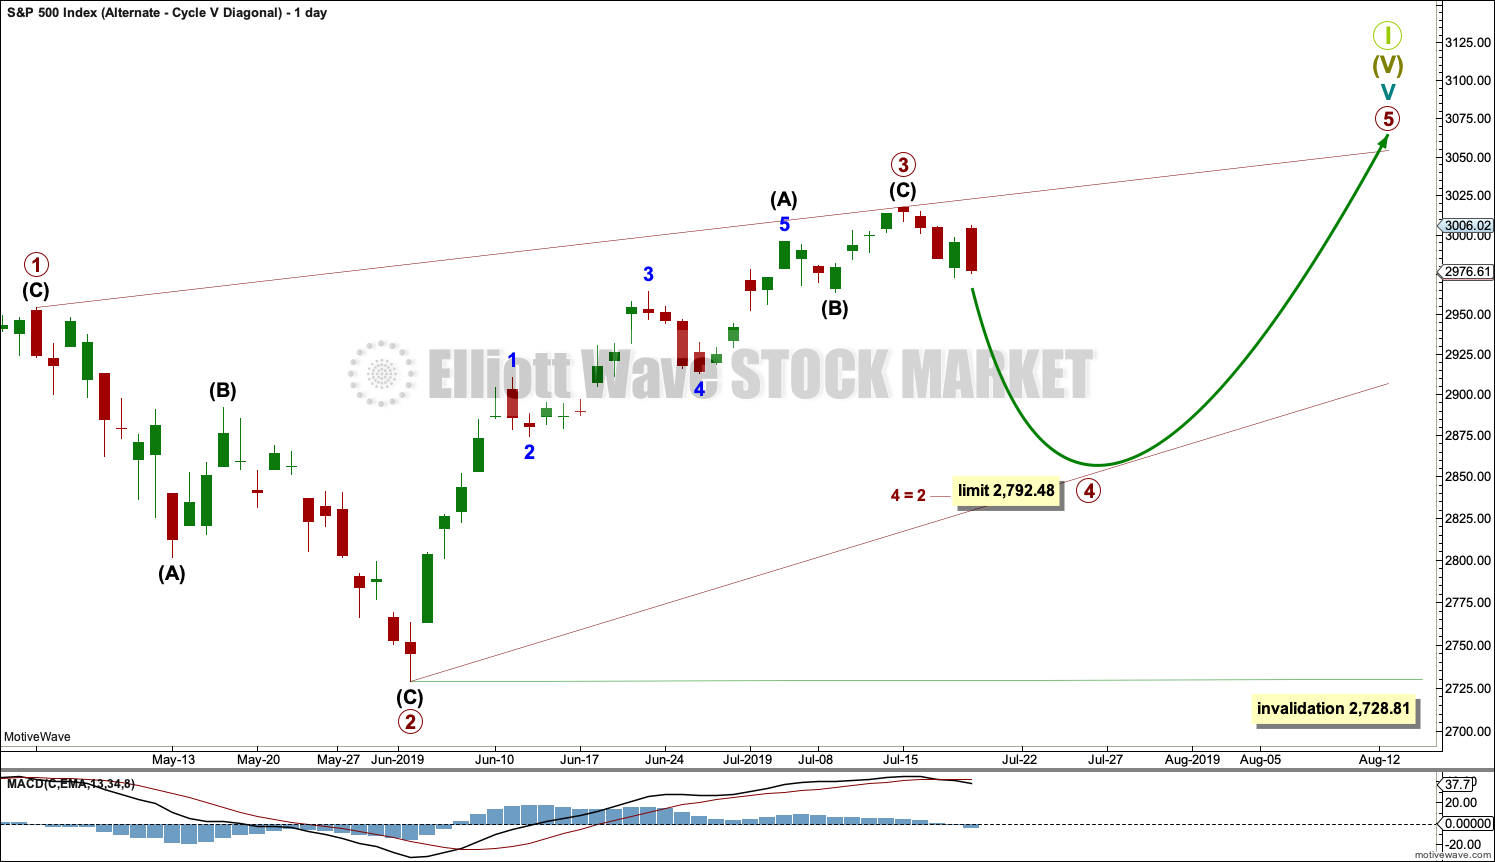
Click chart to enlarge.
For publication at the end of this week only, another structure is possible for cycle wave V.
The first two daily charts above expect that cycle wave V may be unfolding as an impulse, which is much more likely. This second alternate looks at the less likely structure of an ending diagonal.
Ending diagonals require all sub-waves to subdivide as zigzags. The fourth wave must overlap first wave price territory. The most common type are contracting diagonals, where the third wave is shorter than the first, the fifth wave is shorter than the third, the fourth wave is shorter than the second and the trend lines converge.
In this possible diagonal primary wave 3 is shorter than primary wave 1. Primary wave 4 must be shorter than primary wave 2 for the rule to be met.
This wave count expects a relatively quick end to cycle wave V. Because at this stage there is no divergence between price and the AD line this wave count has a very low probability. It will not be published again for this reason. I will follow this possibility and will publish it again if it is necessary.
TECHNICAL ANALYSIS
WEEKLY CHART
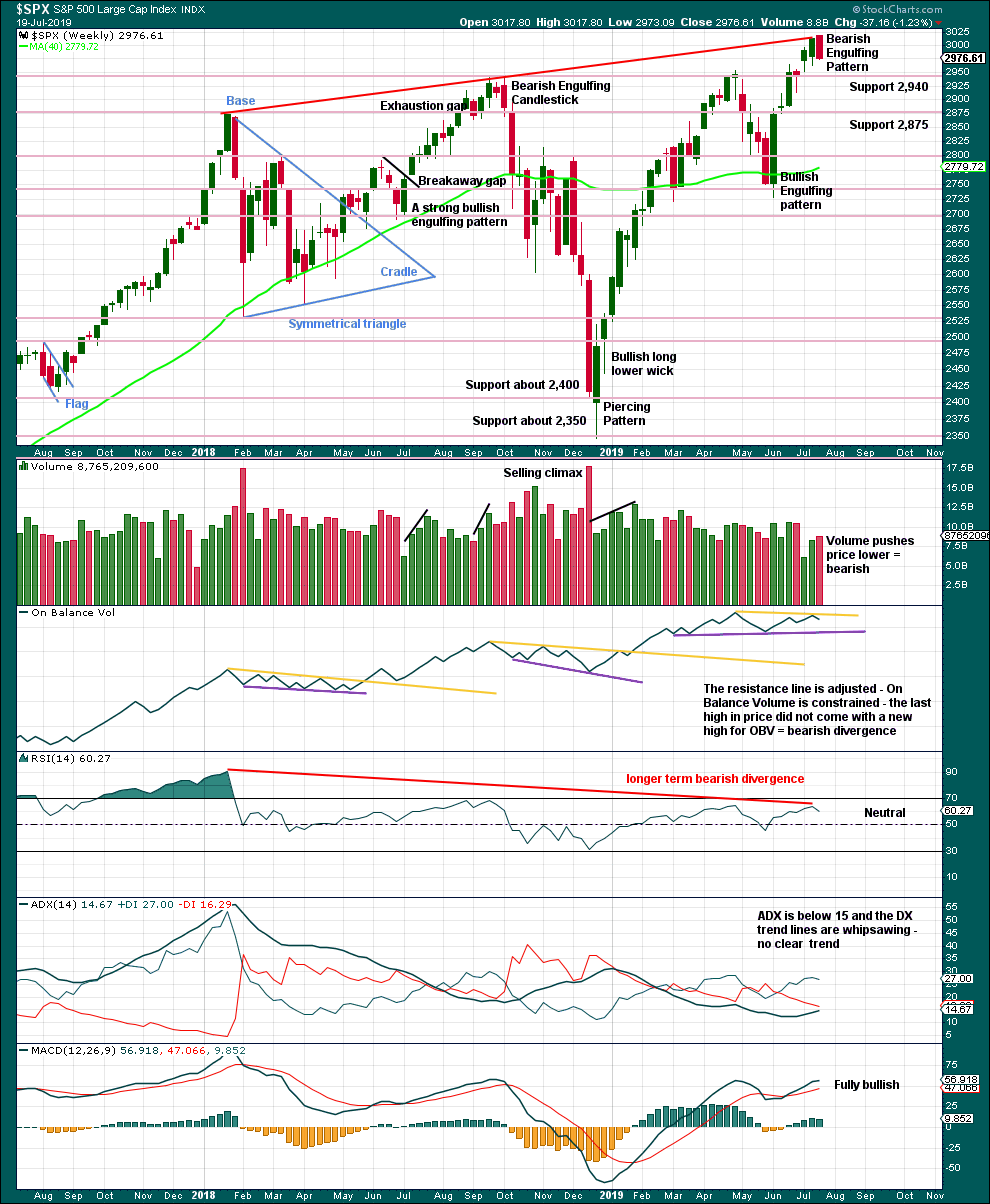
Click chart to enlarge. Chart courtesy of StockCharts.com.
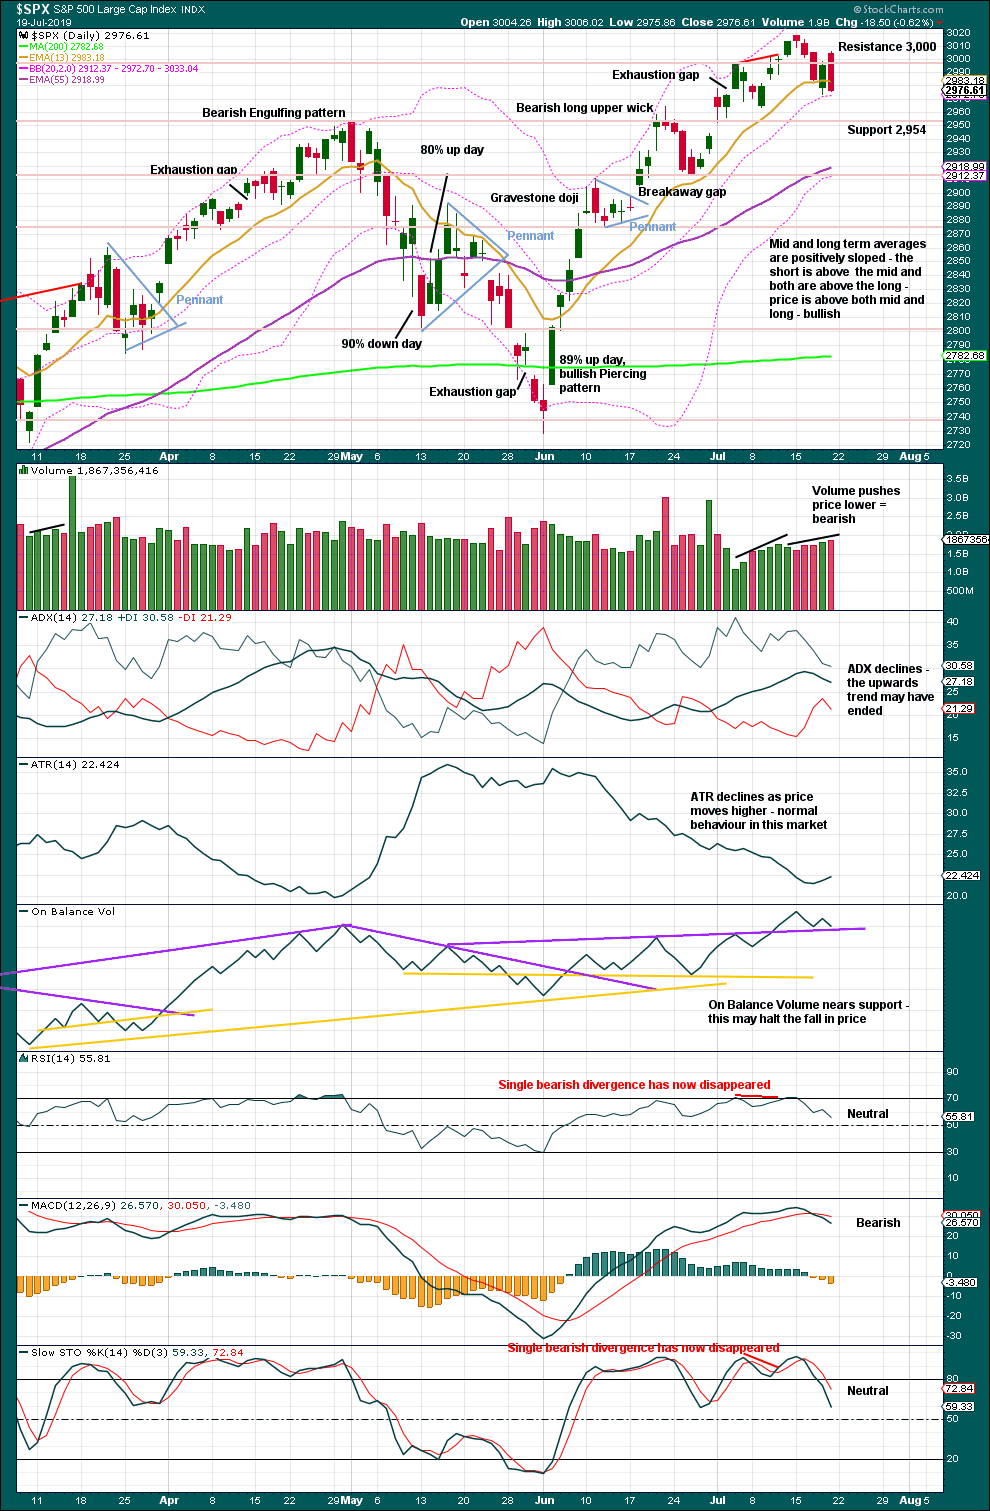
This week completes a strong Bearish Engulfing candlestick pattern. Coming after an upwards movement, this is a reversal pattern. It has support from volume; it is taken seriously in this analysis.
The red line illustrating bearish divergence is also a resistance line, which was perfectly met this week.
Longer-term bearish divergence between price and RSI fits the Elliott wave count: the most extreme reading from RSI corresponds with the end of a third wave, and now a fifth wave at cycle or primary degree exhibits some weakness compared to the third wave.
DAILY CHART
Click chart to enlarge. Chart courtesy of StockCharts.com.
Volume suggests the pullback is still not over.
BREADTH – AD LINE
WEEKLY CHART
Click chart to enlarge. Chart courtesy of StockCharts.com. So that colour blind members are included, bearish signals
will be noted with blue and bullish signals with yellow.
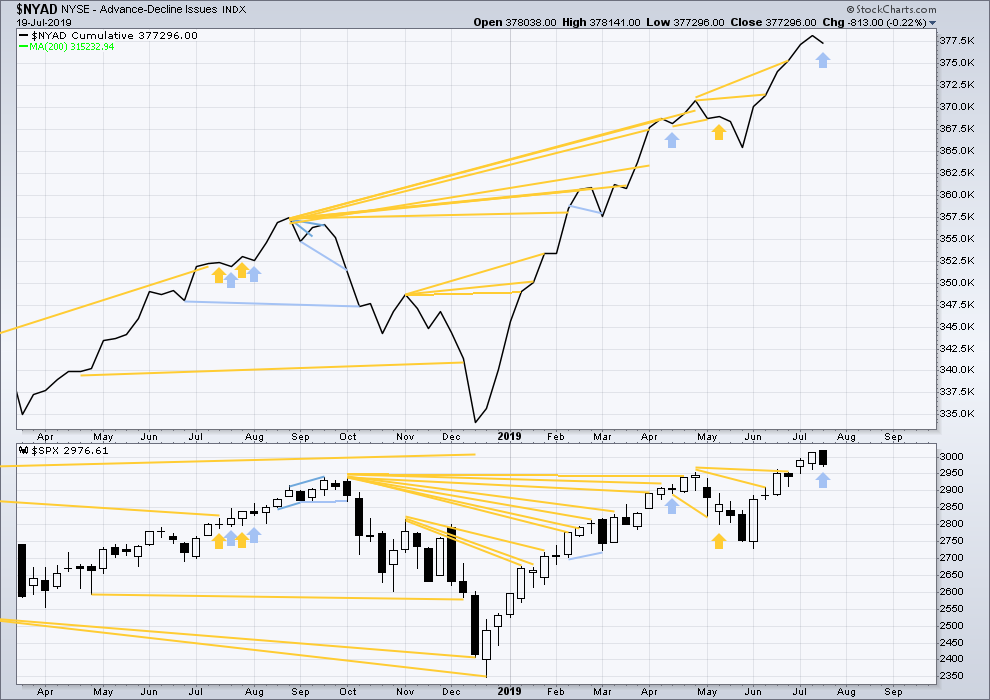
Bear markets from the Great Depression and onwards have been preceded by an average minimum of 4 months divergence between price and the AD line with only two exceptions in 1946 and 1976. With the AD line making new all time highs again this week, the end of this bull market and the start of a new bear market is very likely a minimum of 4 months away, which is mid November 2019.
In all bear markets in the last 90 years there is some positive correlation (0.6022) between the length of bearish divergence and the depth of the following bear market. No to little divergence is correlated with more shallow bear markets. Longer divergence is correlated with deeper bear markets.
If a bear market does develop here, it comes after no bearish divergence. It would therefore more likely be shallow.
Last week the AD line again makes new all time highs with price. Upwards movement has good support from rising market breadth, indicating a healthy bull market.
This week price has moved higher with a higher high and a higher low, although the candlestick has closed red. The AD line has declined. This is short-term bearish divergence.
Mid caps remain below their all time high of 24th April 2019, and small caps remain below their all time high of 25th February 2019. Weakness is beginning to develop in small caps and mid caps. This is normal behaviour during the later stages of a bull market, and may be expected to develop further before the bull market may end. Tops are a process and that process may last months to even years.
DAILY CHART
Click chart to enlarge. Chart courtesy of StockCharts.com. So that colour blind members are included, bearish signals
will be noted with blue and bullish signals with yellow.
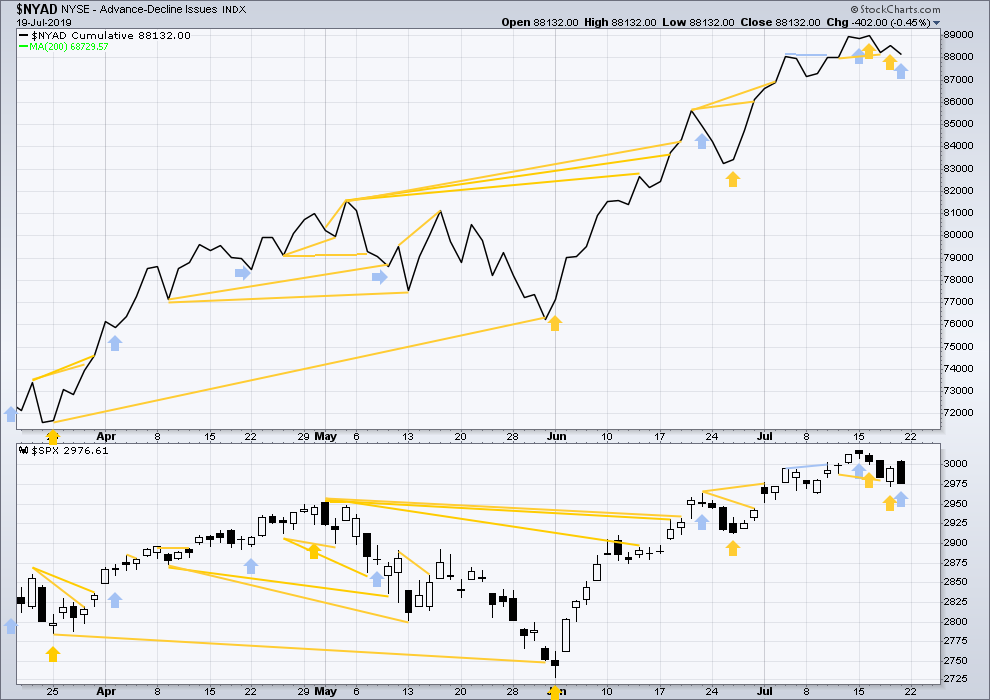
Breadth should be read as a leading indicator.
Short-term bullish divergence noted on Thursday was followed by some upwards movement within Friday with a higher high and a higher low. It may now be resolved.
Friday’s session saw a higher high and a higher low, but the AD line has declined. For the short term, this divergence is bearish.
VOLATILITY – INVERTED VIX CHART
WEEKLY CHART
Click chart to enlarge. Chart courtesy of StockCharts.com. So that colour blind members are included, bearish signals
will be noted with blue and bullish signals with yellow.
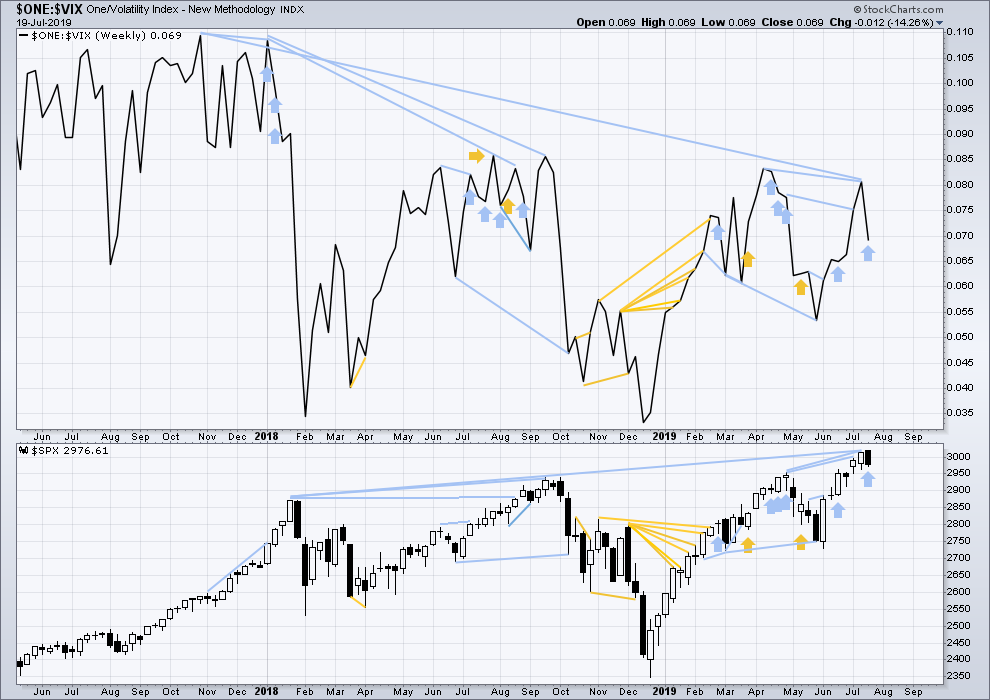
The all time high for inverted VIX (which is the same as the low for VIX) was on 30th October 2017. There is now nearly one year and eight months of bearish divergence between price and inverted VIX.
The rise in price is not coming with a normal corresponding decline in VIX; VIX remains elevated. This long-term divergence is bearish and may yet develop further as the bull market matures.
This divergence may be an early warning, a part of the process of a top developing that may take years. It may not be useful in timing a trend change.
This week inverted VIX has moved lower while price has moved higher. This divergence is bearish.
DAILY CHART
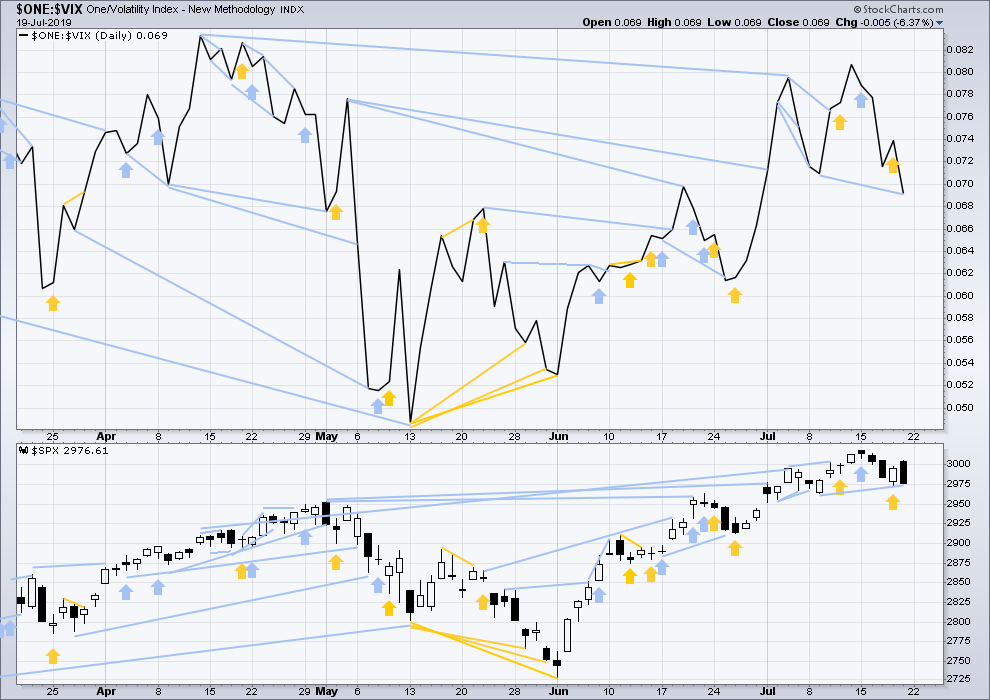
Click chart to enlarge. Chart courtesy of StockCharts.com. So that colour blind members are included, bearish signals
will be noted with blue and bullish signals with yellow.
Inverted VIX has made a new swing low below the prior low of the 9th of July, but price has not. This divergence is bearish.
DOW THEORY
Dow Theory confirmed a bear market in December 2018. This does not necessarily mean a bear market at Grand Super Cycle degree though; Dow Theory makes no comment on Elliott wave counts. On the 25th of August 2015 Dow Theory also confirmed a bear market. The Elliott wave count sees that as part of cycle wave II. After Dow Theory confirmation of a bear market in August 2015, price went on to make new all time highs and the bull market continued.
DJIA: 23,344.52 – a close on the 19th of December at 23,284.97 confirms a bear market.
DJT: 9,806.79 – price has closed below this point on the 13th of December.
S&P500: 2,532.69 – a close on the 19th of December at 2,506.96 provides support to a bear market conclusion.
Nasdaq: 6,630.67 – a close on the 19th of December at 6,618.86 provides support to a bear market conclusion.
With all the indices having moved higher following a Dow Theory bear market confirmation, Dow Theory would confirm a bull market if the following highs are made:
DJIA: 26,951.81 – a close above this point has been made on the 3rd of July 2019.
DJT: 11,623.58 – to date DJT has failed to confirm an ongoing bull market.
S&P500: 2,940.91 – a close above this point was made on the 29th of April 2019.
Nasdaq: 8,133.30 – a close above this point was made on the 26th of April 2019.
Published @ 02:10 a.m. EST on July 20, 2019
—
Careful risk management protects your trading account(s).
Follow my two Golden Rules:
1. Always trade with stops.
2. Risk only 1-5% of equity on any one trade.
—
New updates to this analysis are in bold.
Hi everybody, apologies for my tardiness today.
Anyway, the markets are very quiet today so I don’t think the lack of a timely updated hourly chart is of great importance today.
Sideways movement fits neatly as a three, so far. For this hourly chart there may now be two overlapping first and second waves complete.
I shall probably move the invalidation point lower, I need to check classic TA before that’s finalised.
You may want to take a look at this string:
https://www.thetechnicaltraders.com/us-global-markets-setting-up-for-a-volatility-explosion-are-you-ready/
Great read
I think we peek in september and no later then december
According to the Gann cycle september will mark 90 years since the last major crash
interesting that there were 2 crashes prior 1839 and 1749
Lets see if the Gann cycle plays out.
Some other market observers believes that we are in completing Wave D
Then the next wave would be a E wave down which should take us below last years low!
Then a 5 wave pattern should take us up after that.
Without mentioning names I think you know what I’m referring too.
I think we top out this year and we head into a recession by next year.
I follow 3
Lara
Elliott wave international
and Scienceinvesting
What’s interesting is
Lara’s view is we go to at least 3400 ish
Elliott wave believes we might go slightly higher then a flush down for E
Science investing believes we peak out here or soon after and we start going into a recession.
Off course markets usually peak in September – December who knows maybe this time will be different.
They cut interest rates and the market rally’s hard that could support Lara’s point of view.
I respect all points of view I’m just very nervous we are now in the longest business cycle in Us History.
One more thing Theres and indicator that compares the stock market and the new housing stats. According to the model we have hit 2 or higher only 6 times since the 1800’s we are now in the 6th.
100% of the time may it be 3 – 24 months the market has always crashed at least 50% minimum. Highest reading was in 1929 at 2.8, 2000 at 2.5 and now it looks like 2.2 ish
I think EWI have a count of a huge expanding triangle.
In my research to date on now three markets I have seen zero expanding triangles.
In my now over 11 years of daily EW analysis I think I may have only ever seen one, on the USD on an hourly chart.
My experience shows expanding triangles are one of the rarest EW structures. The rarity of that structure means such a count would have an extremely low probability. While there are more common structures that fit this movement I am completely bemused as to why they’re hanging onto that count.
Lol the reason being is that someone pointed out to them, that the Dow Jones industrial average exhibited this same behavior back in the 1970’s with a lot of A B C corrections and no 5 wave movements.
That’s what they were explaining
But how rare are we talking about?
Take a look at Gold it’s going through the same thing over the past 5 years.
What do you think?
Thank You
Thank you, Lara. I know you’re a woman of good cheer and good will. But within the privacy of your classroom, I welcome the occasional good chuckle at EWI’s expense!
Oddly enough, the expanding triangle call came about relatively recently, I’d say about two months ago, maybe three.
It would appear to be really low probability and should be at MOST their alternative, if not their 2nd or 3rd alternative model. The EWI folks seem to strain to build models to support their market outlook, which I note is often strongly influenced by sentiment indicators. Which Lara expressly does not use at all. Hooray.
I think this article is a bunch of hot air, but I’m a harsh critic. No technical analysis of any merit presented at all, much less justifying their bear call.
RUT btw has bounced off a 61.8%, possibly the bottom of a long sideways/down 2. However, there aren’t any good confirming triggers in RUT yet. Very speculative low.
thanks for all the updates…. and great website!!!
A perhaps overly optimistic count…
A 2960 there will be A = C and 2960 is the 1.27 extension of A. And prior pivots. Watch for turn indications there.
Either SPX double bottoms at 2972…or goes down to the A = C and 1.27 extension level of 2961, in theory completing an ABC down. Which of course could just be a W down of a bigger WXY intermediate 2, because it’s not really “intermediate” size yet. Don’t we love corrections? No, not really…
Here’s my best current shot. WXY correction in the middle or late stages of the W down. This is 5 minute SPX.
See front page “alerts” on my site for stock set up info, specktrading dot com. Some interesting ones getting close!
How about a good old motive wave launching here today/tomorrow, eh? That would float my boats…
Getting some bottom structure in SPX at the 5 minute level now. If those pivot high resistance lines are busted, and the “last” down trend line, we could be done with this correction for a least a bit, if not completely. Nice double/triple bottom set up here…
Triggering now. Trend line break, pivot high break, trend state to strong up. Triple bottom off a 76.4%. Bought calls.
scratch those calls. no strength, turning off next pivot resistance line above. 5 minute trend back to neutral from up, and hourly hasn’t made it out of down.
discretion better part of valor.
Lara I know it’s only a typo but .618 of (1) is 2839.20.
Cheers
Peter
Oh yes, a typo. Thankyou for pointing it out, fixed now.
#1
Hey there. I am home for a day or two. Great analysis Lara. Thanks. I sure hope your eyes are better and heal fully.
I sold my long RUT 3X leveraged positions when I was home over a week ago. The market was not acting like a 3rd of a 3rd of a 3rd as expected. So I liquidated the positions for essentially a break even. I will wait for the SPX to get near 2940 or so before reloading some more leveraged long positions in my short term account. Long term account is still fully long and will remain so until at least the end of Primary 3.
Have a great weekend everybody.