
New highs this week again from the S&P have support from rising market breadth.
The Elliott wave count provides targets.
Summary: The bull market is expected to continue and corrections are expected to be shallow. A new target for the next reasonable consolidation or pullback to begin is at 3,148.
The biggest picture, Grand Super Cycle analysis, is here.
Monthly charts were last published here, with video here. There are two further alternate monthly charts here, with video here.
ELLIOTT WAVE COUNTS
The two Elliott wave counts below will be labelled First and Second. They may be about of even probability. When the fifth wave currently unfolding on weekly charts may be complete, then these two wave counts will diverge on the severity of the expected following bear market. To see an illustration of this future divergence monthly charts should be viewed.
FIRST WAVE COUNT
WEEKLY CHART
Click chart to enlarge.
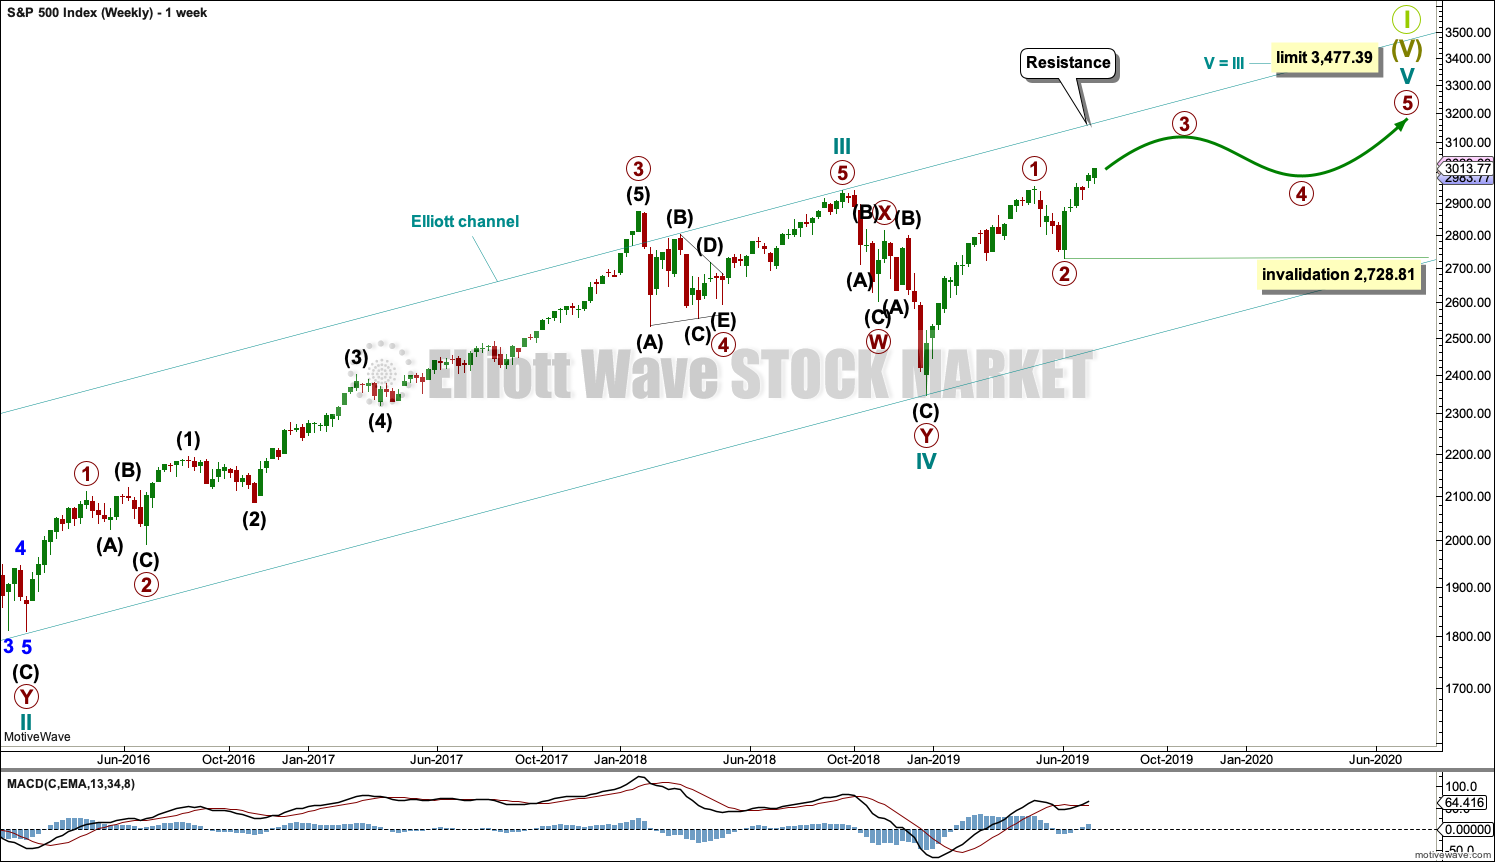
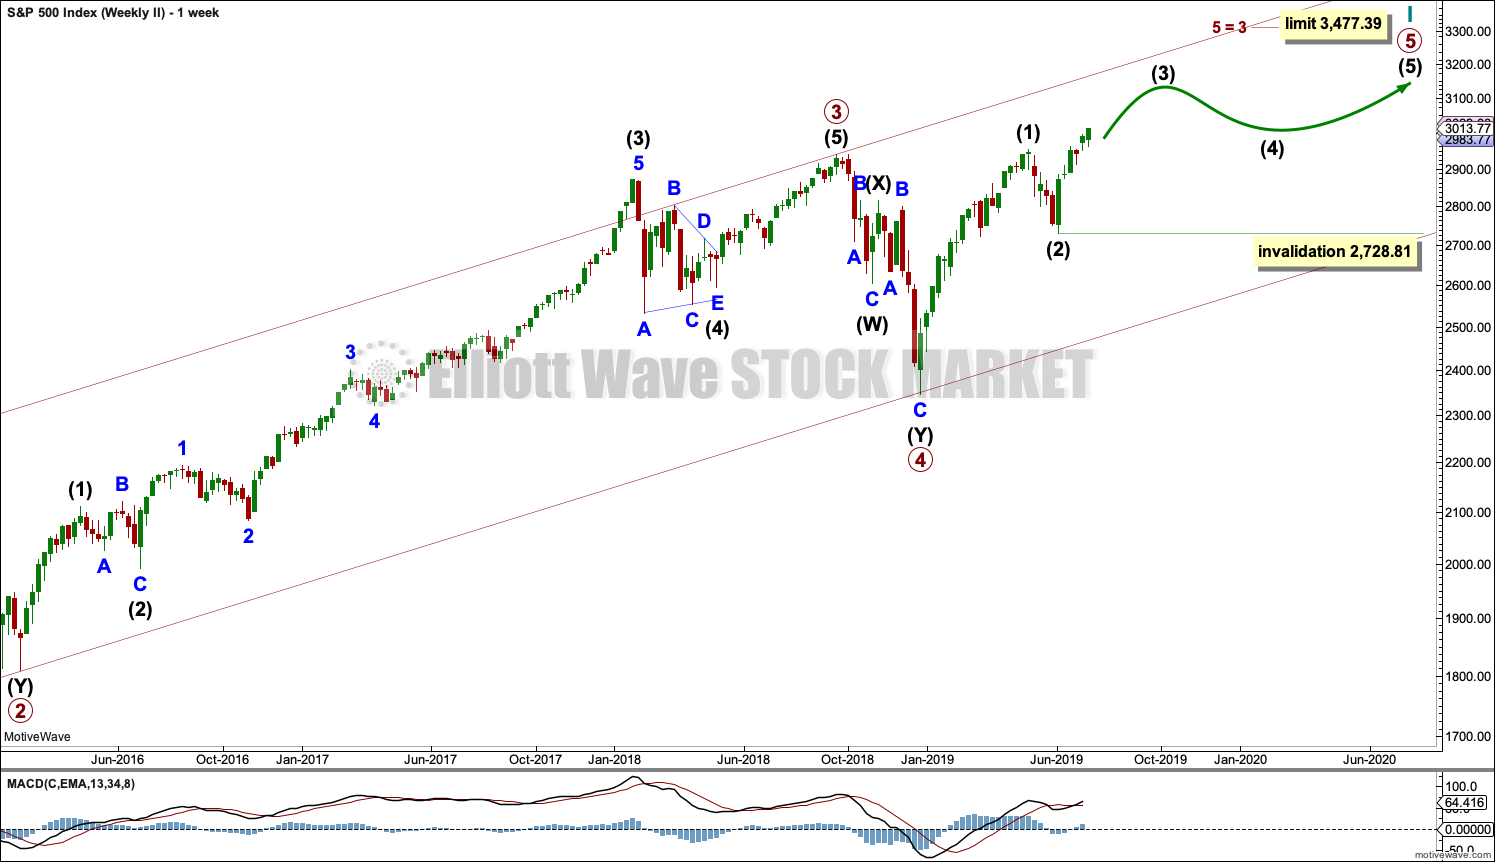
The basic Elliott wave structure consists of a five wave structure up followed by a three wave structure down (for a bull market). This wave count sees the bull market beginning in March 2009 as an incomplete five wave impulse and now within the last fifth wave, which is labelled cycle wave V. This impulse is best viewed on monthly charts. The weekly chart focusses on the end of it.
Elliott wave is fractal. This fifth wave labelled cycle wave V may end a larger fifth wave labelled Super Cycle wave (V), which may end a larger first wave labelled Grand Super Cycle wave I.
The teal Elliott channel is drawn using Elliott’s first technique about the impulse of Super Cycle wave (V). Draw the first trend line from the end of cycle wave I (off to the left of the chart, the weekly candlestick beginning 30th November 2014) to the end of cycle wave III, then place a parallel copy on the end of cycle wave II. This channel perfectly shows where cycle wave IV ended at support. The strongest portion of cycle wave III, the end of primary wave 3, overshoots the upper edge of the channel. This is a typical look for a third wave and suggests the channel is drawn correctly and the way the impulse is counted is correct.
Within Super Cycle wave (V), cycle wave III is shorter than cycle wave I. A core Elliott wave rule states that a third wave may never be the shortest. For this rule to be met in this instance, cycle wave V may not be longer in length than cycle wave III. This limit is at 3,477.39.
The structure of cycle wave V is focussed on at the daily chart level below.
Within cycle wave V, primary waves 1 and 2 may now be complete. Within primary wave 3, no second wave correction may move beyond its start below 2,728.81.
In historic analysis, two further monthly charts have been published that do not have a limit to upwards movement and are more bullish than this wave count. Members are encouraged to consider those possibilities (links below summary) alongside the wave counts presented on a daily and weekly basis.
Daily charts below will now focus on price movement from the high of primary wave 1.
DAILY CHART
Click chart to enlarge.
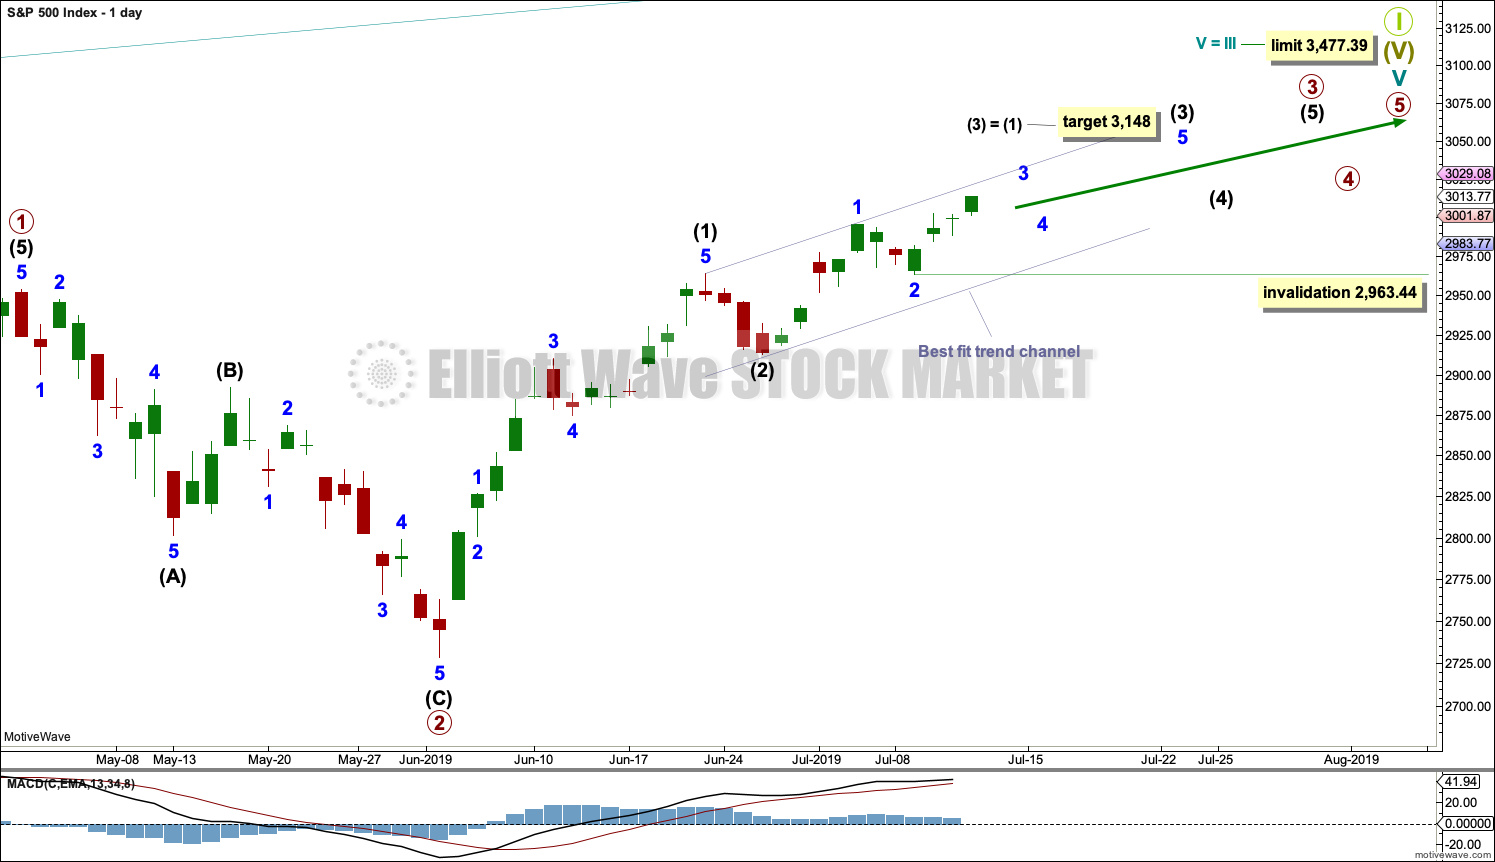
Cycle wave V must subdivide as a five wave motive structure. Within that five wave structure, primary waves 1 and 2 may be complete.
Primary wave 3 must move above the end of primary wave 1 (this rule has now been met). Primary wave 3 may only subdivide as an impulse.
Within the impulse of primary wave 3, intermediate waves (1) and (2) may both be complete.
Intermediate wave (3) may be about halfway through. Intermediate wave (3) may only subdivide as an impulse. Within the impulse, minor waves 1 and 2 may be complete. Within minor wave 3, no second wave correction may move beyond its start below 2,963.44.
When primary wave 3 is over, then primary wave 4 may be a shallow sideways consolidation.
Thereafter, primary wave 5 should move above the end of primary wave 3 to avoid a truncation.
Primary wave 1 lasted 86 sessions, 3 short of a Fibonacci 89. Primary wave 2 lasted 22 sessions, 1 longer than a Fibonacci 21. Primary wave 3 may end about a Fibonacci 55 sessions, give or take two or three sessions either side. This is a rough guideline only.
So far primary wave 3 has lasted 28 sessions.
Draw the best fit channel to contain all of intermediate wave (3). Draw the first trend line from the end of intermediate wave (1) to the end of minor wave 1, then place a parallel copy on the low labelled intermediate wave (2). Copy this channel over to the hourly chart.
FIRST HOURLY CHART
Click chart to enlarge.
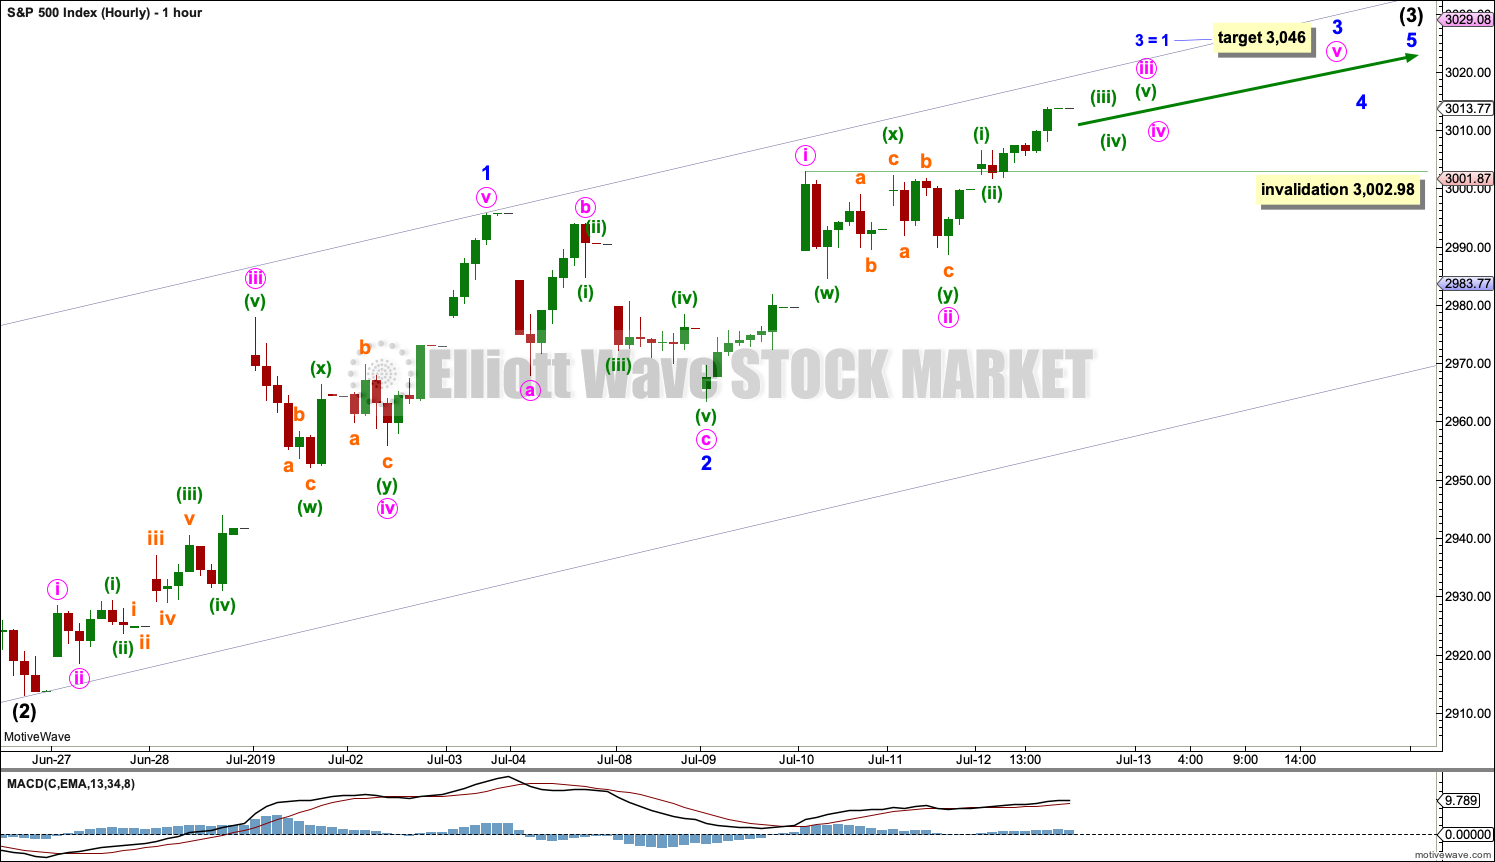
Both hourly charts are identical up to the low labelled minor wave 2. Thereafter, they look at the structure of minor wave 3 in two different ways. Neither count is favoured.
The middle of intermediate wave (3) may unfold early next week. An increase in upwards momentum may be expected.
Within the middle of this third wave, minute wave iv may not move into minute wave i price territory below 3,002.98.
SECOND HOURLY CHART
Click chart to enlarge.
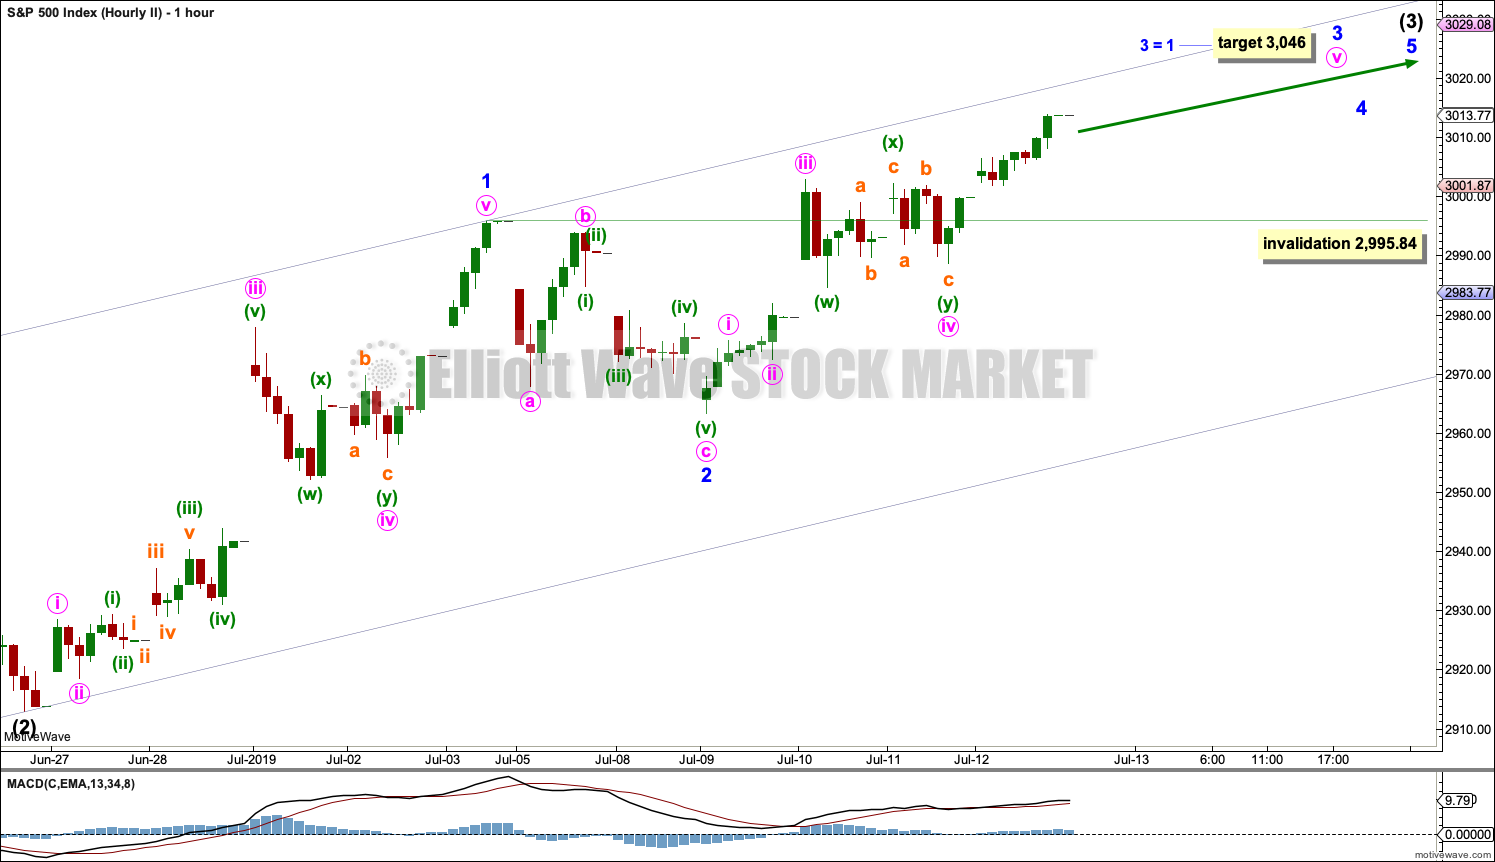
The middle of intermediate wave (3) may already have passed.
Within minor wave 3, minute waves i through to iv may be complete. Minute wave v may be extended.
Minor wave 4 may not move into minor wave 1 price territory below 2,995.84.
SECOND WAVE COUNT
WEEKLY CHART
Click chart to enlarge.
This weekly chart is almost identical to the first weekly chart, with the sole exception being the degree of labelling.
This weekly chart moves the degree of labelling for the impulse beginning in March 2009 all down one degree. This difference is best viewed on monthly charts.
The impulse is still viewed as nearing an end; a fifth wave is still seen as needing to complete higher. This wave count labels it primary wave 5.
TECHNICAL ANALYSIS
WEEKLY CHART
Click chart to enlarge. Chart courtesy of StockCharts.com.
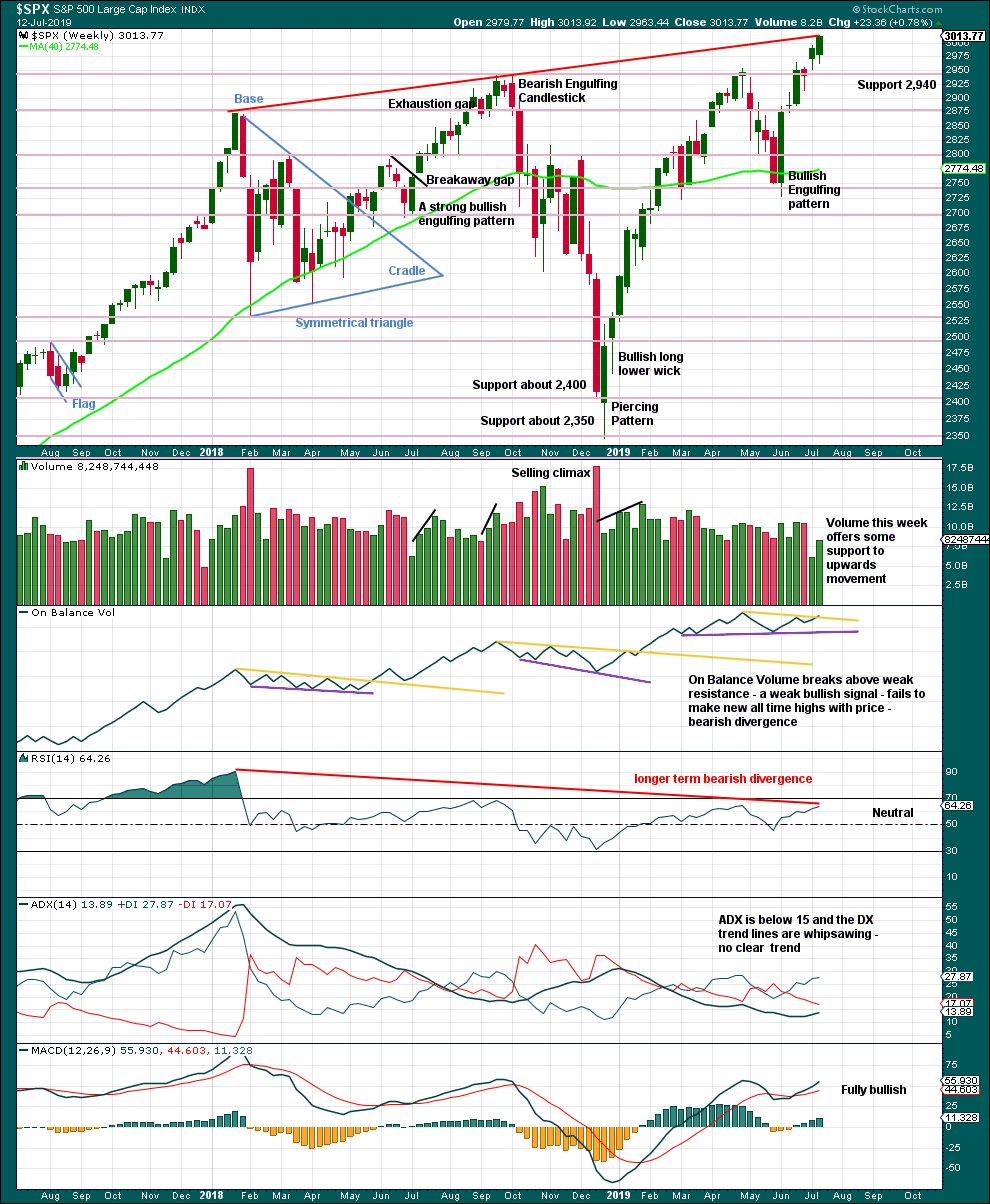
Price has closed near the high for the week and volume supports upwards movement. This suggests more upwards movement next week.
Longer-term bearish divergence between price and RSI fits the Elliott wave count: the most extreme reading from RSI corresponds with the end of a third wave, and now a fifth wave at cycle or primary degree exhibits some weakness compared to the third wave.
DAILY CHART
Click chart to enlarge. Chart courtesy of StockCharts.com.
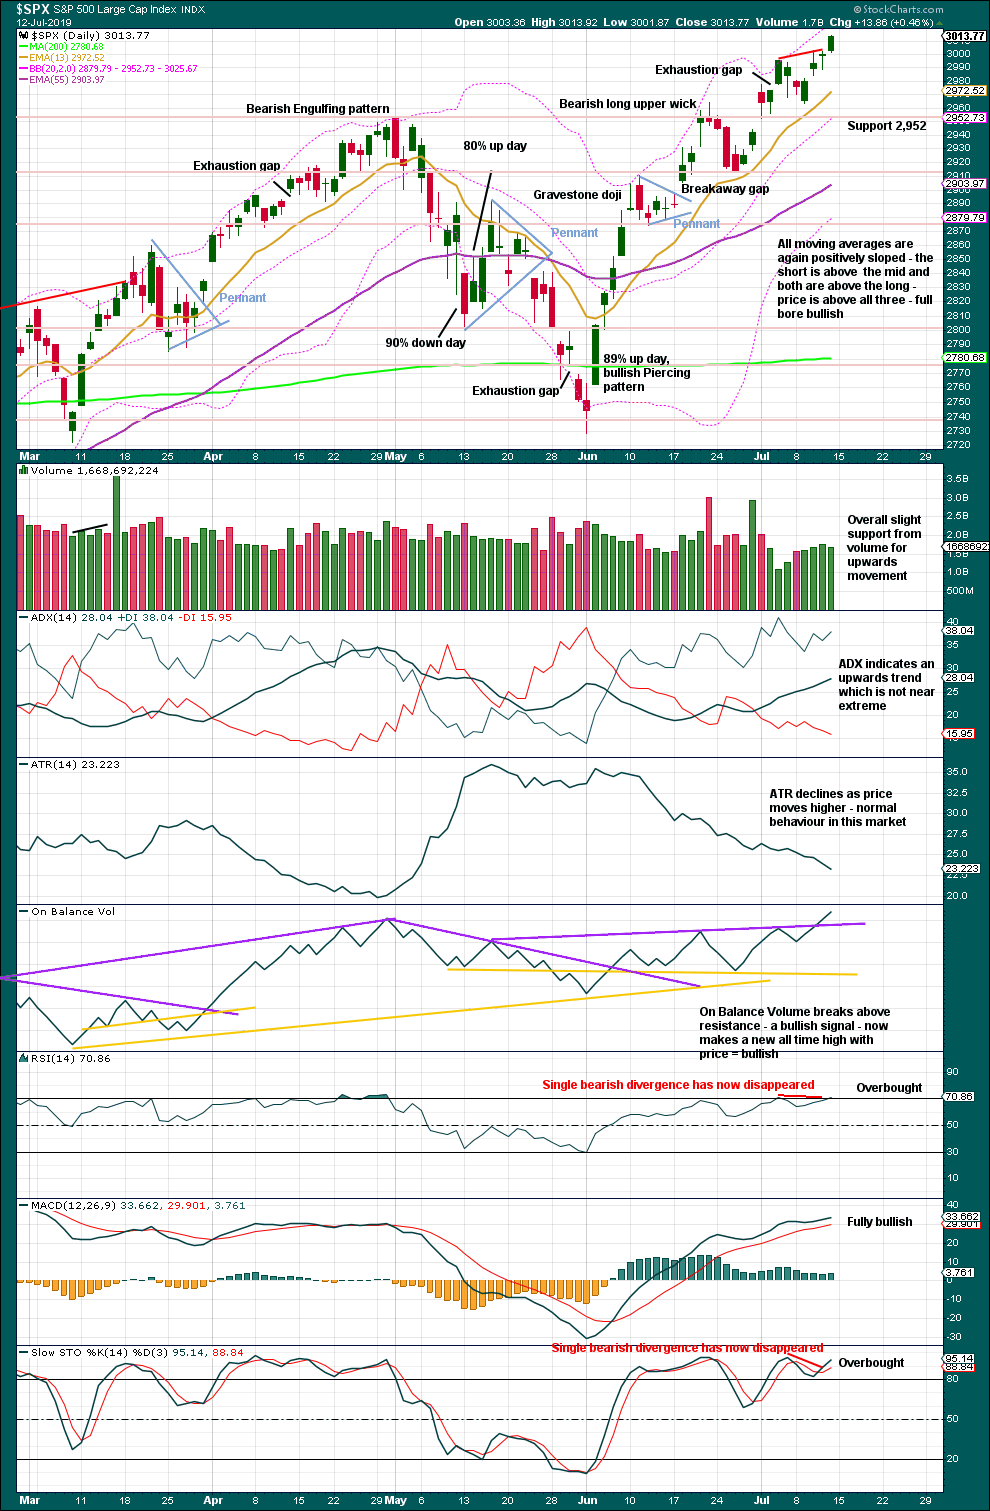
A close near the high for Friday suggests more upwards movement next week.
There is an upwards trend in place, which is not yet extreme, and there is room for the trend to continue a fair amount further. When this market trends, RSI and Stochastics may reach overbought and may remain there for extended periods of time. Sometimes divergence may develop and then simply disappear.
Look for resistance at round number pivots or Elliott wave targets.
BREADTH – AD LINE
WEEKLY CHART
Click chart to enlarge. Chart courtesy of StockCharts.com. So that colour blind members are included, bearish signals
will be noted with blue and bullish signals with yellow.
Bear markets from the Great Depression and onwards have been preceded by an average minimum of 4 months divergence between price and the AD line with only two exceptions in 1946 and 1976. With the AD line making new all time highs again this week, the end of this bull market and the start of a new bear market is very likely a minimum of 4 months away, which is mid November 2019.
In all bear markets in the last 90 years there is some positive correlation (0.6022) between the length of bearish divergence and the depth of the following bear market. No to little divergence is correlated with more shallow bear markets. Longer divergence is correlated with deeper bear markets.
If a bear market does develop here, it comes after no bearish divergence. It would therefore more likely be shallow.
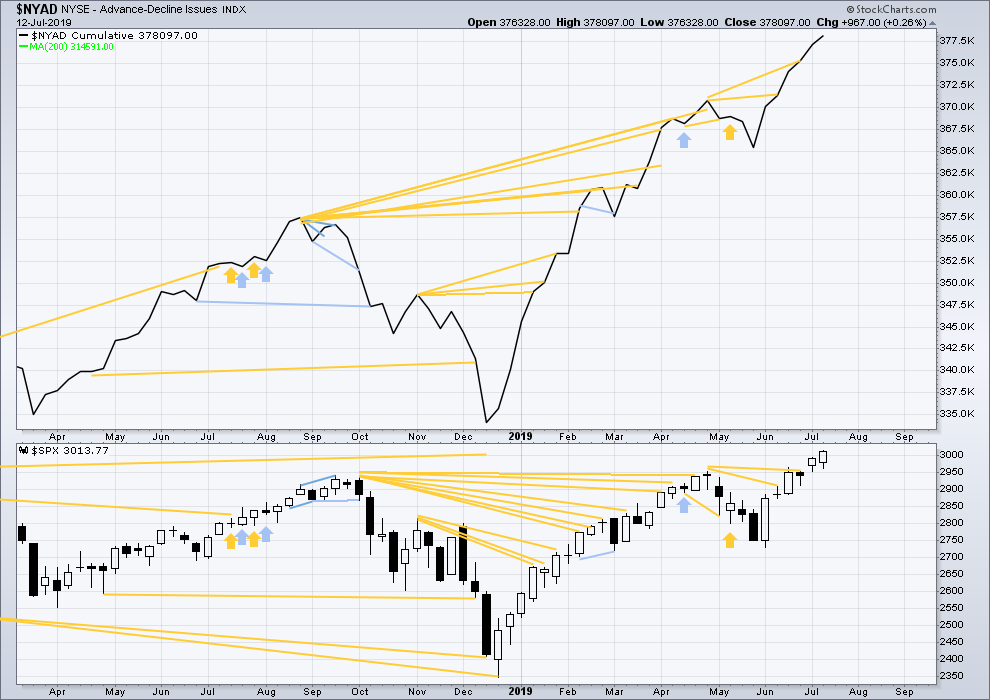
This week the AD line again makes new all time highs with price. Upwards movement has good support from rising market breadth, indicating a healthy bull market.
Mid caps remain below their all time high of 24th April 2019, and small caps remain below their all time high of 25th February 2019. Weakness is beginning to develop in small caps and mid caps. This is normal behaviour during the later stages of a bull market, and may be expected to develop further before the bull market may end. Tops are a process and that process may last months to even years.
DAILY CHART
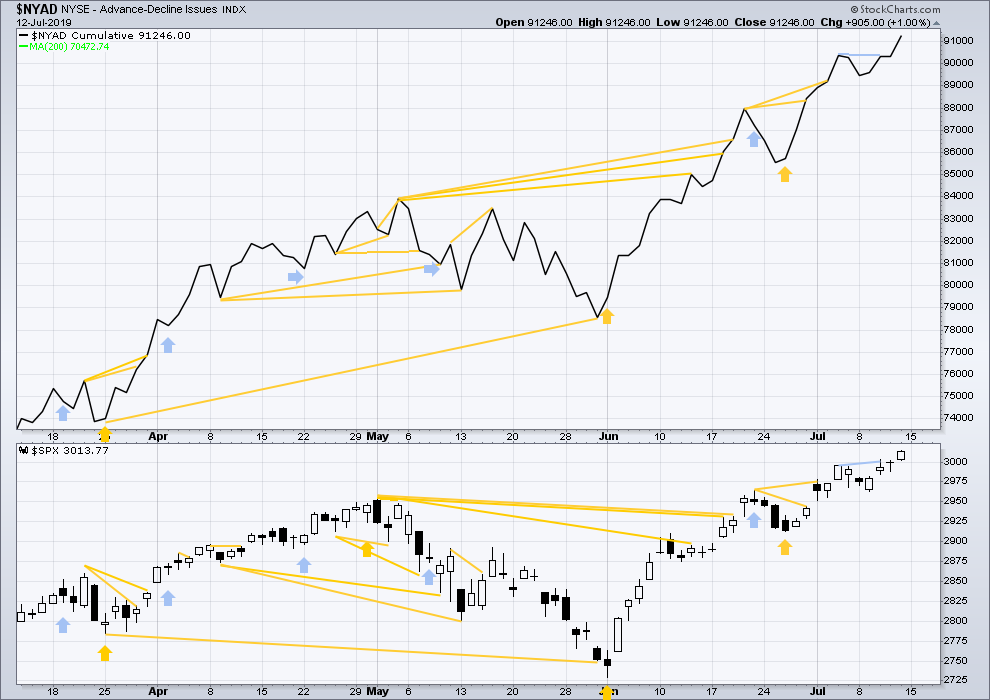
Click chart to enlarge. Chart courtesy of StockCharts.com. So that colour blind members are included, bearish signals
will be noted with blue and bullish signals with yellow.
Breadth should be read as a leading indicator.
New all time highs from both price and the AD line on Friday indicate the bull market has support from rising market breadth. This is bullish.
VOLATILITY – INVERTED VIX CHART
WEEKLY CHART
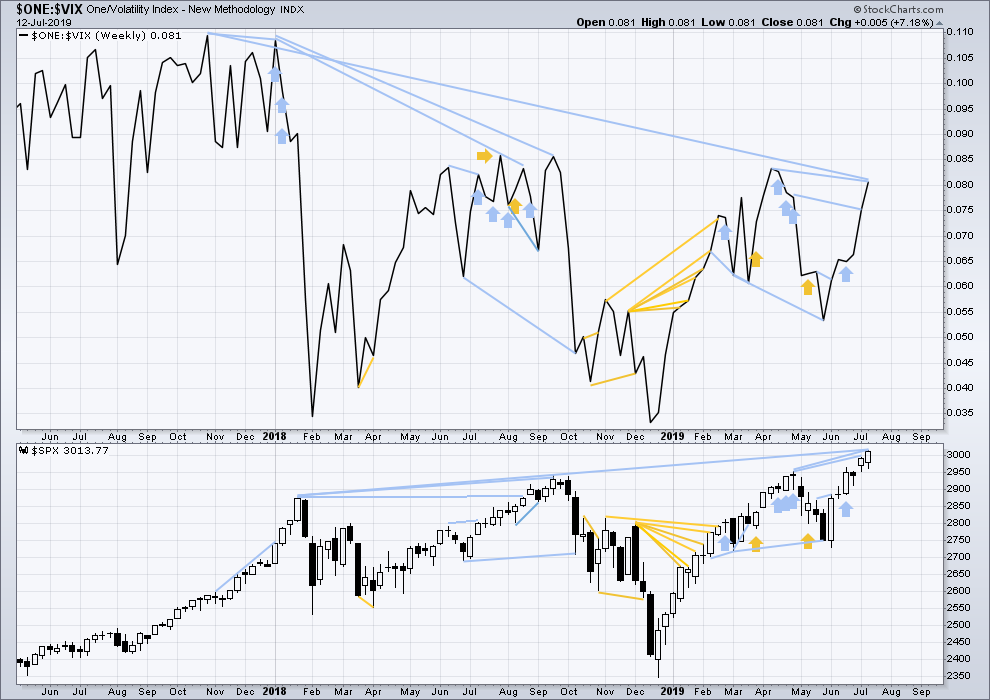
Click chart to enlarge. Chart courtesy of StockCharts.com. So that colour blind members are included, bearish signals
will be noted with blue and bullish signals with yellow.
The all time high for inverted VIX (which is the same as the low for VIX) was on 30th October 2017. There is now nearly one year and eight months of bearish divergence between price and inverted VIX.
The rise in price is not coming with a normal corresponding decline in VIX; VIX remains elevated. This long-term divergence is bearish and may yet develop further as the bull market matures.
This divergence may be an early warning, a part of the process of a top developing that may take years. It may not be useful in timing a trend change.
DAILY CHART
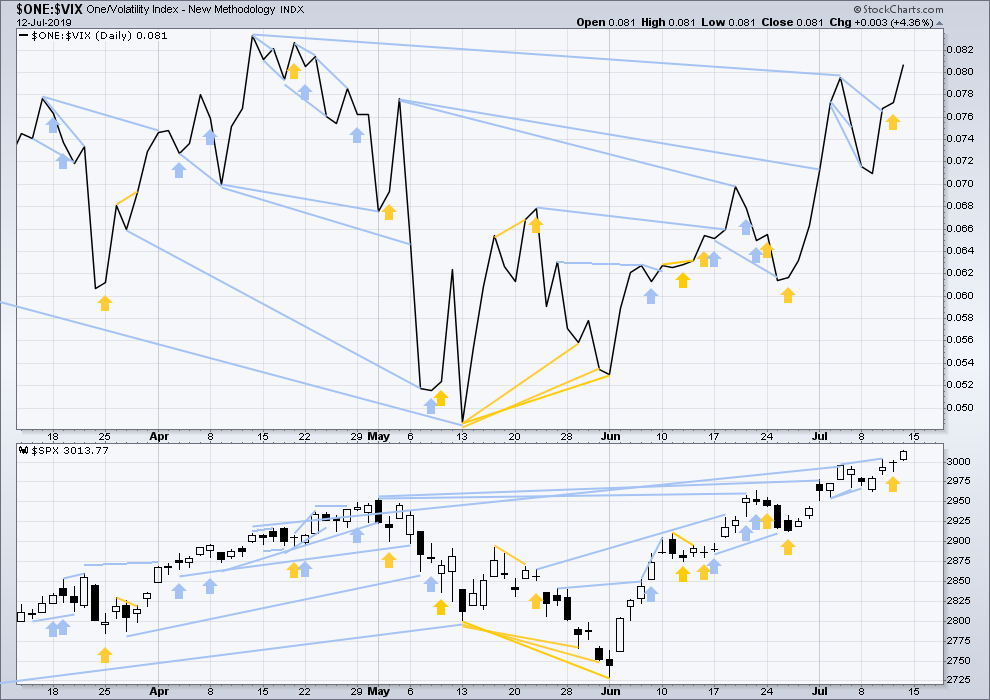
Click chart to enlarge. Chart courtesy of StockCharts.com. So that colour blind members are included, bearish signals
will be noted with blue and bullish signals with yellow.
Short-term bearish divergence has not been followed by any downwards movement in price, so it is considered to have failed.
Mid and longer-term bearish divergence between price and inverted VIX remains.
DOW THEORY
Dow Theory confirmed a bear market in December 2018. This does not necessarily mean a bear market at Grand Super Cycle degree though; Dow Theory makes no comment on Elliott wave counts. On the 25th of August 2015 Dow Theory also confirmed a bear market. The Elliott wave count sees that as part of cycle wave II. After Dow Theory confirmation of a bear market in August 2015, price went on to make new all time highs and the bull market continued.
DJIA: 23,344.52 – a close on the 19th of December at 23,284.97 confirms a bear market.
DJT: 9,806.79 – price has closed below this point on the 13th of December.
S&P500: 2,532.69 – a close on the 19th of December at 2,506.96 provides support to a bear market conclusion.
Nasdaq: 6,630.67 – a close on the 19th of December at 6,618.86 provides support to a bear market conclusion.
With all the indices having moved higher following a Dow Theory bear market confirmation, Dow Theory would confirm a bull market if the following highs are made:
DJIA: 26,951.81 – a close above this point has been made on the 3rd of July 2019.
DJT: 11,623.58 – to date DJT has failed to confirm an ongoing bull market.
S&P500: 2,940.91 – a close above this point was made on the 29th of April 2019.
Nasdaq: 8,133.30 – a close above this point was made on the 26th of April 2019.
Published @ 12:28 a.m. EST on July 13, 2019.
—
Careful risk management protects your trading account(s).
Follow my two Golden Rules:
1. Always trade with stops.
2. Risk only 1-5% of equity on any one trade.
—
New updates to this analysis are in bold.
First hourly chart updated:
Today this one has a better look, so far.
Target and invalidation point remain the same.
Put on an overhead butterfly for Friday in IWM a week ago.
I need a symmetric move on Wed-Fri to the one from 3 weeks before that, marked. Into my happy zone.
This is hourly, quite a drawn out flag pattern. “Should” break to the upside soon…
For anyone/everyone who uses Thinkorswim, I finally (doh!) put my MVTI tool (visual trend coloring) on the shared public area there. You can load it with this URL from inside TOS:
http://tos.mx/emEkmF
Personally, “I don’t trade without it…”
Found it Kevin, looks good
Thanks Debbie. Better now: just eliminated all those horrific ads!!
Lara,
It’s probably too early to call, but I’m wondering if we are seeing an ending diagonal for Cycle Wave 5.
Thanks,
Peter
It’s still possible, but yes, I agree that it’s too early to call.
I am keeping an open mind about this possibility. If overlapping begins to suggest it then I’ll publish it as an alternate, and would become a main if / when price tells us.
But with the data in hand right now, it looks less likely.
One thing to keep in mind about diagonals is their second and fourth waves are normally very deep. The common depth is from 0.66 to 0.81 the prior wave. So far there are no corrections within cycle wave V that are deeper than 0.5, they’re all really shallow. This is a big reason why so far I’ve not published and ending diagonal wave count.
I don’t know if this is valid or not but…looks legit to my amateur eye. I’ll throw it out there anyway. Leading diagonal in /ES, and a matching 2 complete and the 3 launching now…
BTW I’m putting stock set up info w/charts on my specktrading web site instead of cluttering things up here with non-SPX postings (and I don’t want to do it twice). So pop up a window there and check it out, I intend to have mostly daily updates on trade ideas.
SPX and it’s channel (hourly). Looks like a symmetric move back down as shown would be natural here.
does 4 overlap 1? for a diagonal it should.
diagonals normally have relatively deep 2nd and 4th waves; between 0.66 to 0.81. those look a bit shallow…
the main has price in a (iii) of a [iii] of a 3 of a (3) of a [3] of a V.
Wowza. “it’s not every day….”
how about some high momentum, please?
I am back with a big #1 for the weekend.
No, I did not see any bears. I saw a fair amount of bear scat. But no bears.
I leave tomorrow as I am taking some high school youth to a camp in the mountains where we will work with Americore serving residents of that area. We do work on homes of low income and needy people such as painting, roofing, interior cleaning etc. Whatever they nee done, we do.
When I return, I’ll be home for two days and then leave with my wife and two granddaughters for two weeks on the coast in the Pacific Northwest of America.
So I am glad to get a #1 spot today.
The bears are in hiding Rodney! 🙂
Enjoy your time with family. I think the markets will be relatively stable while you’re gone.