
A small Doji candlestick today completes an inside day.
Summary: The bull market is expected to continue and corrections are expected to be shallow.
A pullback looks still most likely to continue from here. It may find support at the lower edge of the best fit channel, or it may reach down about 2,933 to 2,930.
An alternate chart is published that expects strong upwards movement from here, but it still has less support from classic technical analysis. If price gaps up tomorrow and the gap remains open, and there is any strength in upwards movement, then this may become the main wave count.
The biggest picture, Grand Super Cycle analysis, is here.
Monthly charts were last published here, with video here. There are two further alternate monthly charts here, with video here.
ELLIOTT WAVE COUNTS
The two Elliott wave counts below will be labelled First and Second. They may be about of even probability. When the fifth wave currently unfolding on weekly charts may be complete, then these two wave counts will diverge on the severity of the expected following bear market. To see an illustration of this future divergence monthly charts should be viewed.
FIRST WAVE COUNT
WEEKLY CHART
Click chart to enlarge.
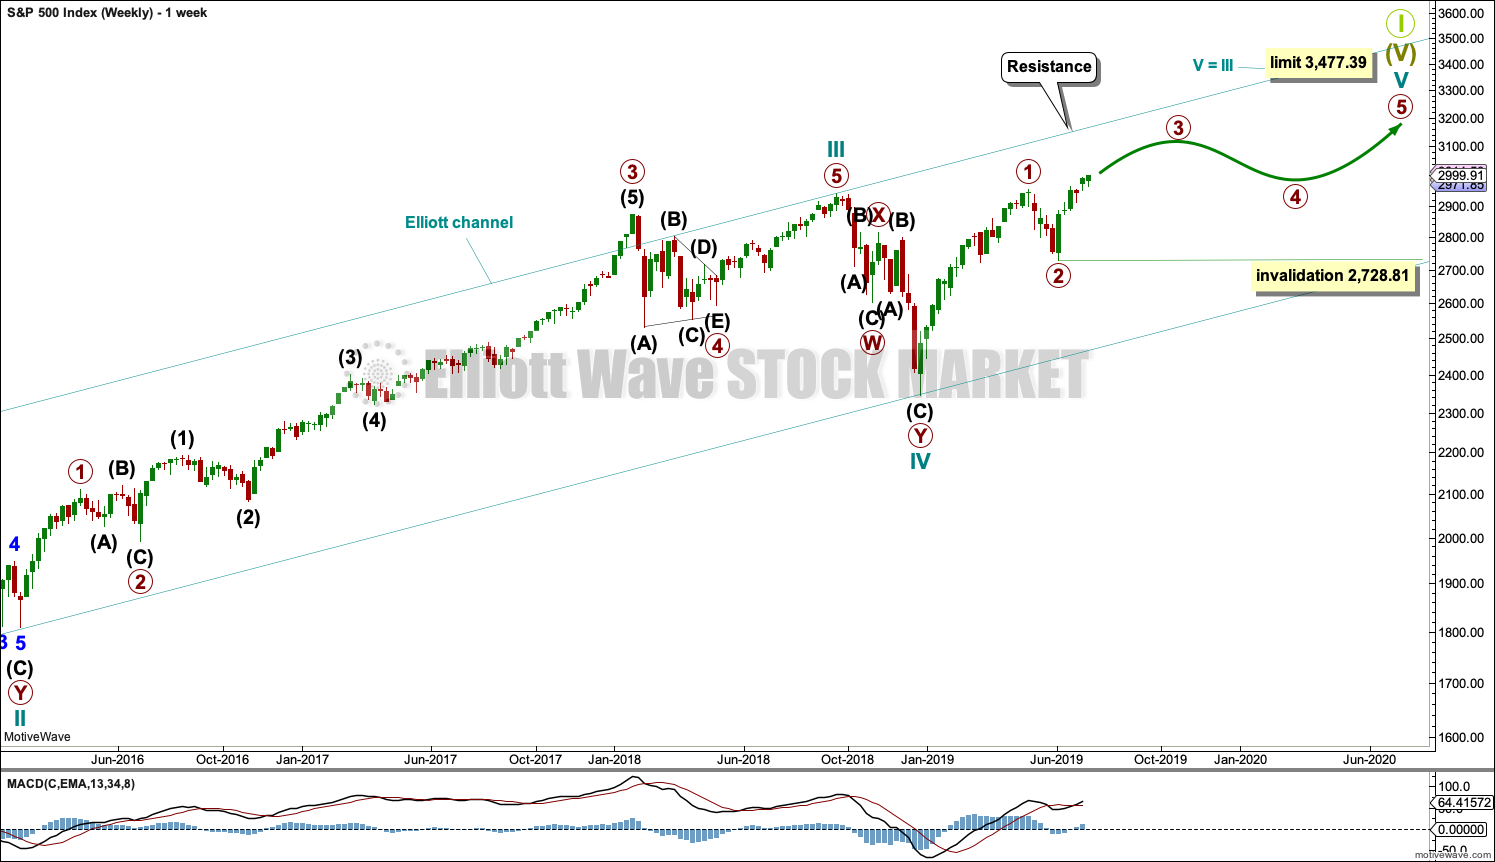
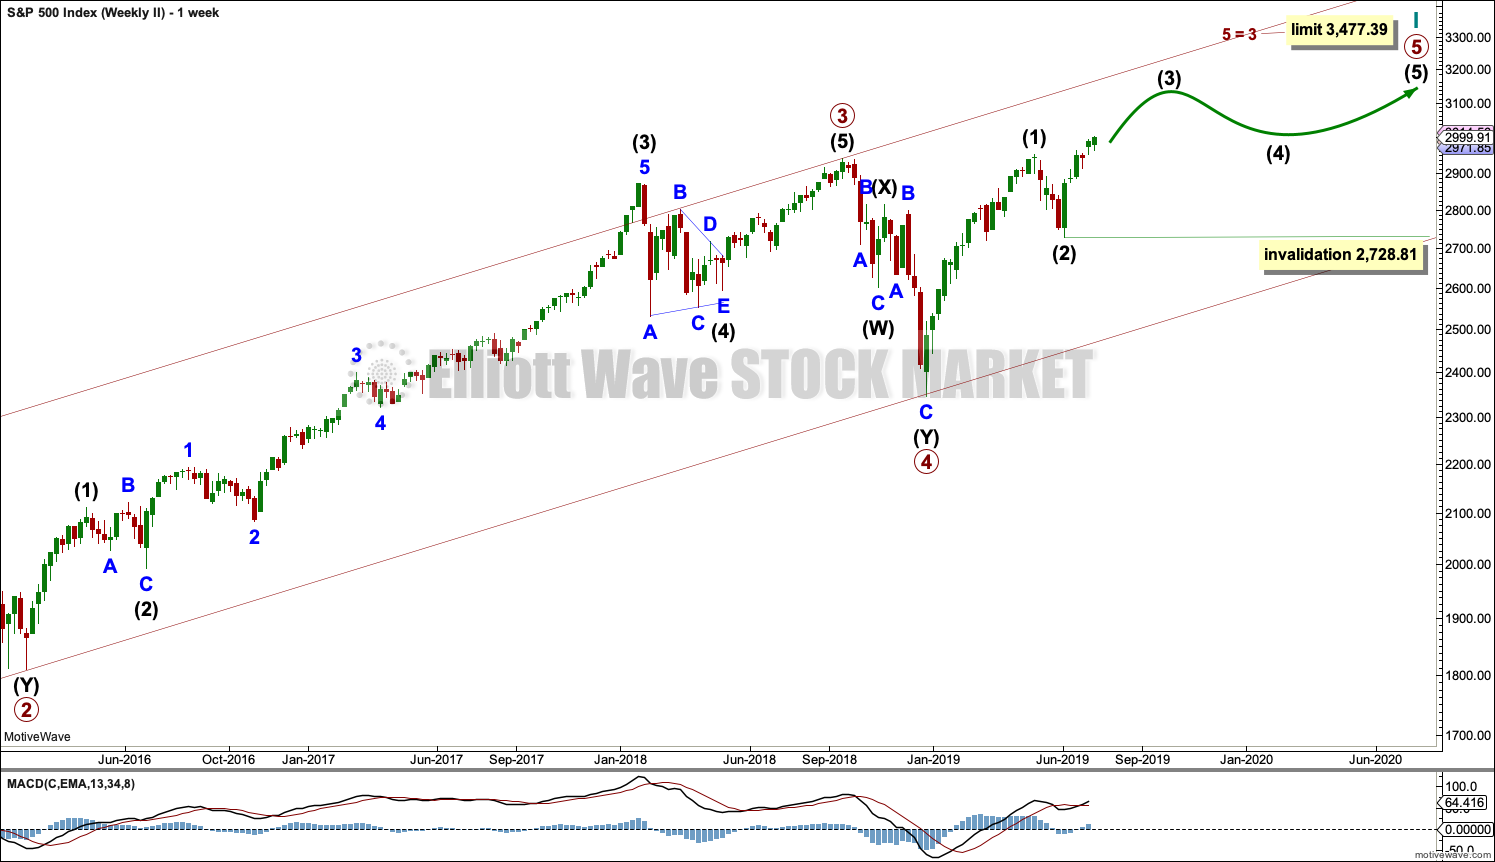
The basic Elliott wave structure consists of a five wave structure up followed by a three wave structure down (for a bull market). This wave count sees the bull market beginning in March 2009 as an incomplete five wave impulse and now within the last fifth wave, which is labelled cycle wave V. This impulse is best viewed on monthly charts. The weekly chart focusses on the end of it.
Elliott wave is fractal. This fifth wave labelled cycle wave V may end a larger fifth wave labelled Super Cycle wave (V), which may end a larger first wave labelled Grand Super Cycle wave I.
The teal Elliott channel is drawn using Elliott’s first technique about the impulse of Super Cycle wave (V). Draw the first trend line from the end of cycle wave I (off to the left of the chart, the weekly candlestick beginning 30th November 2014) to the end of cycle wave III, then place a parallel copy on the end of cycle wave II. This channel perfectly shows where cycle wave IV ended at support. The strongest portion of cycle wave III, the end of primary wave 3, overshoots the upper edge of the channel. This is a typical look for a third wave and suggests the channel is drawn correctly and the way the impulse is counted is correct.
Within Super Cycle wave (V), cycle wave III is shorter than cycle wave I. A core Elliott wave rule states that a third wave may never be the shortest. For this rule to be met in this instance, cycle wave V may not be longer in length than cycle wave III. This limit is at 3,477.39.
The structure of cycle wave V is focussed on at the daily chart level below.
Within cycle wave V, primary waves 1 and 2 may now be complete. Within primary wave 3, no second wave correction may move beyond its start below 2,728.81.
In historic analysis, two further monthly charts have been published that do not have a limit to upwards movement and are more bullish than this wave count. Members are encouraged to consider those possibilities (links below summary) alongside the wave counts presented on a daily and weekly basis.
Daily charts below will now focus on price movement from the high of primary wave 1.
DAILY CHART
Click chart to enlarge.
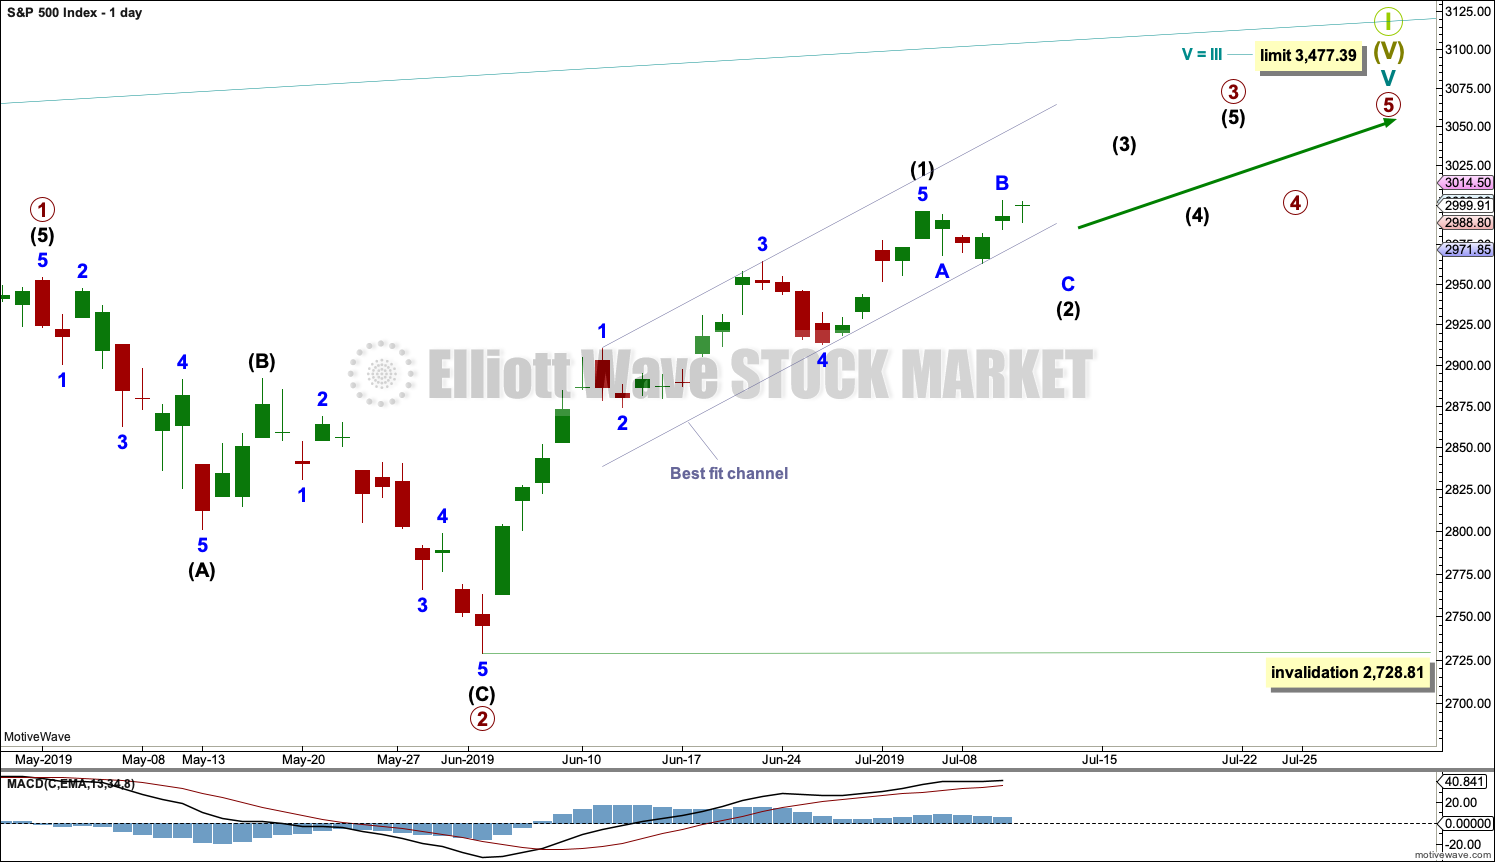
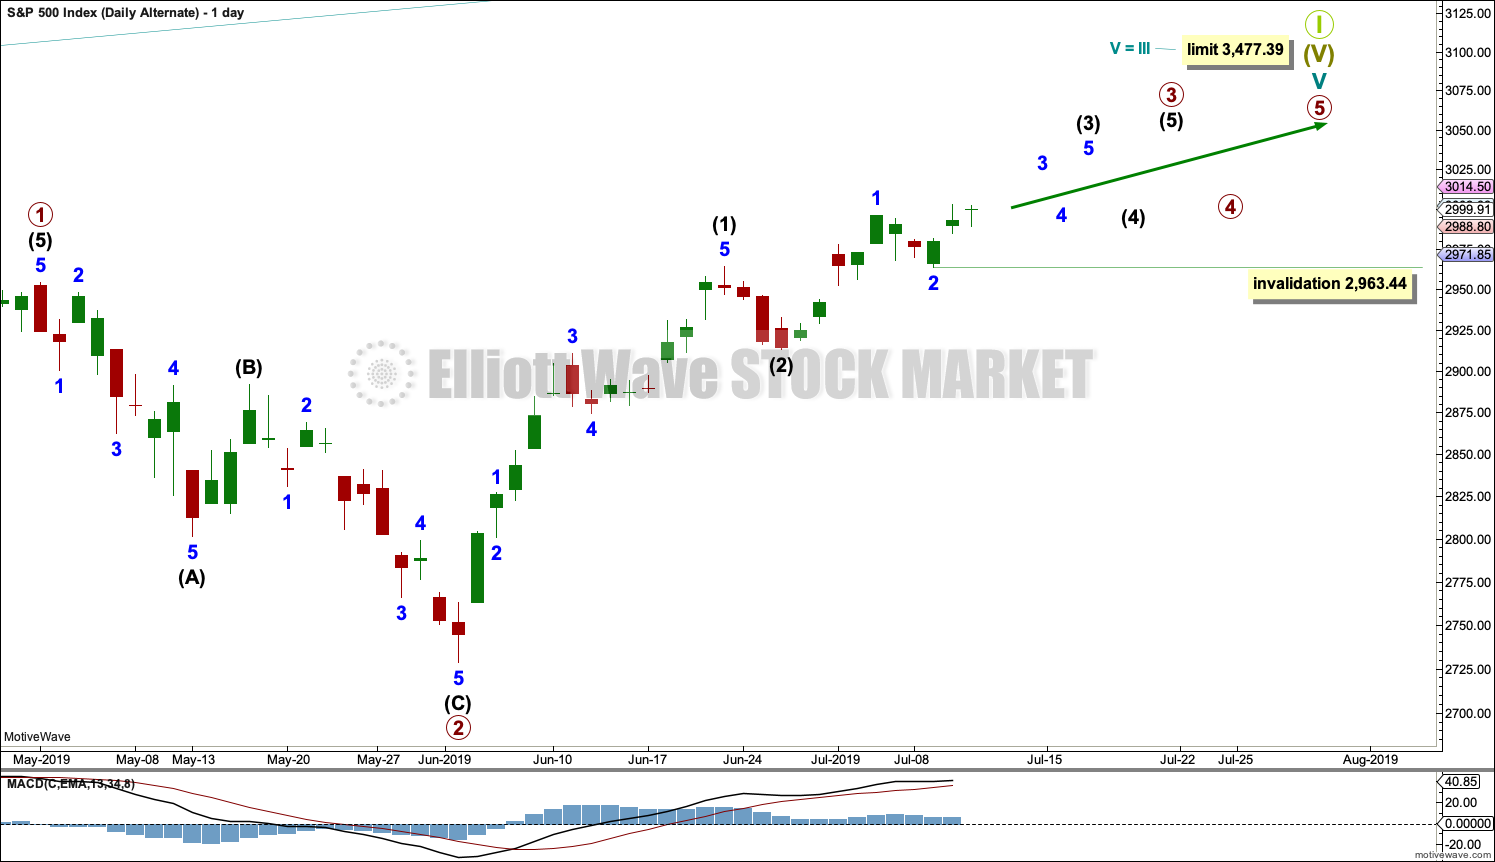
Cycle wave V must subdivide as a five wave motive structure. Within that five wave structure, primary waves 1 and 2 may be complete.
Primary wave 3 must move above the end of primary wave 1 (this rule has now been met). Primary wave 3 may only subdivide as an impulse.
Within the impulse of primary wave 3, only intermediate wave (1) may now be complete. Intermediate wave (2) may have begun. Intermediate wave (2) may not move beyond the start of intermediate wave (1) below 2,728.81.
When primary wave 3 is over, then primary wave 4 may be a shallow sideways consolidation.
Thereafter, primary wave 5 should move above the end of primary wave 3 to avoid a truncation.
Primary wave 1 lasted 86 sessions, 3 short of a Fibonacci 89. Primary wave 2 lasted 22 sessions, 1 longer than a Fibonacci 21. Primary wave 3 may end about a Fibonacci 55 sessions, give or take two or three sessions either side. This is a rough guideline only.
So far primary wave 3 has lasted 27 sessions.
Within primary wave 3, intermediate wave (1) lasted 22 sessions, 1 longer than a Fibonacci 21. Intermediate wave (2) may be more brief; it may last a Fibonacci 13 sessions. So far it has lasted 5.
Draw the best fit channel to contain all of intermediate wave (1). Draw the first trend line from the ends of minor waves 1 to 3, then place a parallel copy on the low labelled minor wave 4. Copy this channel over to the hourly chart.
Today two hourly charts below look at two possible corrective structures for intermediate wave (2). Both would be incomplete. Neither is favoured.
HOURLY CHART
Click chart to enlarge.
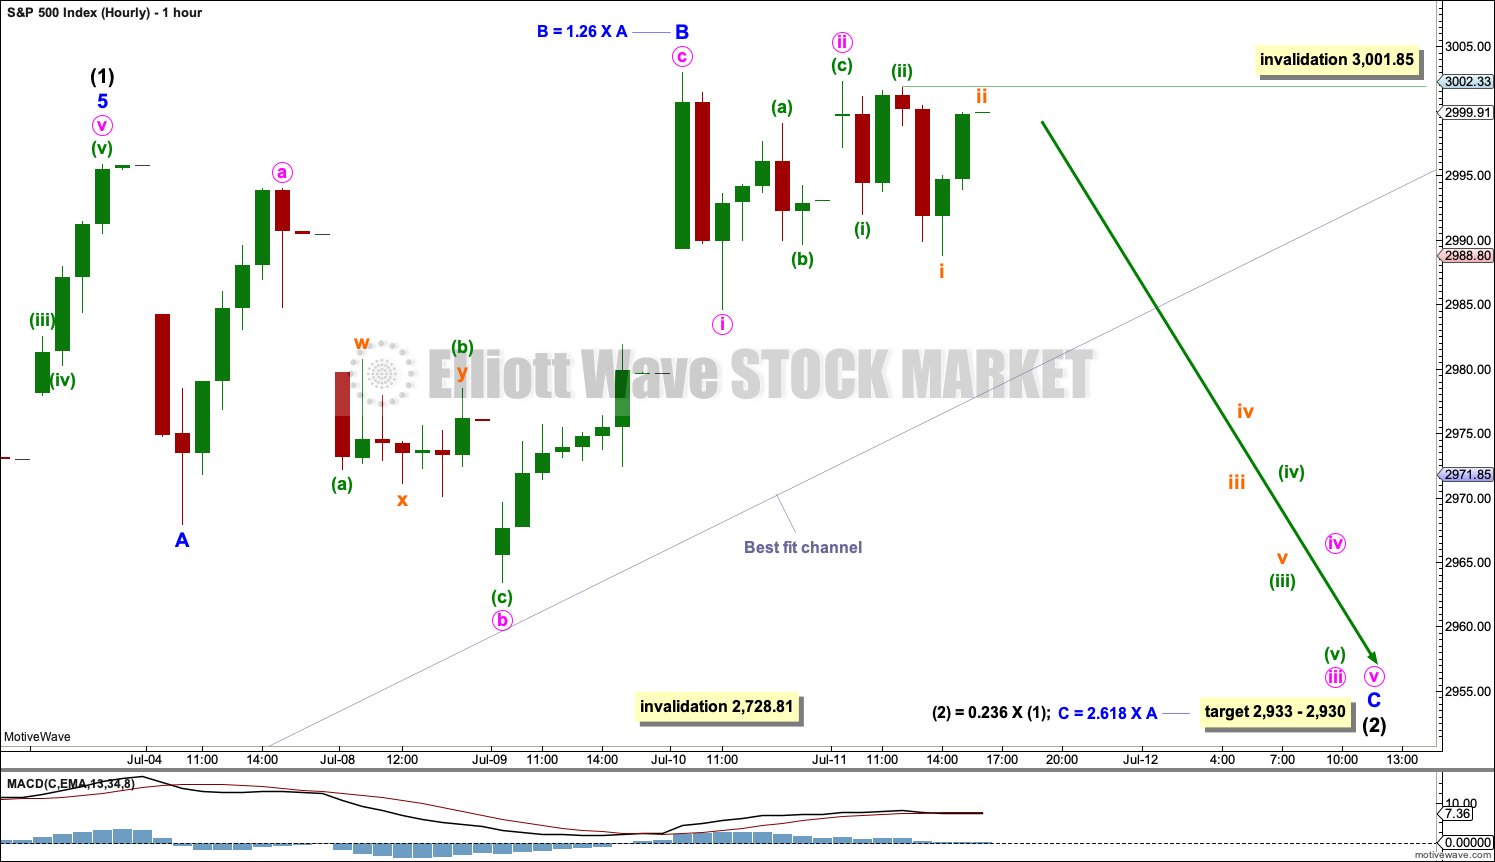
Intermediate wave (1) may be a long extension.
Intermediate wave (2) may be expected to be shallow. If the target of the 0.236 Fibonacci ratio at 2,933 is wrong, it may be too low. Intermediate wave (2) may subdivide as any Elliott wave corrective structure except a triangle. It would most likely be a zigzag, but it may also be a flat or combination.
Intermediate wave (2) may be subdividing as an expanded flat correction. Within intermediate wave (2), minor wave B may now be complete, ending within the most common range of from 1.00 to 1.38 times the length of minor wave A, and minor wave B itself subdivides as an expanded flat.
A target is calculated for minor wave C. If this target is wrong, it may be too low. Minor wave C may subdivide over about two weeks.
Within minor wave C, so far there may now be a series of three overlapping first and second waves complete. This wave count now expects an increase in downwards momentum for the short term as the middle of minor wave C unfolds.
Subminuette wave ii may not move beyond the start of subminuette wave i above 3,001.85.
SECOND HOURLY CHART
Click chart to enlarge.
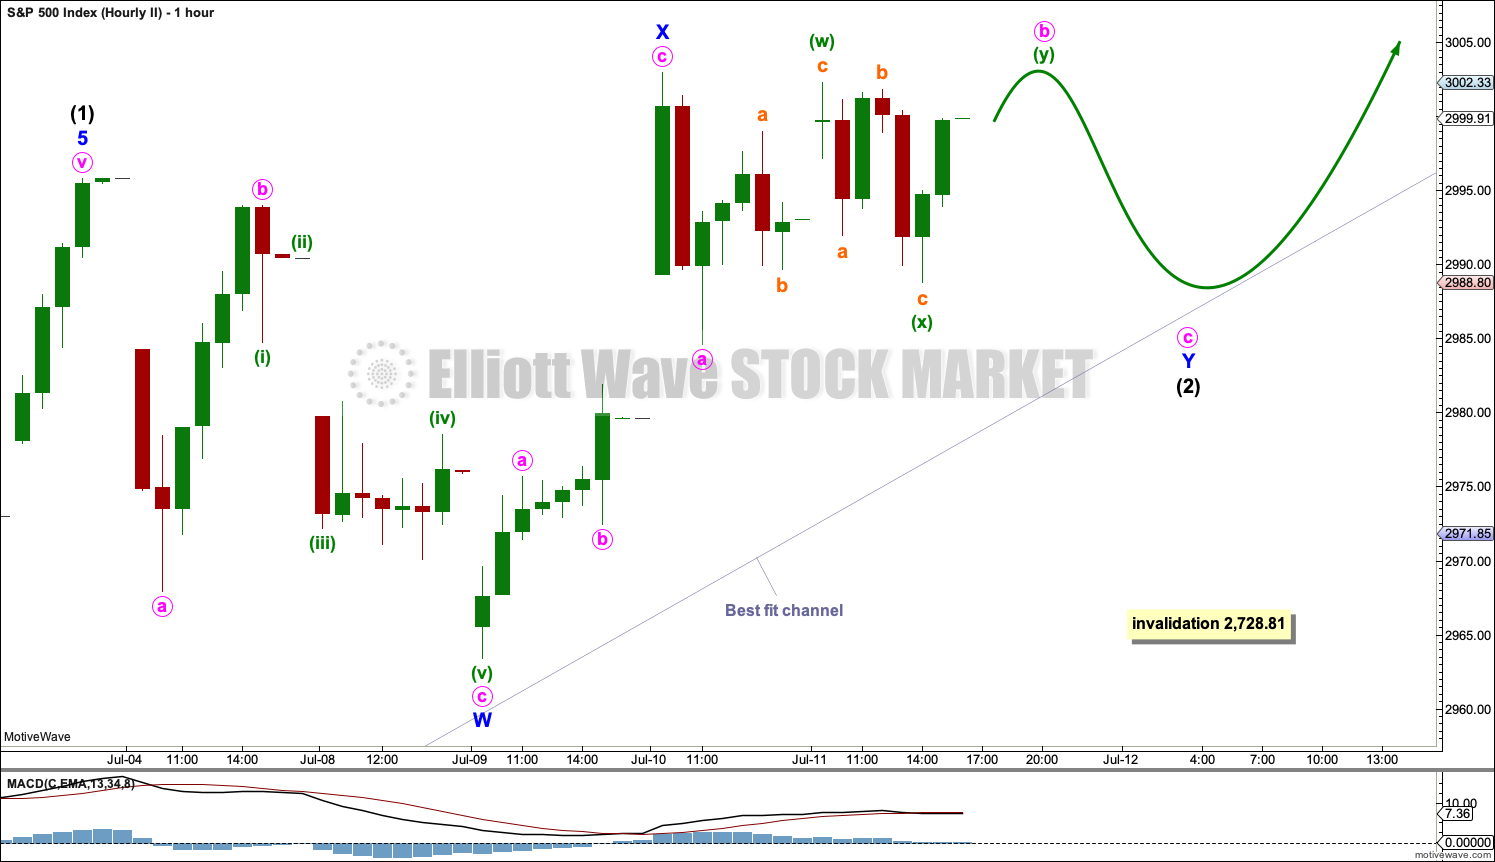
It is also possible that intermediate wave (2) may be unfolding sideways as a double combination.
The first structure in the possible double combination may now be a complete zigzag, labelled minor wave W.
The double may be joined by a three in the opposite direction, a zigzag labelled minor wave X. Minor wave X makes a new price extreme beyond the start of minor wave W; this is allowable and normal within a combination.
The second structure in a possible double combination may now be unfolding as a flat correction, labelled minor wave Y. Within minor wave Y, minute wave a may be complete and minute wave b may be an incomplete double zigzag or double combination. Minute wave b may make a new high above the start of minute wave a as in an expanded flat for minor wave Y. The normal range for minute wave b is from 1 to 1.38 times the length of minute wave a, giving a range from 3,002.98 to 3,009.96.
Minor wave Y may end about support at the lower edge of the best fit channel, which is copied over from the daily chart.
ALTERNATE DAILY CHART
Click chart to enlarge.
There is more than one way to label subdivisions within primary wave 3. It is also possible that intermediate waves (1) and (2) may both be over.
Intermediate wave (3) may only subdivide as an impulse. Within intermediate wave (3), minor waves 1 and 2 may be complete, and minor wave 3 may have moved above the end of minor wave 1.
Within minor wave 3, no second wave correction may move beyond the start of its first wave below 2,963.44.
This wave count now expects a strong increase in upwards momentum as a third wave at three degrees unfolds. If tomorrow moves price higher, with support from volume and strength, this may be the only wave count.
At this stage, there is some weakness evident in upwards movement. This wave count remains an alternate.
SECOND WAVE COUNT
WEEKLY CHART
Click chart to enlarge.
This weekly chart is almost identical to the first weekly chart, with the sole exception being the degree of labelling.
This weekly chart moves the degree of labelling for the impulse beginning in March 2009 all down one degree. This difference is best viewed on monthly charts.
The impulse is still viewed as nearing an end; a fifth wave is still seen as needing to complete higher. This wave count labels it primary wave 5.
TECHNICAL ANALYSIS
WEEKLY CHART
Click chart to enlarge. Chart courtesy of StockCharts.com.
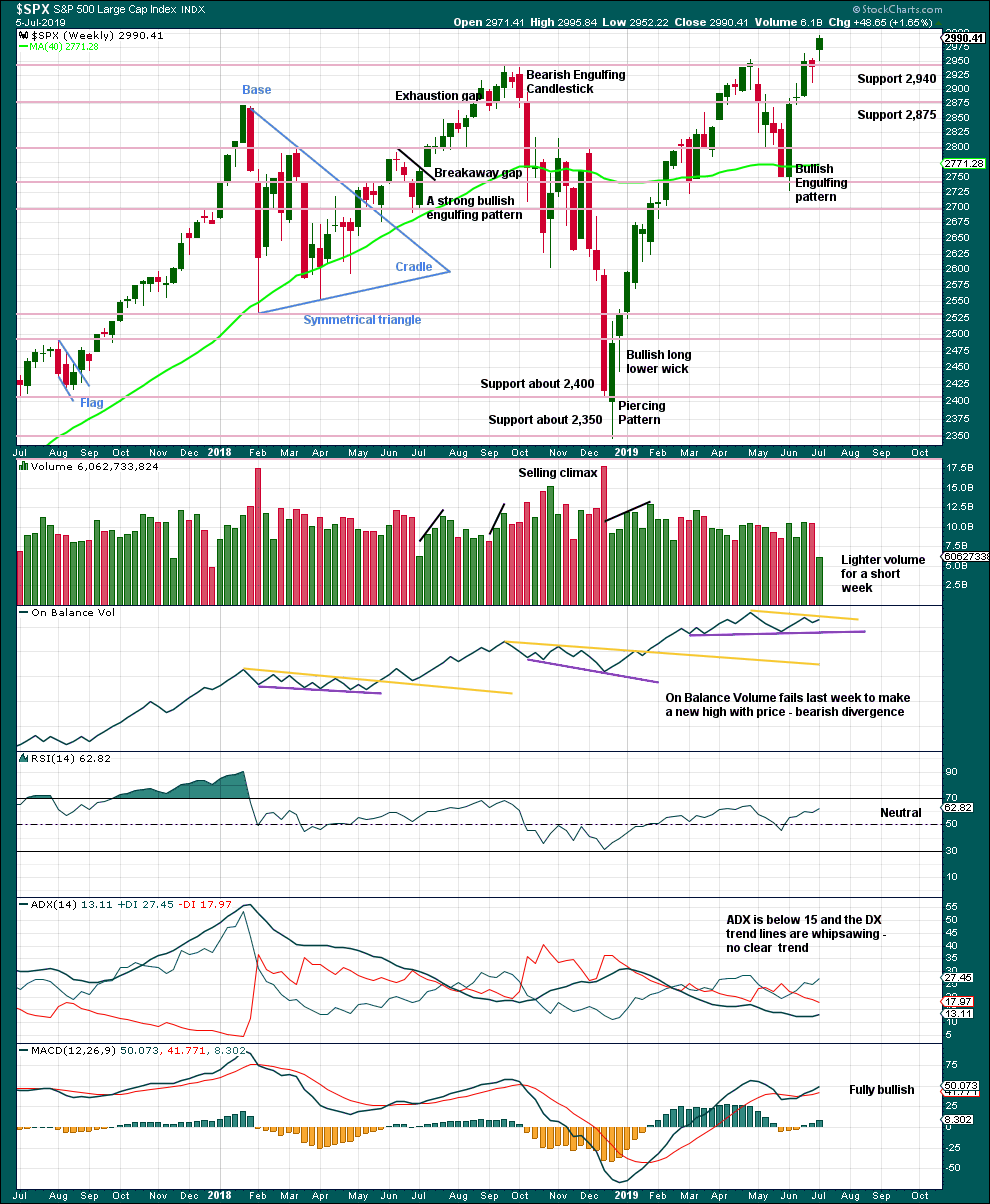
The long lower wick on the last weekly candlestick suggests more upwards movement this week.
DAILY CHART
Click chart to enlarge. Chart courtesy of StockCharts.com.
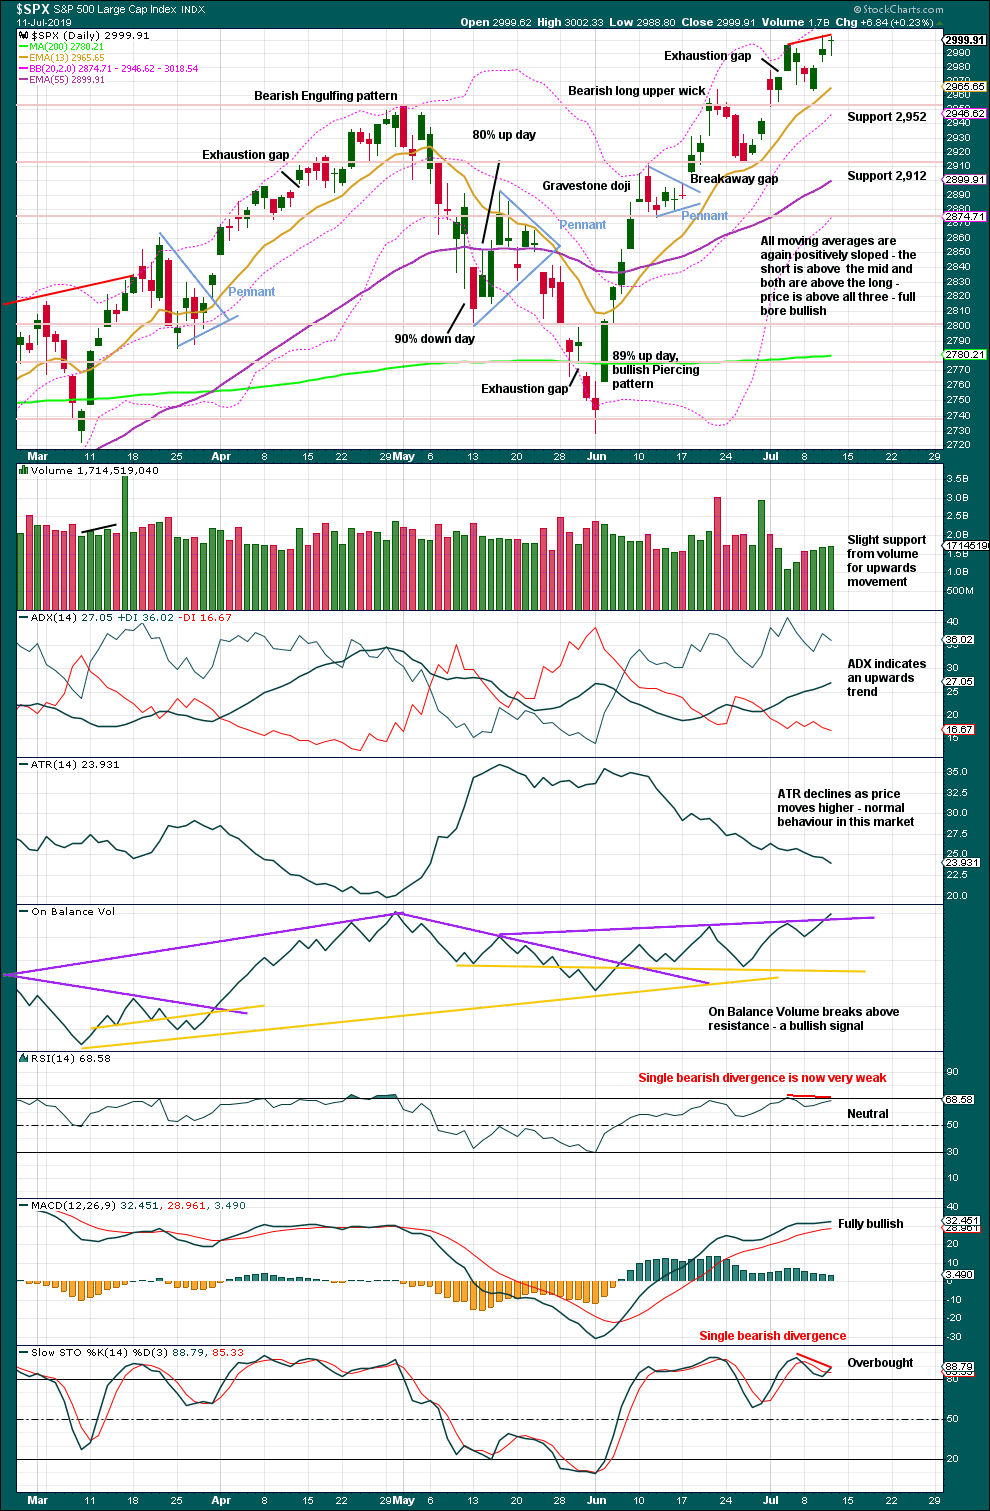
Today Lowry’s data shows some weakness in upwards movement: up volume was only 47% of total up/down volume, the % of stocks above their 10 day moving averages continues to fall, a decline in Buying Power, and an increase in Selling Pressure. This favours the main daily Elliott wave count.
However, volume slightly supports upwards movement and today On Balance Volume gives a bullish signal. This signal from On Balance Volume supports the alternate daily Elliott wave count.
BREADTH – AD LINE
WEEKLY CHART
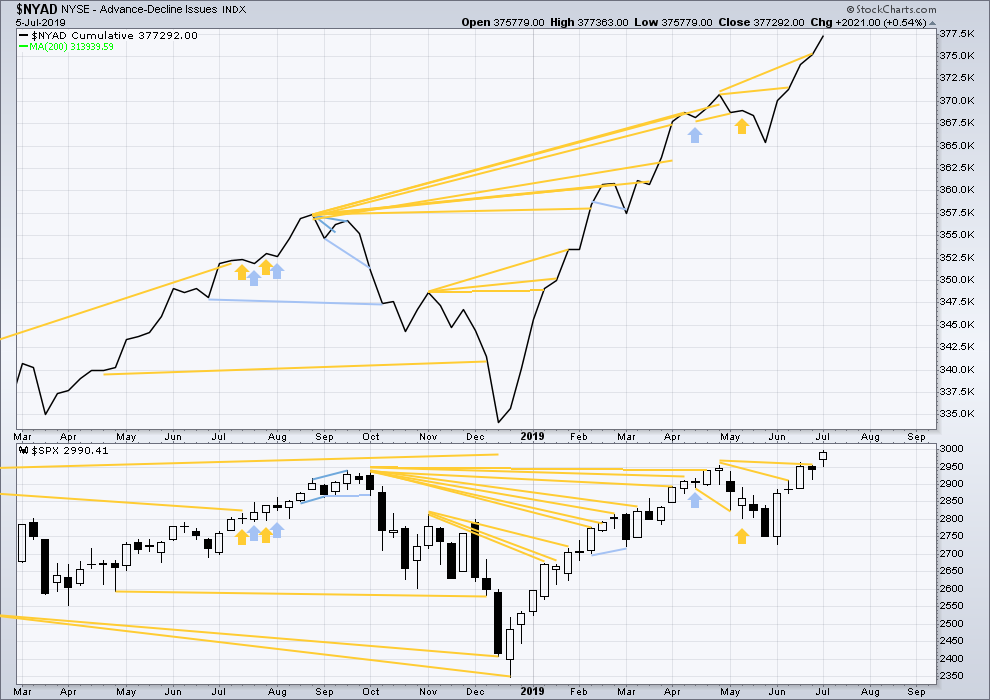
Click chart to enlarge. Chart courtesy of StockCharts.com. So that colour blind members are included, bearish signals
will be noted with blue and bullish signals with yellow.
Bear markets from the Great Depression and onwards have been preceded by an average minimum of 4 months divergence between price and the AD line with only two exceptions in 1946 and 1976. With the AD line making new all time highs again this week, the end of this bull market and the start of a new bear market is very likely a minimum of 4 months away, which is early November 2019.
In all bear markets in the last 90 years there is some positive correlation (0.6022) between the length of bearish divergence and the depth of the following bear market. No to little divergence is correlated with more shallow bear markets. Longer divergence is correlated with deeper bear markets.
If a bear market does develop here, it comes after no bearish divergence. It would therefore more likely be shallow.
Last week both price and the AD line make new all time highs. Upwards movement in price has good support from rising market breadth. This is bullish.
Last week only large caps have made new all time highs. Mid caps are a little way off and small caps are lagging. This is normal behaviour in the later stages of a bull market.
DAILY CHART
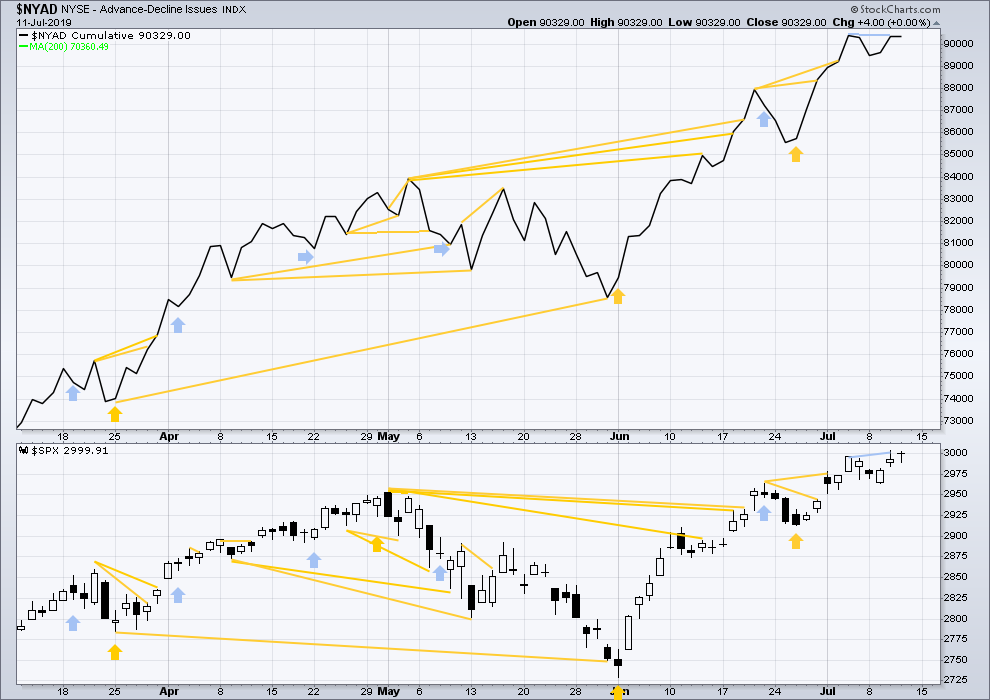
Click chart to enlarge. Chart courtesy of StockCharts.com. So that colour blind members are included, bearish signals
will be noted with blue and bullish signals with yellow.
Breadth should be read as a leading indicator.
Today price moves sideways and the AD line is flat. There is no new short-term divergence.
Yesterday price made a new all time high above the prior all time high of the 3rd of July, but the AD line failed to make a corresponding new high. This divergence is bearish. It is slight and weak but still favours the main daily Elliott wave count.
VOLATILITY – INVERTED VIX CHART
WEEKLY CHART
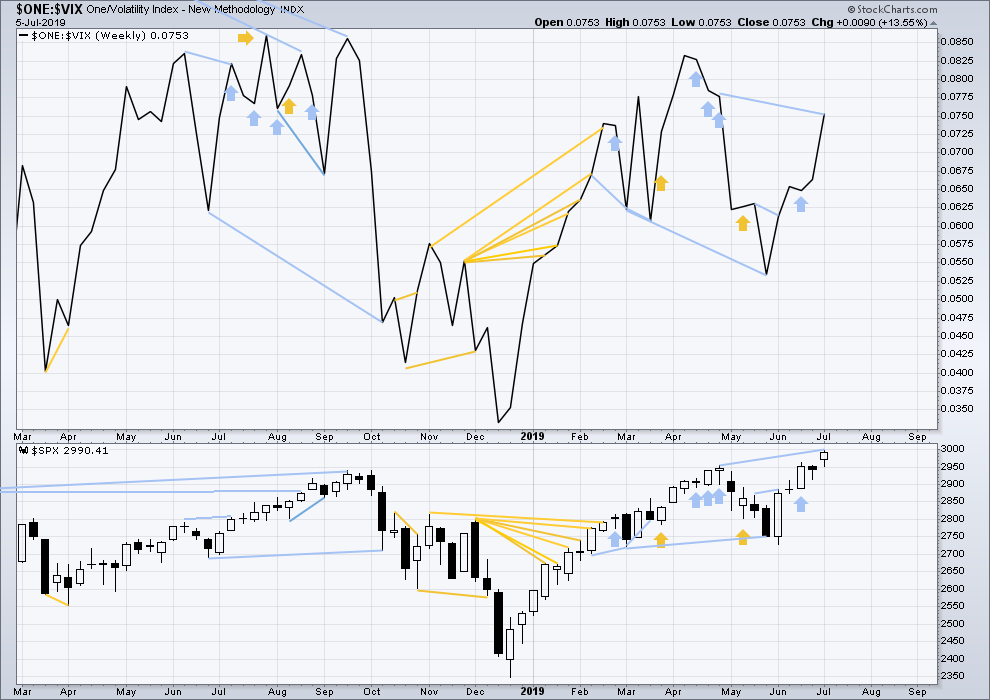
Click chart to enlarge. Chart courtesy of StockCharts.com. So that colour blind members are included, bearish signals
will be noted with blue and bullish signals with yellow.
Long-term bearish divergence remains. It may develop further before the upwards trend ends.
Last week both price and inverted VIX have moved higher, but price has made new all time highs while inverted VIX has not. There is short, mid and long-term bearish divergence now between price and VIX.
DAILY CHART
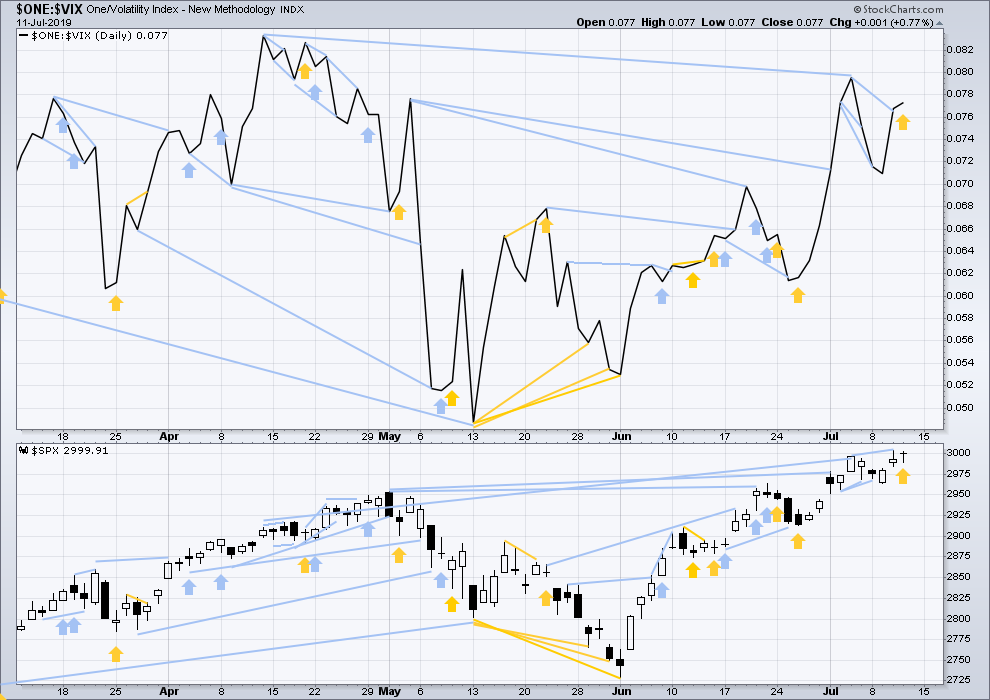
Click chart to enlarge. Chart courtesy of StockCharts.com. So that colour blind members are included, bearish signals
will be noted with blue and bullish signals with yellow.
Yesterday price made a slight new high, but inverted VIX failed to make a corresponding new high. There is new short-term bearish divergence between price and VIX. This will be given a very small weight in this analysis today because it confirms divergence between price and the AD line and RSI.
Today price has completed an inside day, but inverted VIX has slightly increased. Movement within this session has a corresponding decline in VIX today. This slight divergence is slightly bullish but will be given no weight in this analysis.
DOW THEORY
Dow Theory confirmed a bear market in December 2018. This does not necessarily mean a bear market at Grand Super Cycle degree though; Dow Theory makes no comment on Elliott wave counts. On the 25th of August 2015 Dow Theory also confirmed a bear market. The Elliott wave count sees that as part of cycle wave II. After Dow Theory confirmation of a bear market in August 2015, price went on to make new all time highs and the bull market continued.
DJIA: 23,344.52 – a close on the 19th of December at 23,284.97 confirms a bear market.
DJT: 9,806.79 – price has closed below this point on the 13th of December.
S&P500: 2,532.69 – a close on the 19th of December at 2,506.96 provides support to a bear market conclusion.
Nasdaq: 6,630.67 – a close on the 19th of December at 6,618.86 provides support to a bear market conclusion.
With all the indices having moved higher following a Dow Theory bear market confirmation, Dow Theory would confirm a bull market if the following highs are made:
DJIA: 26,951.81 – a new all time high has been made on the 3rd of July 2019.
DJT: 11,623.58
S&P500: 2,940.91 – a new all time high has been made on the 29th of April 2019.
Nasdaq: 8,133.30 – a new high has been made on 24th of April 2019.
Published @ 08:42 p.m. EST.
—
Careful risk management protects your trading account(s).
Follow my two Golden Rules:
1. Always trade with stops.
2. Risk only 1-5% of equity on any one trade.
—
New updates to this analysis are in bold.
New daily chart, very bullish. This was the alternate in the analysis above. Now the main.
New hourly chart, new invalidation point and target.
My view is that SPX has just finished (or are about to finish) wave 1-blue. The recent price action looks like a 4 (in W-X-Y), not a 2.
I would expect wave 2-blue to start towards the 2980s next week before the uptrend resumes.
Hmmmm… possible. But, minor 1? Not minute i?
To see minor 1 nearing completion it would have to be resolved from the start of intermediate (2) at 2,192.99 on 26th June.
AAXN stock traders.
CYBR has broken out of it’s Elliott wave triangle that started early June and may be a nice buy here.
ABBV has bounced nicely from a 61% retracement of its move from low of June 26th.
I think it’s a good set up for a long position, even if this is a countertrend bounce, it should be likely a 3 wave structure with a C wave in progress taking it above 75
Price is at the lowest fibonacci fit generated target from early this week.
Lara’s second hourly looks pretty solid. I expect upside momentum next week once the market gets a look at earnings numbers rolling in.
that would float my boat Jonathan!!
however, looking at the SPX hourly, I can make a case that a 5 wave move is complete here off the low on 6/26. And a correction is now due. Could be wrongo for sure! But I think it is a valid possibility. For the sake of my little ‘fly today, I’d be okay with a small sharp sell off of 10 or so points here. And I’ve got a large fly centered at SPX 2995 for next Friday, so such a correction might set me up well there. On the other hand, I’ve a boatload of long stock positions, and upward movement is going to generate winner after winner and I’m good with that (in these market conditions, I’m generally targeting 3-4% limit sell profit exits). If the market decides to go to heck here…well, I get burned for a lot of stop losses most likely, but that’s how the game is played.
I would love to see the charts of other instruments you mentioned in yesterday’s post.
Thanks in advance, s
If your question is to me, then you’ll have to specify which instruments please.
If your question is to someone else then who? And what instruments?
Thanks.
1st again? Where is everybody??
Preparing…
Two great buys set up and triggered on the 5 minute chart today in /ES. I gotta pay more attention….
Overnight futures pushing up!! 6 points over the close at the moment.