
As expected an outside day continues a sideways consolidation.
Summary: The bull market is expected to continue and corrections are expected to be shallow.
A more time consuming consolidation or pullback may have just begun. It may continue for another two weeks. The target is 2,933.
The biggest picture, Grand Super Cycle analysis, is here.
Monthly charts were last published here, with video here. There are two further alternate monthly charts here, with video here.
ELLIOTT WAVE COUNTS
The two Elliott wave counts below will be labelled First and Second. They may be about of even probability. When the fifth wave currently unfolding on weekly charts may be complete, then these two wave counts will diverge on the severity of the expected following bear market. To see an illustration of this future divergence monthly charts should be viewed.
FIRST WAVE COUNT
WEEKLY CHART
Click chart to enlarge.
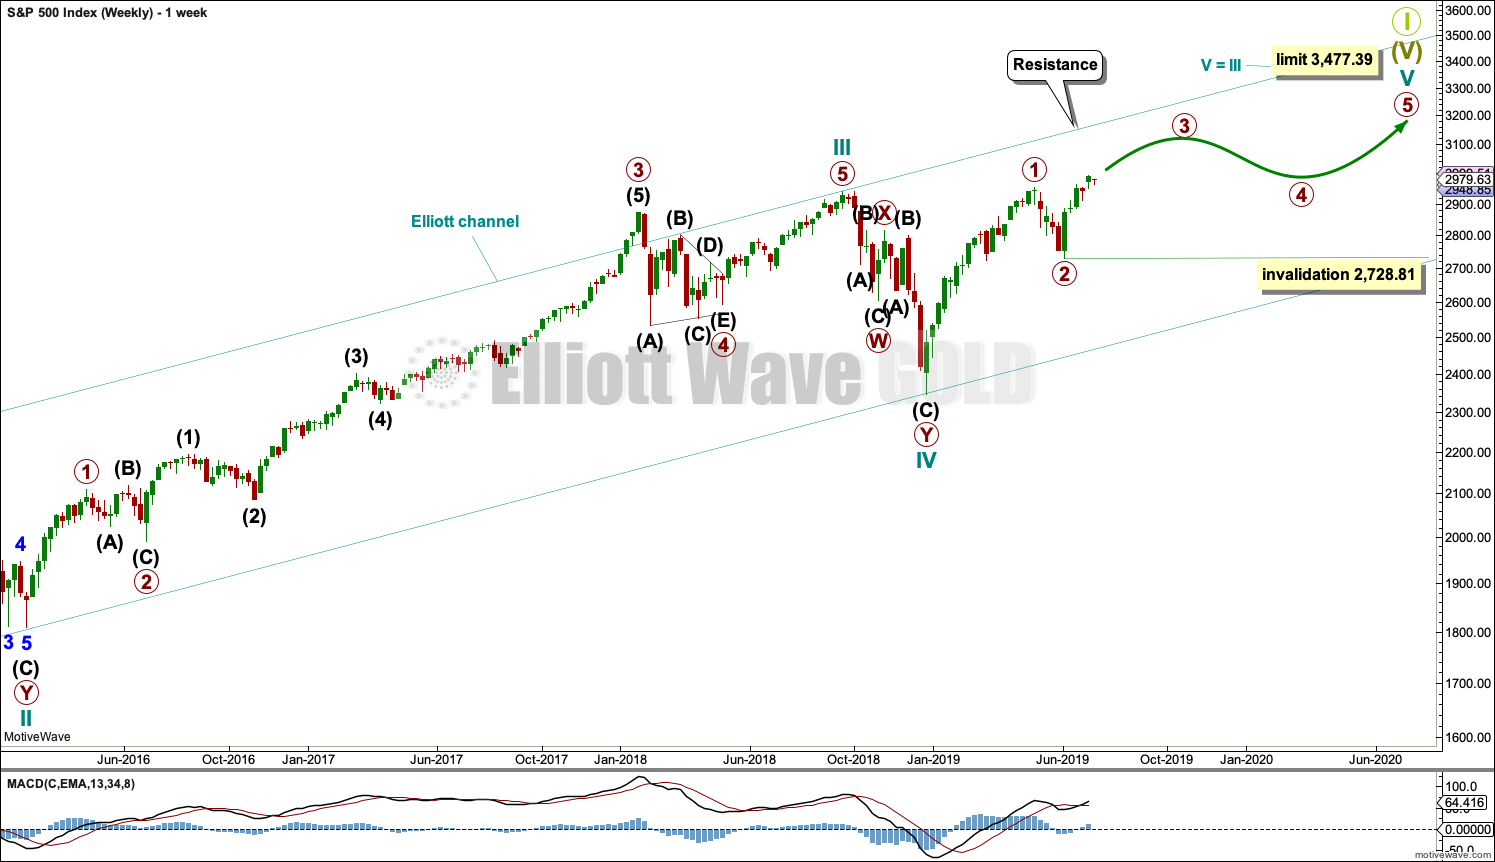
The basic Elliott wave structure consists of a five wave structure up followed by a three wave structure down (for a bull market). This wave count sees the bull market beginning in March 2009 as an incomplete five wave impulse and now within the last fifth wave, which is labelled cycle wave V. This impulse is best viewed on monthly charts. The weekly chart focusses on the end of it.
Elliott wave is fractal. This fifth wave labelled cycle wave V may end a larger fifth wave labelled Super Cycle wave (V), which may end a larger first wave labelled Grand Super Cycle wave I.
The teal Elliott channel is drawn using Elliott’s first technique about the impulse of Super Cycle wave (V). Draw the first trend line from the end of cycle wave I (off to the left of the chart, the weekly candlestick beginning 30th November 2014) to the end of cycle wave III, then place a parallel copy on the end of cycle wave II. This channel perfectly shows where cycle wave IV ended at support. The strongest portion of cycle wave III, the end of primary wave 3, overshoots the upper edge of the channel. This is a typical look for a third wave and suggests the channel is drawn correctly and the way the impulse is counted is correct.
Within Super Cycle wave (V), cycle wave III is shorter than cycle wave I. A core Elliott wave rule states that a third wave may never be the shortest. For this rule to be met in this instance, cycle wave V may not be longer in length than cycle wave III. This limit is at 3,477.39.
The structure of cycle wave V is focussed on at the daily chart level below.
Within cycle wave V, primary waves 1 and 2 may now be complete. Within primary wave 3, no second wave correction may move beyond its start below 2,728.81.
In historic analysis, two further monthly charts have been published that do not have a limit to upwards movement and are more bullish than this wave count. Members are encouraged to consider those possibilities (links below summary) alongside the wave counts presented on a daily and weekly basis.
DAILY CHART
Click chart to enlarge.
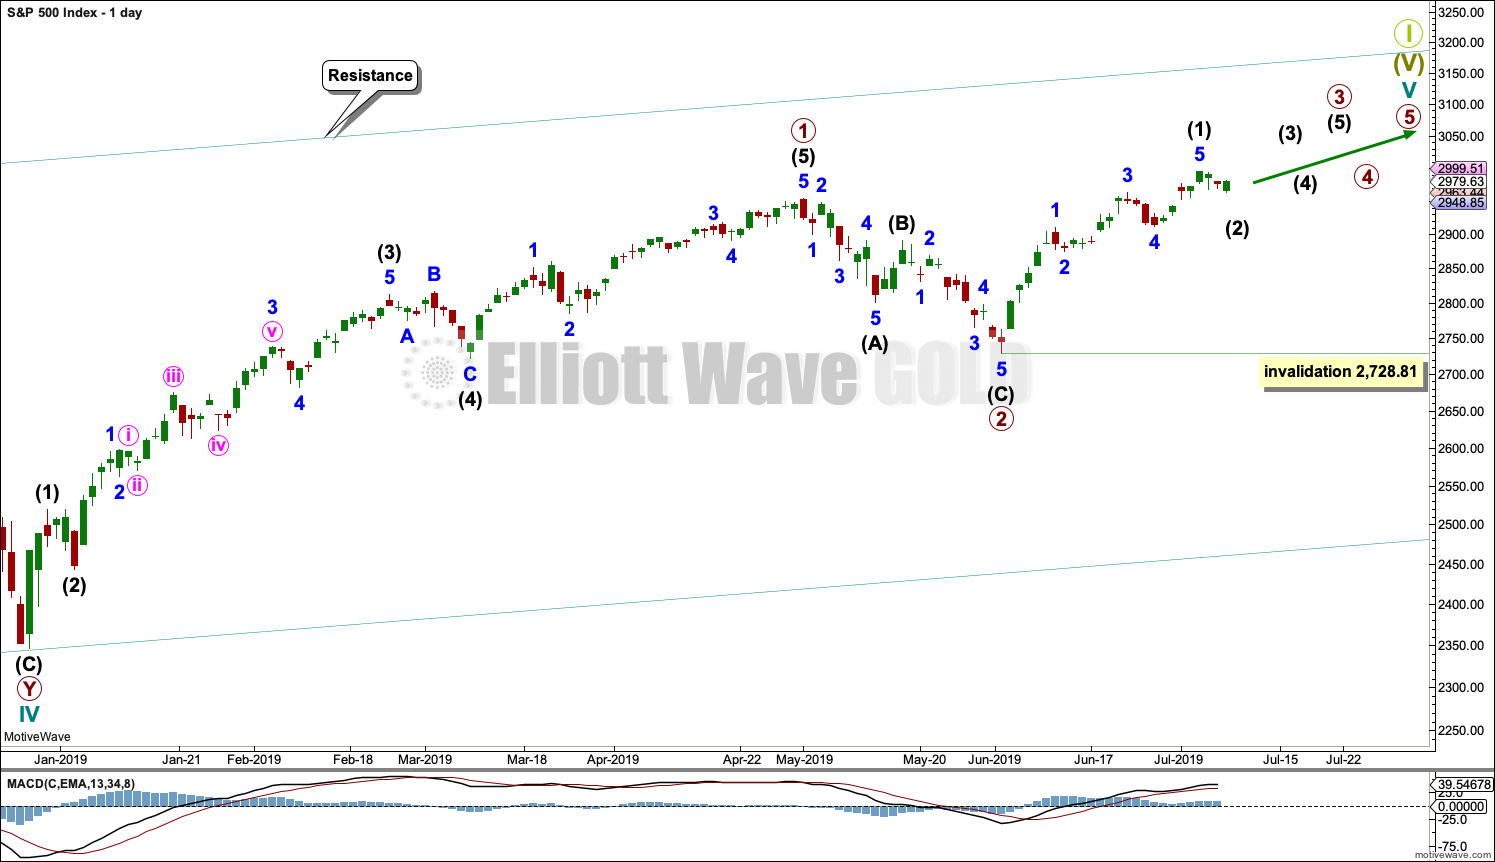
Cycle wave V must subdivide as a five wave motive structure. Within that five wave structure, primary waves 1 and 2 may be complete.
Primary wave 3 must move above the end of primary wave 1 (this rule has now been met). Primary wave 3 may only subdivide as an impulse.
Within the impulse of primary wave 3, only intermediate wave (1) may now be complete. Intermediate wave (2) may have begun. Intermediate wave (2) may not move beyond the start of intermediate wave (1) below 2,728.81.
When primary wave 3 is over, then primary wave 4 may be a shallow sideways consolidation.
Thereafter, primary wave 5 should move above the end of primary wave 3 to avoid a truncation.
Primary wave 1 lasted 86 sessions, 3 short of a Fibonacci 89. Primary wave 2 lasted 22 sessions, 1 longer than a Fibonacci 21. Primary wave 3 may end about a Fibonacci 55 sessions, give or take two or three sessions either side. This is a rough guideline only.
So far primary wave 3 has lasted 25 sessions.
Within primary wave 3, intermediate wave (1) lasted 22 sessions, 1 longer than a Fibonacci 21. Intermediate wave (2) may be more brief; it may last a Fibonacci 13 sessions. So far it has lasted 3.
HOURLY CHART
Click chart to enlarge.
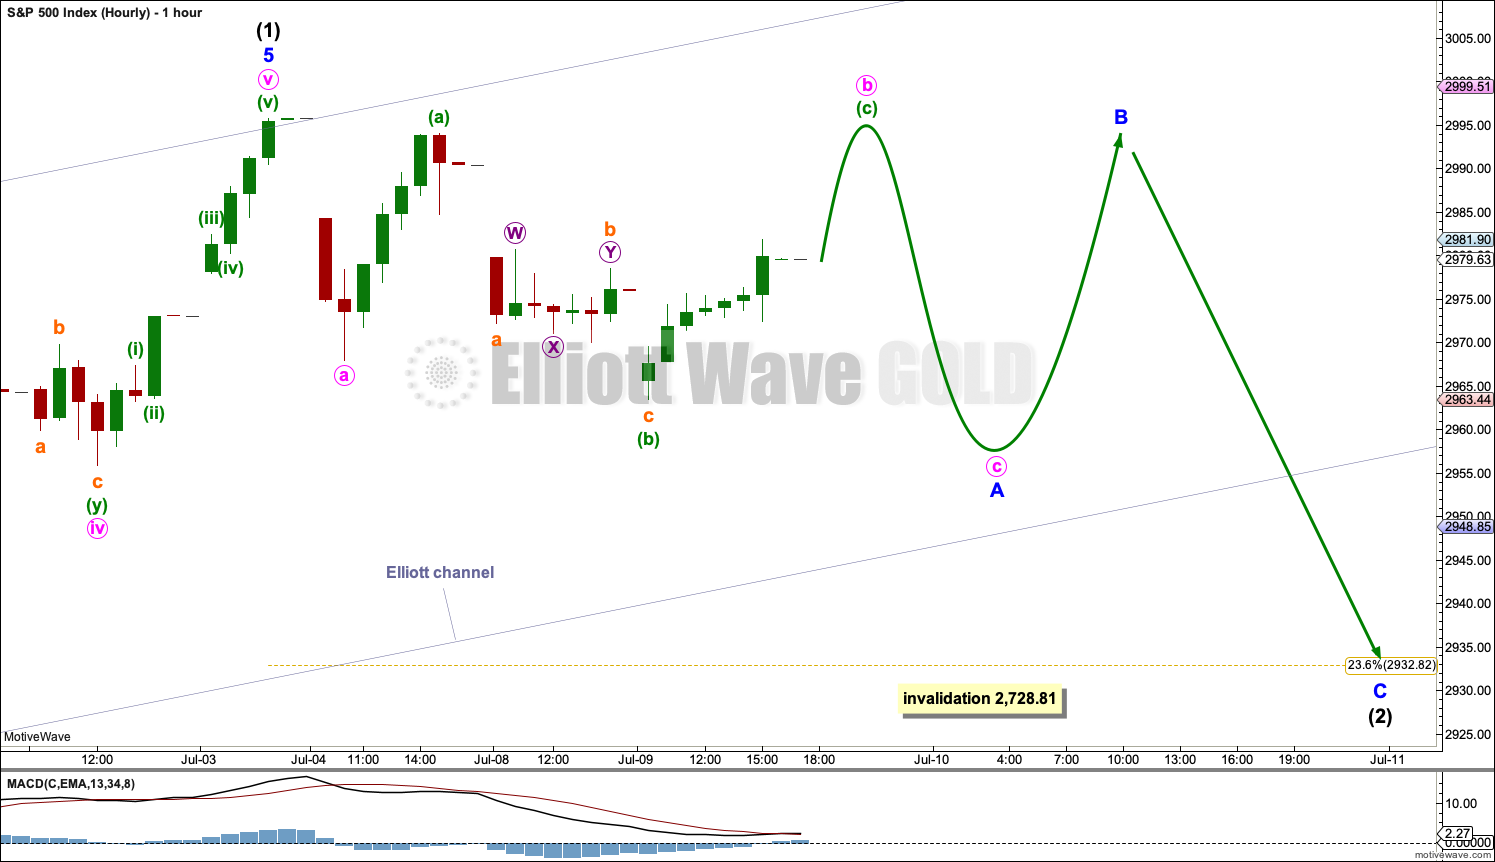
Intermediate wave (1) may be a long extension. It fits within a channel drawn using Elliott’s second technique.
Intermediate wave (2) may be expected to be shallow. If the target of the 0.236 Fibonacci ratio at 2,933 is wrong, it may be too low. Intermediate wave (2) may subdivide as any Elliott wave corrective structure except a triangle. It would most likely be a zigzag, but it may also be a flat or combination.
At this stage, intermediate wave (2) is labelled as a possible flat correction, with minor wave A subdividing as a zigzag. Within minor wave A, minute wave b may be an incomplete expanded flat correction.
The labelling within intermediate wave (2) may change as it unfolds sideways. It is impossible at this stage to know which of several structural possibilities intermediate wave (2) may complete as. Focus over the next two weeks will be on identifying when a corrective structure for intermediate wave (2) may be complete. That cannot be seen today.
SECOND WAVE COUNT
WEEKLY CHART
Click chart to enlarge.
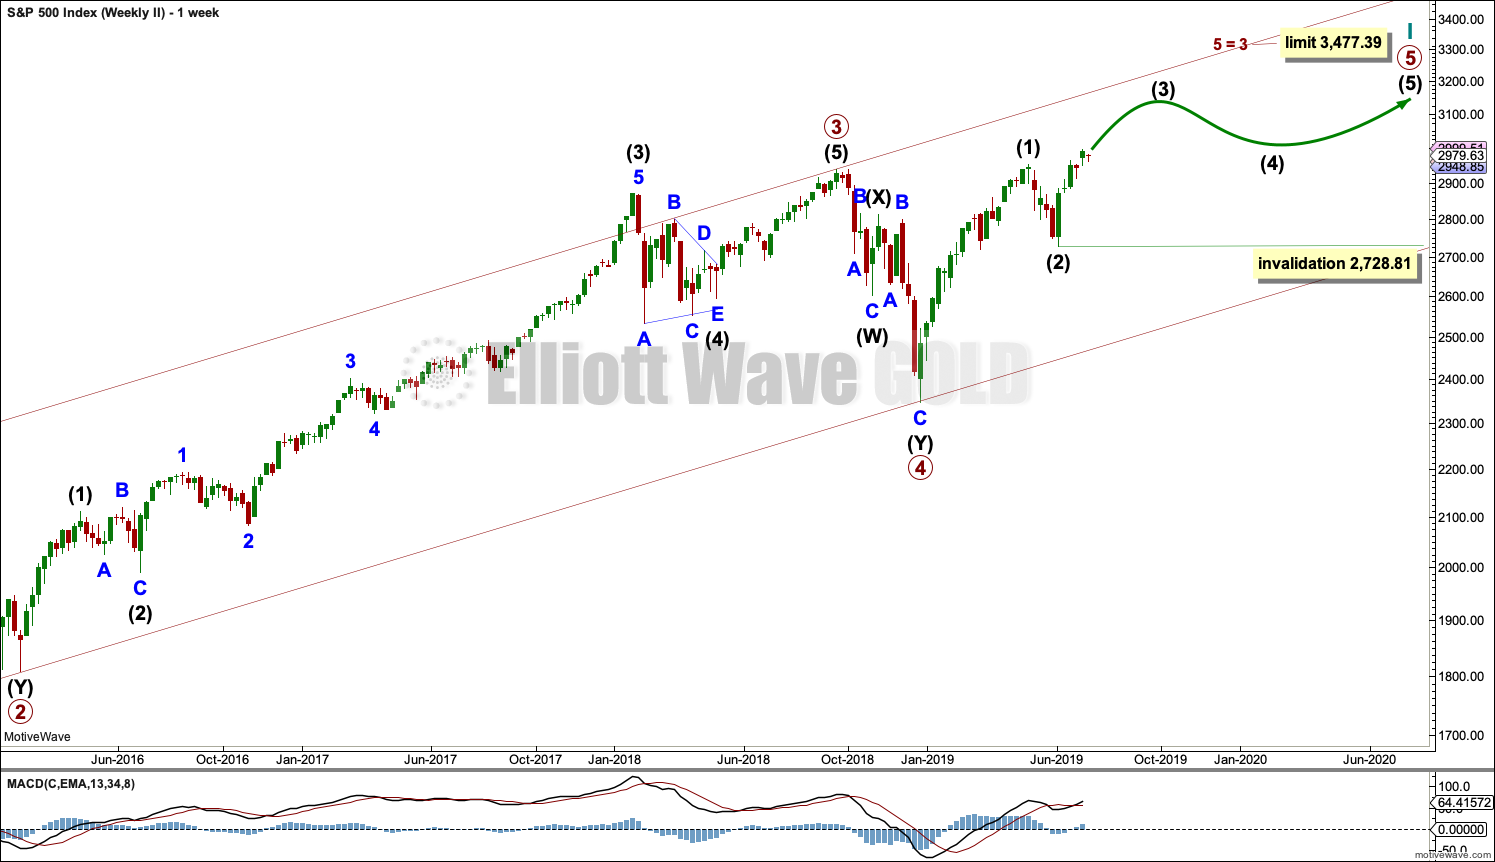
This weekly chart is almost identical to the first weekly chart, with the sole exception being the degree of labelling.
This weekly chart moves the degree of labelling for the impulse beginning in March 2009 all down one degree. This difference is best viewed on monthly charts.
The impulse is still viewed as nearing an end; a fifth wave is still seen as needing to complete higher. This wave count labels it primary wave 5.
TECHNICAL ANALYSIS
WEEKLY CHART
Click chart to enlarge. Chart courtesy of StockCharts.com.
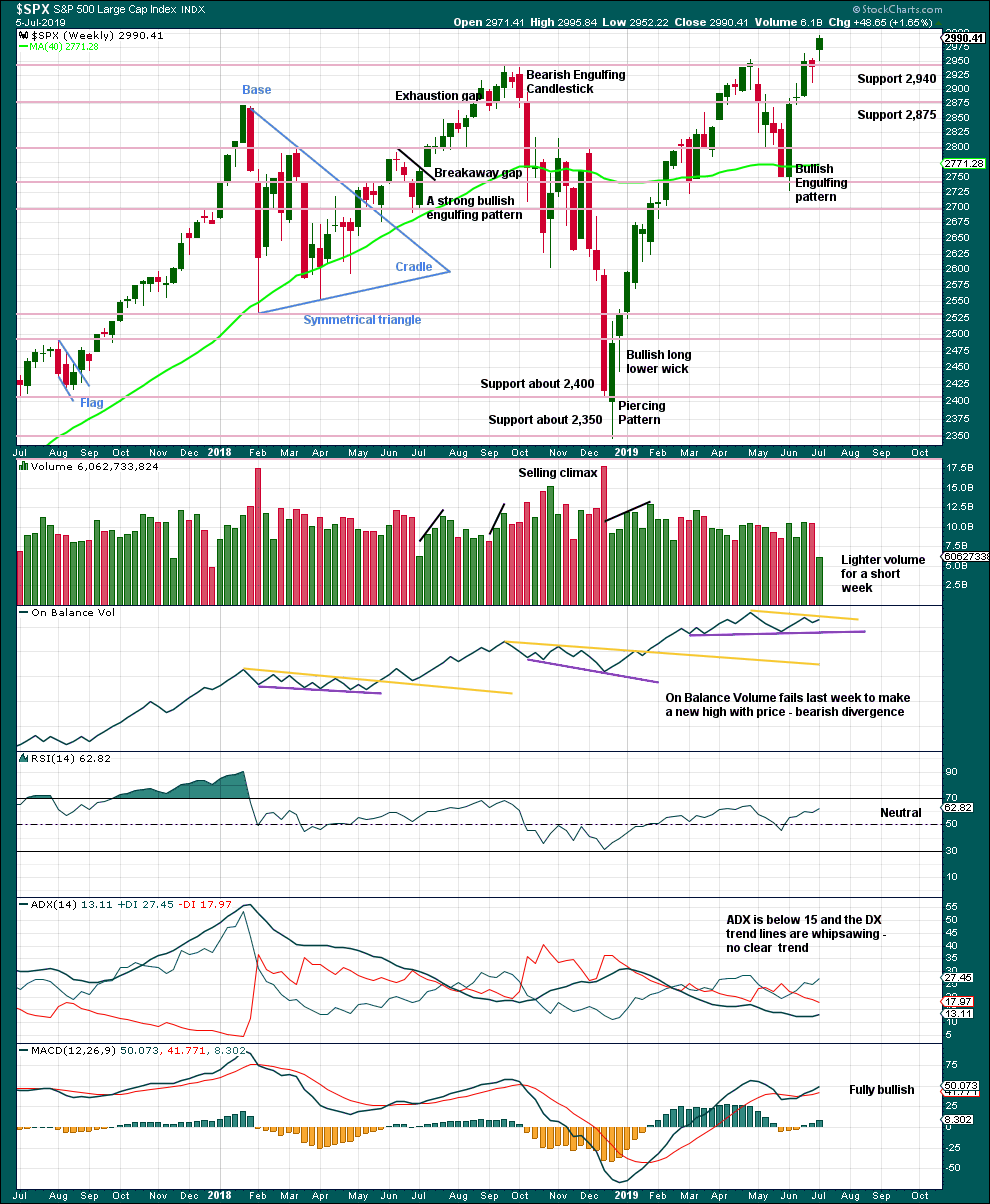
The long lower wick on the last weekly candlestick suggests more upwards movement this week.
DAILY CHART
Click chart to enlarge. Chart courtesy of StockCharts.com.
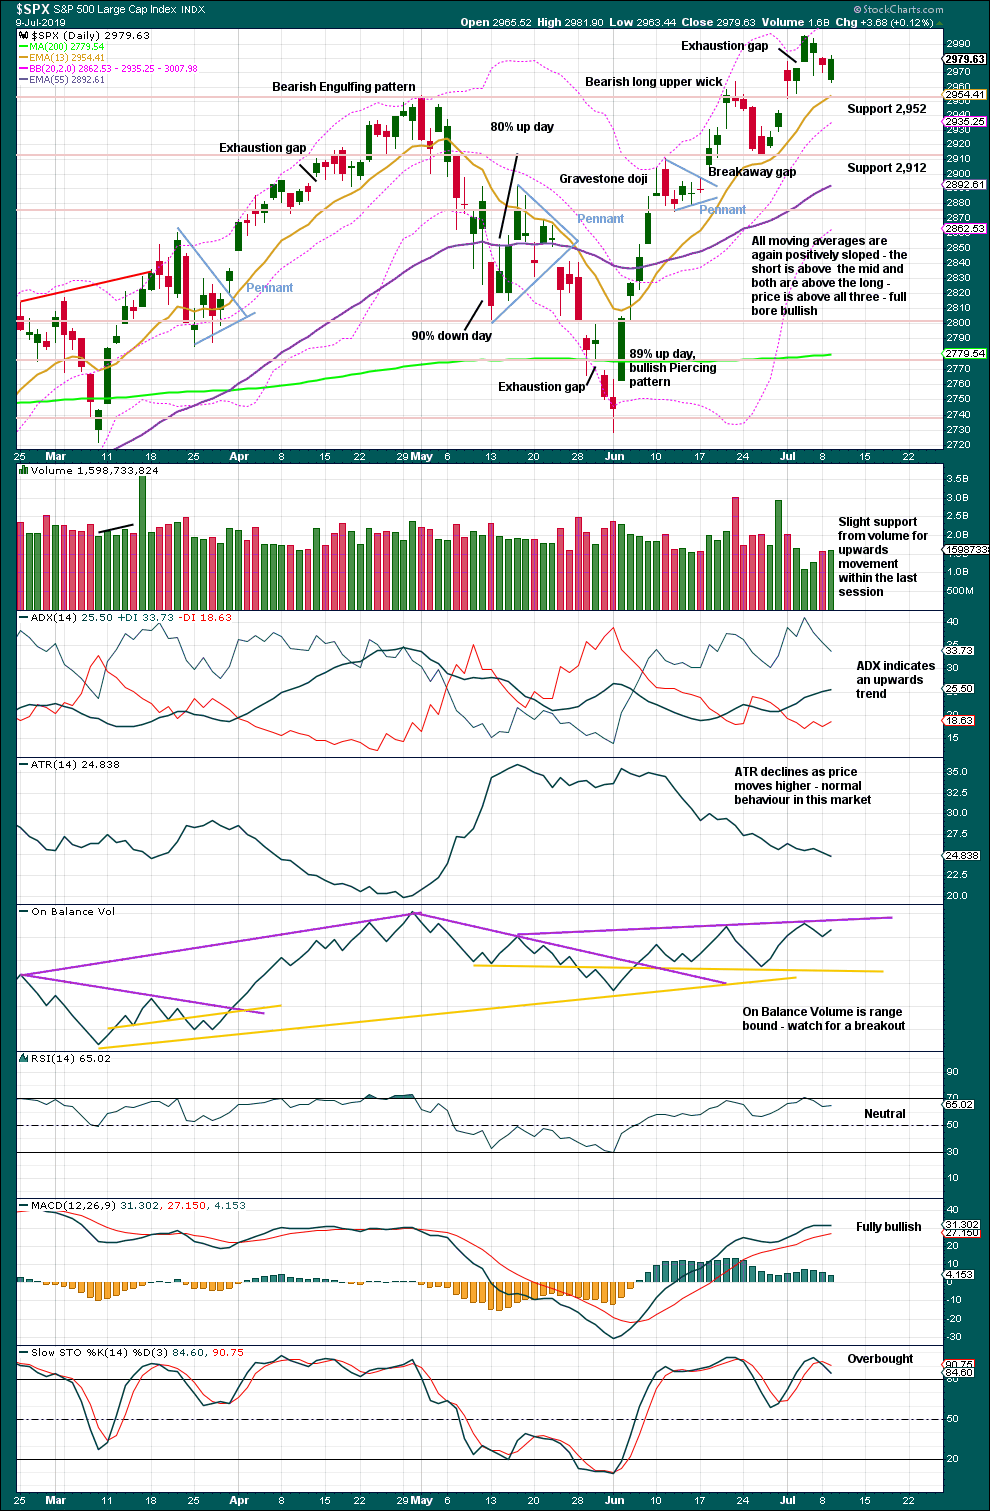
Rising price on light and declining volume has been a feature of this market now for years at all time frames. While some support from volume is expected as likely for the Elliott wave count which expects the middle of a third wave may be unfolding, it is not necessary to see in current market conditions.
For the short term, there may be a slightly elevated risk of another pullback or consolidation developing: the last gap is now closed (now relabelled an exhaustion gap), volume pushed price lower on Friday, and On Balance Volume turned down from resistance.
Today completes an outside day that closed green with the balance of volume upwards. Upwards movement within the session has a little support from volume, suggesting the consolidation may be relatively shallow.
BREADTH – AD LINE
WEEKLY CHART
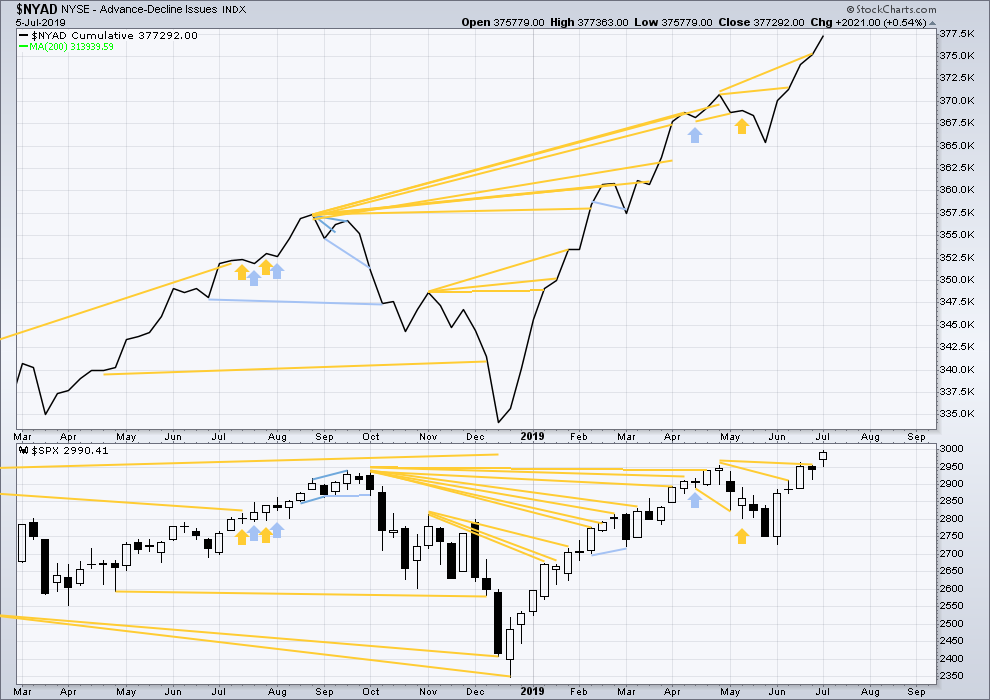
Click chart to enlarge. Chart courtesy of StockCharts.com. So that colour blind members are included, bearish signals
will be noted with blue and bullish signals with yellow.
Bear markets from the Great Depression and onwards have been preceded by an average minimum of 4 months divergence between price and the AD line with only two exceptions in 1946 and 1976. With the AD line making new all time highs again this week, the end of this bull market and the start of a new bear market is very likely a minimum of 4 months away, which is early November 2019.
In all bear markets in the last 90 years there is some positive correlation (0.6022) between the length of bearish divergence and the depth of the following bear market. No to little divergence is correlated with more shallow bear markets. Longer divergence is correlated with deeper bear markets.
If a bear market does develop here, it comes after no bearish divergence. It would therefore more likely be shallow.
Last week both price and the AD line make new all time highs. Upwards movement in price has good support from rising market breadth. This is bullish.
Last week only large caps have made new all time highs. Mid caps are a little way off and small caps are lagging. This is normal behaviour in the later stages of a bull market.
DAILY CHART
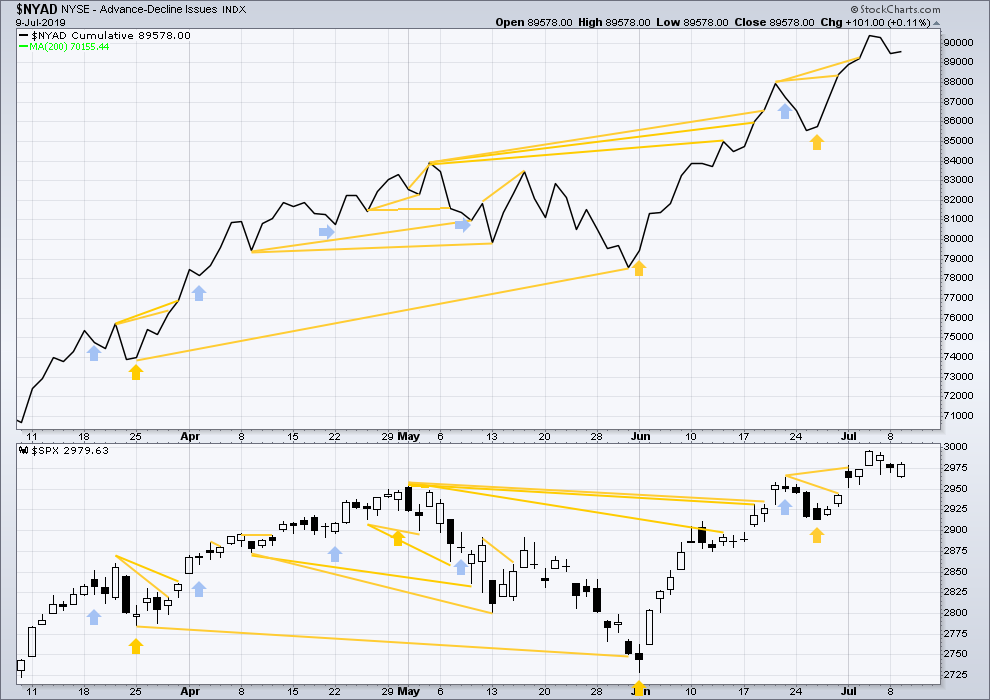
Click chart to enlarge. Chart courtesy of StockCharts.com. So that colour blind members are included, bearish signals
will be noted with blue and bullish signals with yellow.
Breadth should be read as a leading indicator.
For Tuesday price has moved sideways with a green candlestick and the balance of volume upwards. Upwards movement within the session has a little support from a rising AD line. There is no new short-term divergence.
VOLATILITY – INVERTED VIX CHART
WEEKLY CHART
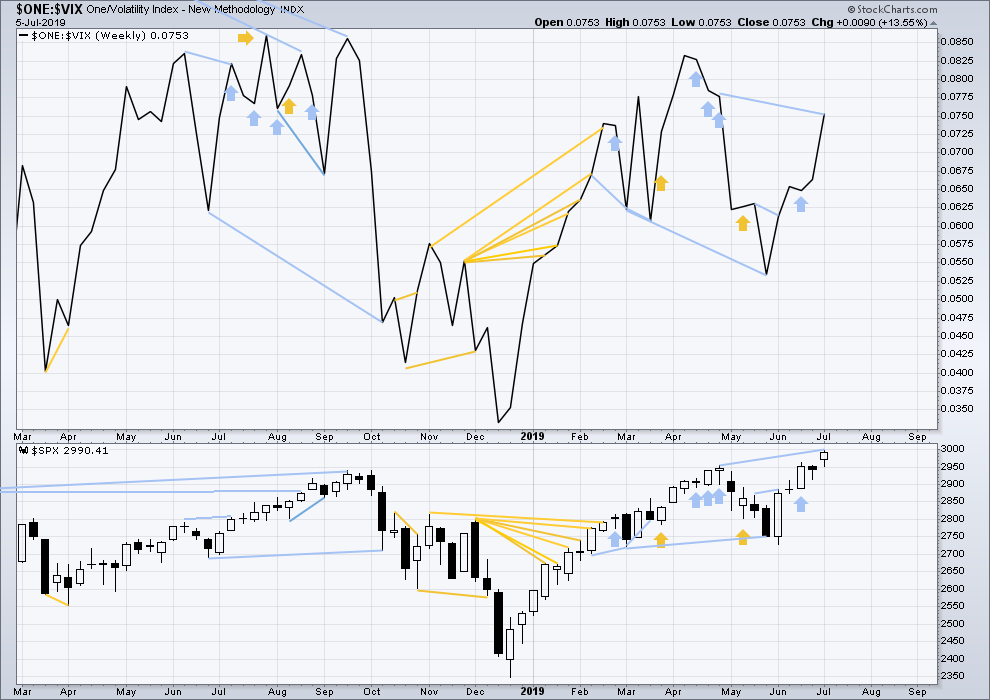
Click chart to enlarge. Chart courtesy of StockCharts.com. So that colour blind members are included, bearish signals
will be noted with blue and bullish signals with yellow.
Long-term bearish divergence remains. It may develop further before the upwards trend ends.
Last week both price and inverted VIX have moved higher, but price has made new all time highs while inverted VIX has not. There is short, mid and long-term bearish divergence now between price and VIX.
DAILY CHART
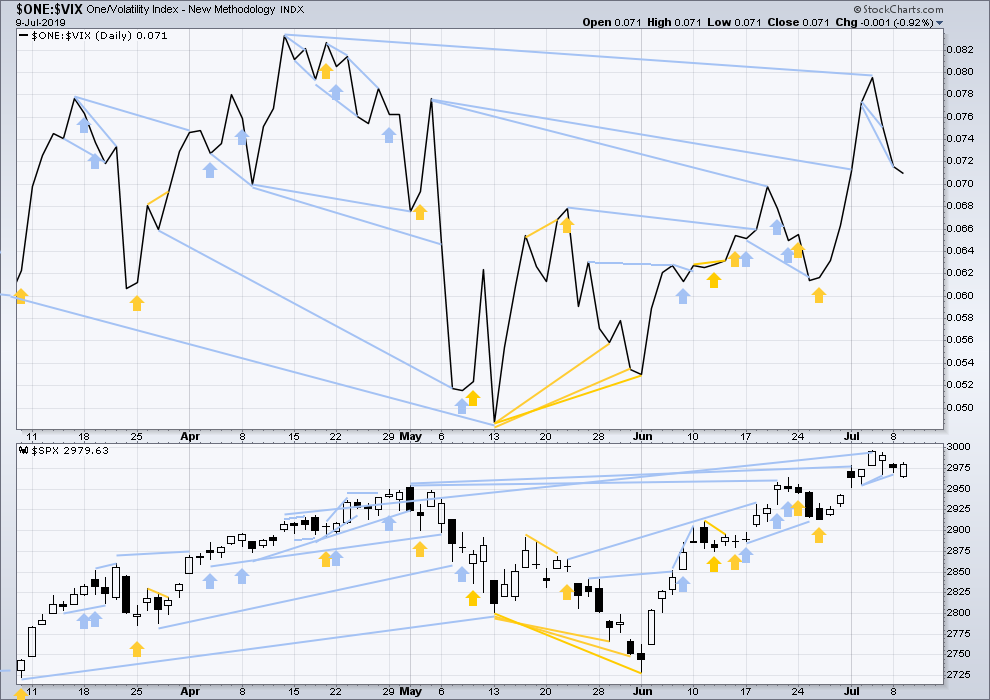
Click chart to enlarge. Chart courtesy of StockCharts.com. So that colour blind members are included, bearish signals
will be noted with blue and bullish signals with yellow.
On Tuesday price has moved sideways with a green candlestick and the balance of volume upwards. Upwards movement within the session does not have support from a normal corresponding decline in VIX. With inverted VIX declining, VIX has increased. This is slightly bearish for the short term but will not be given weight in this analysis as it is only a single session and very slight.
DOW THEORY
Dow Theory confirmed a bear market in December 2018. This does not necessarily mean a bear market at Grand Super Cycle degree though; Dow Theory makes no comment on Elliott wave counts. On the 25th of August 2015 Dow Theory also confirmed a bear market. The Elliott wave count sees that as part of cycle wave II. After Dow Theory confirmation of a bear market in August 2015, price went on to make new all time highs and the bull market continued.
DJIA: 23,344.52 – a close on the 19th of December at 23,284.97 confirms a bear market.
DJT: 9,806.79 – price has closed below this point on the 13th of December.
S&P500: 2,532.69 – a close on the 19th of December at 2,506.96 provides support to a bear market conclusion.
Nasdaq: 6,630.67 – a close on the 19th of December at 6,618.86 provides support to a bear market conclusion.
With all the indices having moved higher following a Dow Theory bear market confirmation, Dow Theory would confirm a bull market if the following highs are made:
DJIA: 26,951.81 – a new all time high has been made on the 3rd of July 2019.
DJT: 11,623.58
S&P500: 2,940.91 – a new all time high has been made on the 29th of April 2019.
Nasdaq: 8,133.30 – a new high has been made on 24th of April 2019.
Published @ 07:36 p.m. EST.
—
Careful risk management protects your trading account(s).
Follow my two Golden Rules:
1. Always trade with stops.
2. Risk only 1-5% of equity on any one trade.
—
New updates to this analysis are in bold.
Hourly chart update:
Intermediate (2) may be a flat correction. Minute b moves beyond the start of minute a, Minor A may be an expanded flat correction.
This could be minor A of a flat, or minor W of a double flat or double combination.
However, if the new high today is a B wave then it must exhibit weakness. If there is any strength in this upwards movement may wave count may need further revision, it may need to change again.
The larger trend is up.
Good point Kevin
Hey wait a minute. If today’s price action is continuing the minor 5, then minor 5 is now longer than minor 3…
I have the minor 3 at 89.47 SPX points, while the minor 5 to the high so far today is 89.99. Hmmm.
Exactly. It’s a bit of a problem.
The first go to solution would be to move the degree of labelling within minor 3 down one and see that as nearing an end, but there is an overlap within it from the high of 21st June at 2,964.15 and the low of 9th July at 2,963.44 which invalidates such a count. Chart below of the idea… which is invalid so I won’t be publishing it.
I’m scratching my head a little bit this morning looking for a good alternate which sees the bull run continuing right here….
For the idea above I’ve moved the degree of labelling within primary wave 3 all back up one…
Cannabis company CRON might be just about to light up! Love this set up. I’ll be a buyer on the crack of the first overhead pivot high (yuck yuck). If it cracks the higher pivots, it could be going from 18 to 24…
the SPX price action isn’t supporting the intermediate 2 down thesis (yet). until price busts that lower channel line, the bull be roaring. and the upper channel line beckons for another visit.
targets above: blue are fibo projections of prior upswings (127% and 162%), pink are fibo fitted projections, and yellow is a symmetric swing projection.
my bullish RUT count continues to work (hourly chart here). Looks to me like a flat minuette [ii] completed, and now a subminuette i has completed, and a subminuette ii down in progress. I have an IWM fly for next Friday well above market, leaning on this one a little bit, though my risk is rather small should it break down. I like that about flies targeting “far away” price areas. They are a good way to leverage EW knowledge on the cheap.
If anyone is trading stocks, I rather like the set up right here in AAXN. Big weekly tf pullback looks complete and a turn now off a 38% level with a well structured bottom. And the move down is symmetric with a Feb/Mar pullback.
10th of July fireworks!
Yea, the rocket’s green glare!! somebody is hungry for stocks…but the volume is light, and now it’s a clear 3 up (so far)…
Spx new ATH, ES not yet …
My older fibo fitted targets come back into play here (blue lines, daily chart of SPX). The fitted fibo structure for the highest tgt is on the chart.
Here’s an update (additions) to those targets, using fitted fibonacci structures over the entire up move since the early June low.
I do expect serious resistance and a decent probability of a significant pivot around that 3014 to 3035 zone, lots of structural reasons why price movement should stall at least there.
Looking just at the chart, I see a bull market with more upward movement likely.
Waiting for evidence a larger correction is truly afoot. Notice there’s a very real possibility of a head & shoulder’s top here; that would be strong evidence if the neckline was busted.
Lots of targets below. Lots of targets above. I dunno.
If I do see a convincing turn down here soon, I will put on a broken wing SPX spread for Friday to try to capture the huge premium decay period in what should be a reasonably stable, oscillating market. I’m thinking put spread 2990-2965-2950. Get out fast if the turn down reverses and pushes above the pivot. I make $ on anything and everything below 2982 at close on Friday, and bingo ($2900/fly) on 2965. I like this trade at this point in the early stage of a likely shallow 2. It’s a good opportunity to get on the right side of premium decay, which is kind of like free money if you think about it.
nabbed it!