
For the very short term, a little more downwards movement was expected to end about 2,930 to 2,924. Downwards movement for the session reached 2,916.01, 7.99 below the lower edge of the target zone.
Summary: For the very short term, a little more downwards movement may now end about 2,874.
The low of December 2018 is expected to most likely remain intact.
The next short-term target is at 3,068 (Elliott wave) to 3,079 (classic analysis from the pennant). This next upwards wave may exhibit further strength. Look for corrections to continue to be very shallow and brief.
The mid-term target remains at 3,104 for a more time consuming consolidation or pullback, which may also be shallow.
The biggest picture, Grand Super Cycle analysis, is here.
Monthly charts were last published here, with video here. There are two further alternate monthly charts here, with video here.
ELLIOTT WAVE COUNTS
The two Elliott wave counts below will be labelled First and Second. They may be about of even probability. When the fifth wave currently unfolding on weekly charts may be complete, then these two wave counts will diverge on the severity of the expected following bear market. To see an illustration of this future divergence monthly charts should be viewed.
FIRST WAVE COUNT
WEEKLY CHART
Click chart to enlarge.
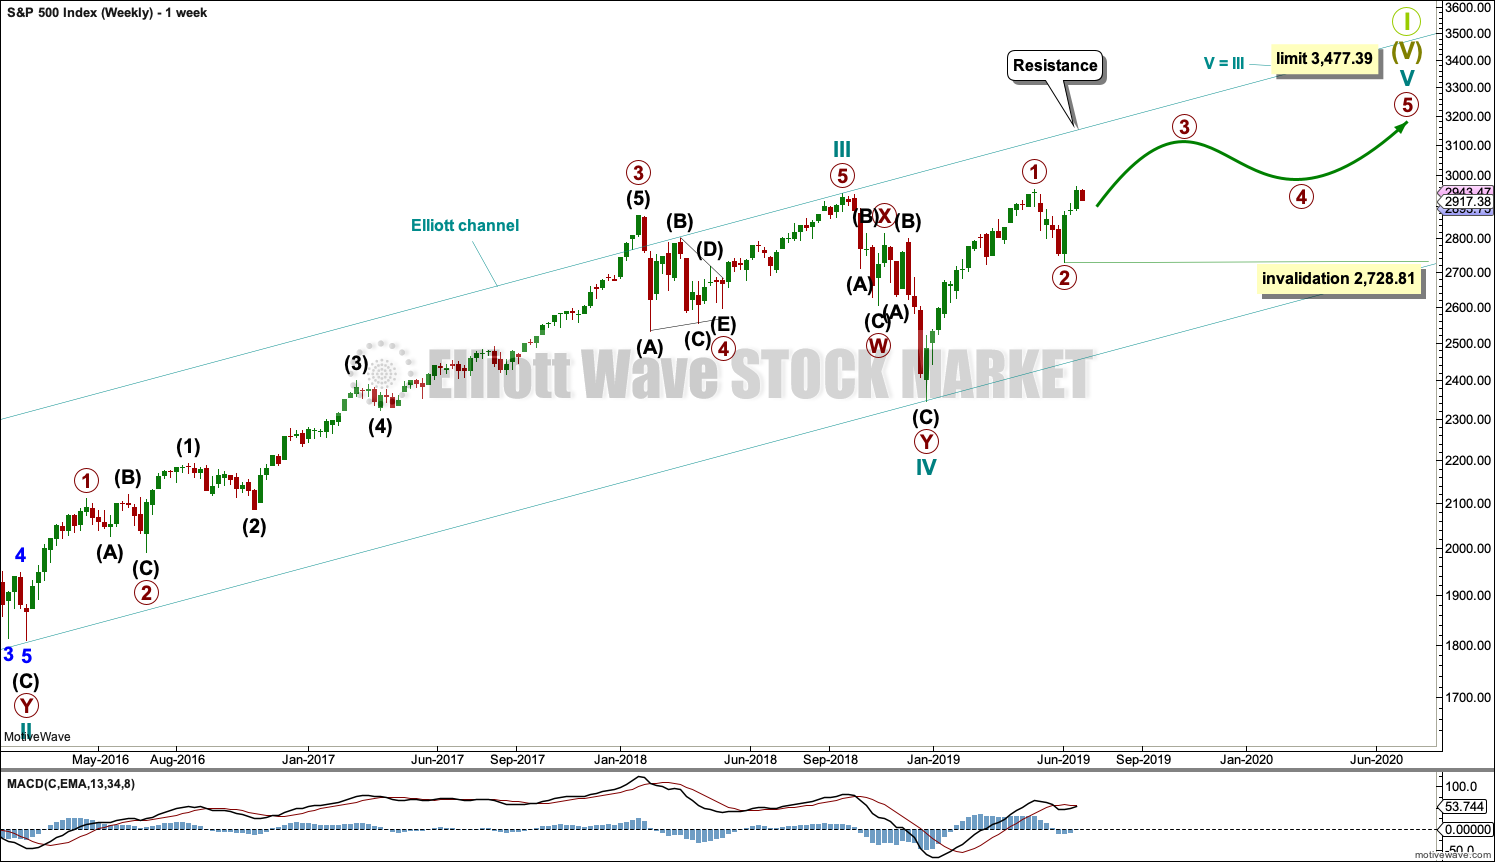
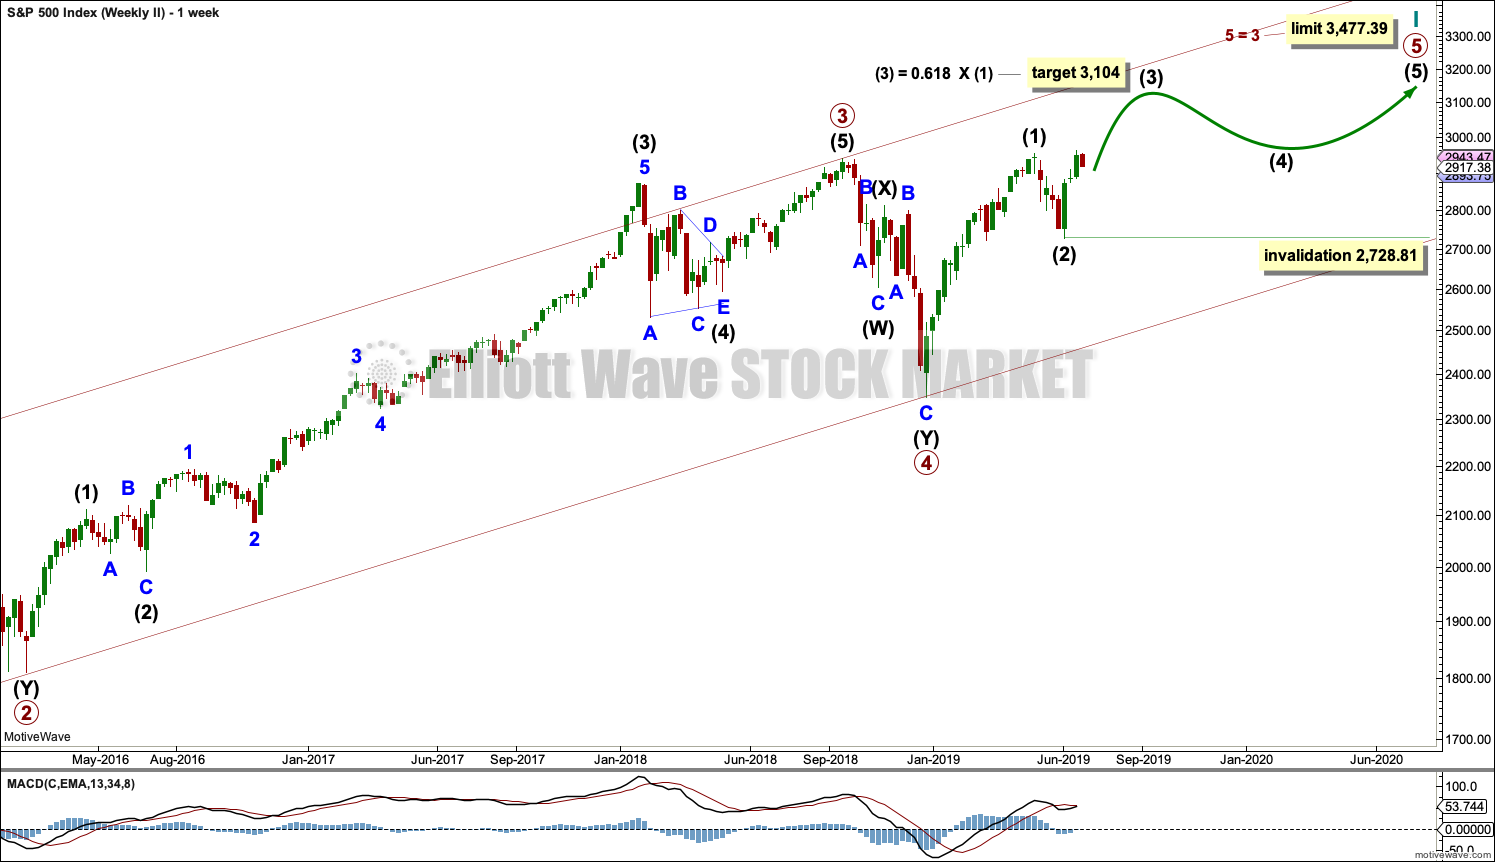
The basic Elliott wave structure consists of a five wave structure up followed by a three wave structure down (for a bull market). This wave count sees the bull market beginning in March 2009 as an incomplete five wave impulse and now within the last fifth wave, which is labelled cycle wave V. This impulse is best viewed on monthly charts. The weekly chart focusses on the end of it.
Elliott wave is fractal. This fifth wave labelled cycle wave V may end a larger fifth wave labelled Super Cycle wave (V), which may end a larger first wave labelled Grand Super Cycle wave I.
The teal Elliott channel is drawn using Elliott’s first technique about the impulse of Super Cycle wave (V). Draw the first trend line from the end of cycle wave I (off to the left of the chart, the weekly candlestick beginning 30th November 2014) to the end of cycle wave III, then place a parallel copy on the end of cycle wave II. This channel perfectly shows where cycle wave IV ended at support. The strongest portion of cycle wave III, the end of primary wave 3, overshoots the upper edge of the channel. This is a typical look for a third wave and suggests the channel is drawn correctly and the way the impulse is counted is correct.
Within Super Cycle wave (V), cycle wave III is shorter than cycle wave I. A core Elliott wave rule states that a third wave may never be the shortest. For this rule to be met in this instance, cycle wave V may not be longer in length than cycle wave III. This limit is at 3,477.39.
The structure of cycle wave V is focussed on at the daily chart level below.
Within cycle wave V, primary waves 1 and 2 may now be complete. Within primary wave 3, no second wave correction may move beyond its start below 2,728.81.
In historic analysis, two further monthly charts have been published that do not have a limit to upwards movement and are more bullish than this wave count. Members are encouraged to consider those possibilities (links below summary) alongside the wave counts presented on a daily and weekly basis.
DAILY CHART
Click chart to enlarge.
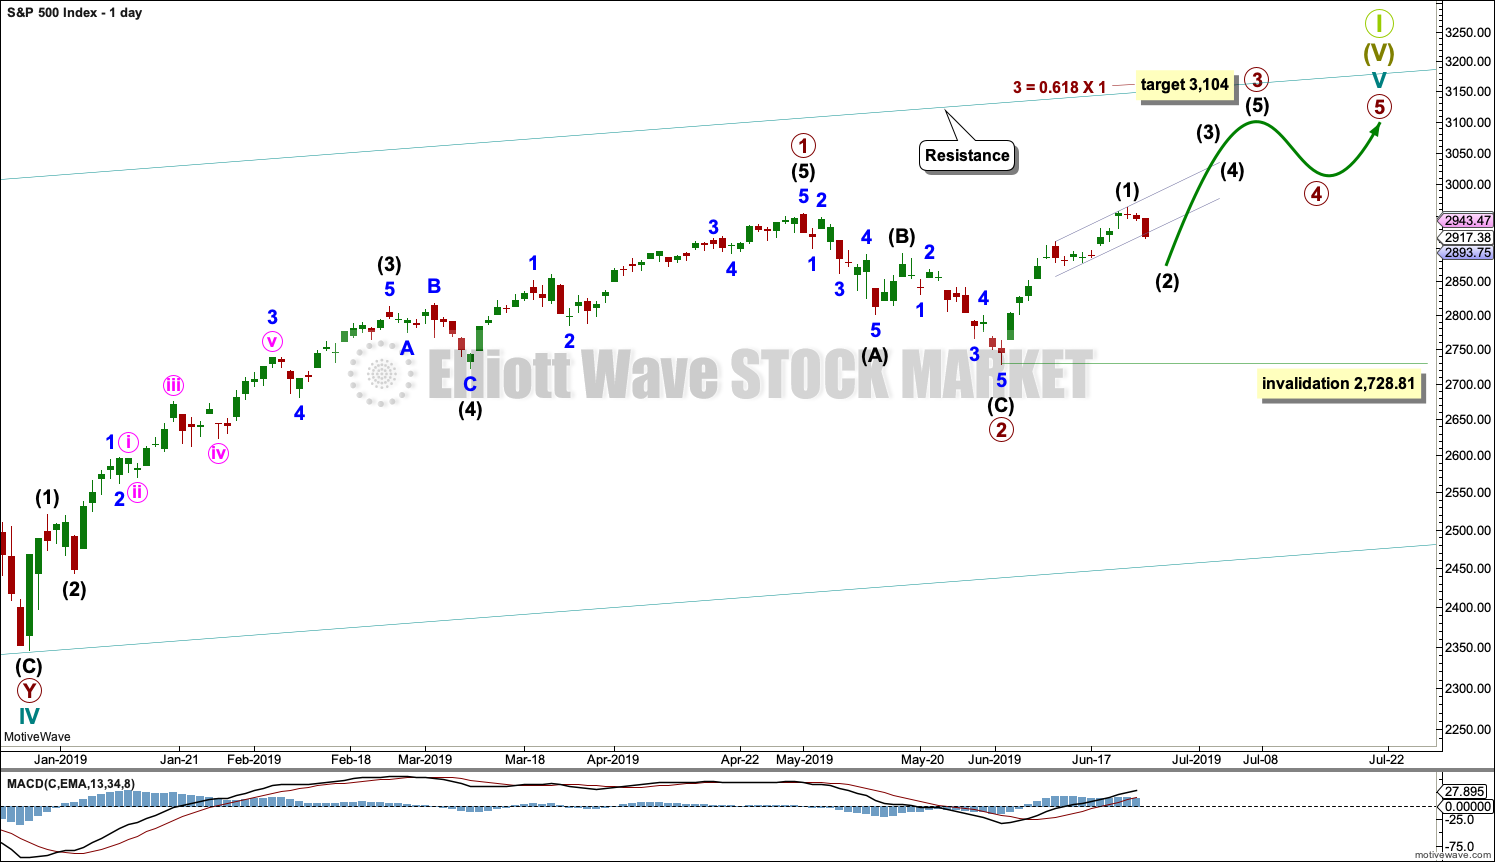
Cycle wave V must subdivide as a five wave motive structure. Within that five wave structure, primary waves 1 and 2 may be complete.
Primary wave 3 must move above the end of primary wave 1 (this rule has now been met). Primary wave 3 may only subdivide as an impulse. Within the impulse, intermediate wave (1) may have been over at the last high. Intermediate wave (2) may now be unfolding and may not move beyond the start of intermediate wave (1) below 2,728.81.
When primary wave 3 is over, then primary wave 4 may be a shallow sideways consolidation.
Thereafter, primary wave 5 should move above the end of primary wave 3 to avoid a truncation.
Primary wave 1 lasted 86 sessions, 3 short of a Fibonacci 89. Primary wave 2 lasted 22 sessions, 1 longer than a Fibonacci 21. Primary wave 3 may end about a Fibonacci 55 sessions, give or take two or three sessions either side. This is a rough guideline only.
So far primary wave 3 has lasted 16 sessions.
MAIN HOURLY CHART
Click chart to enlarge.
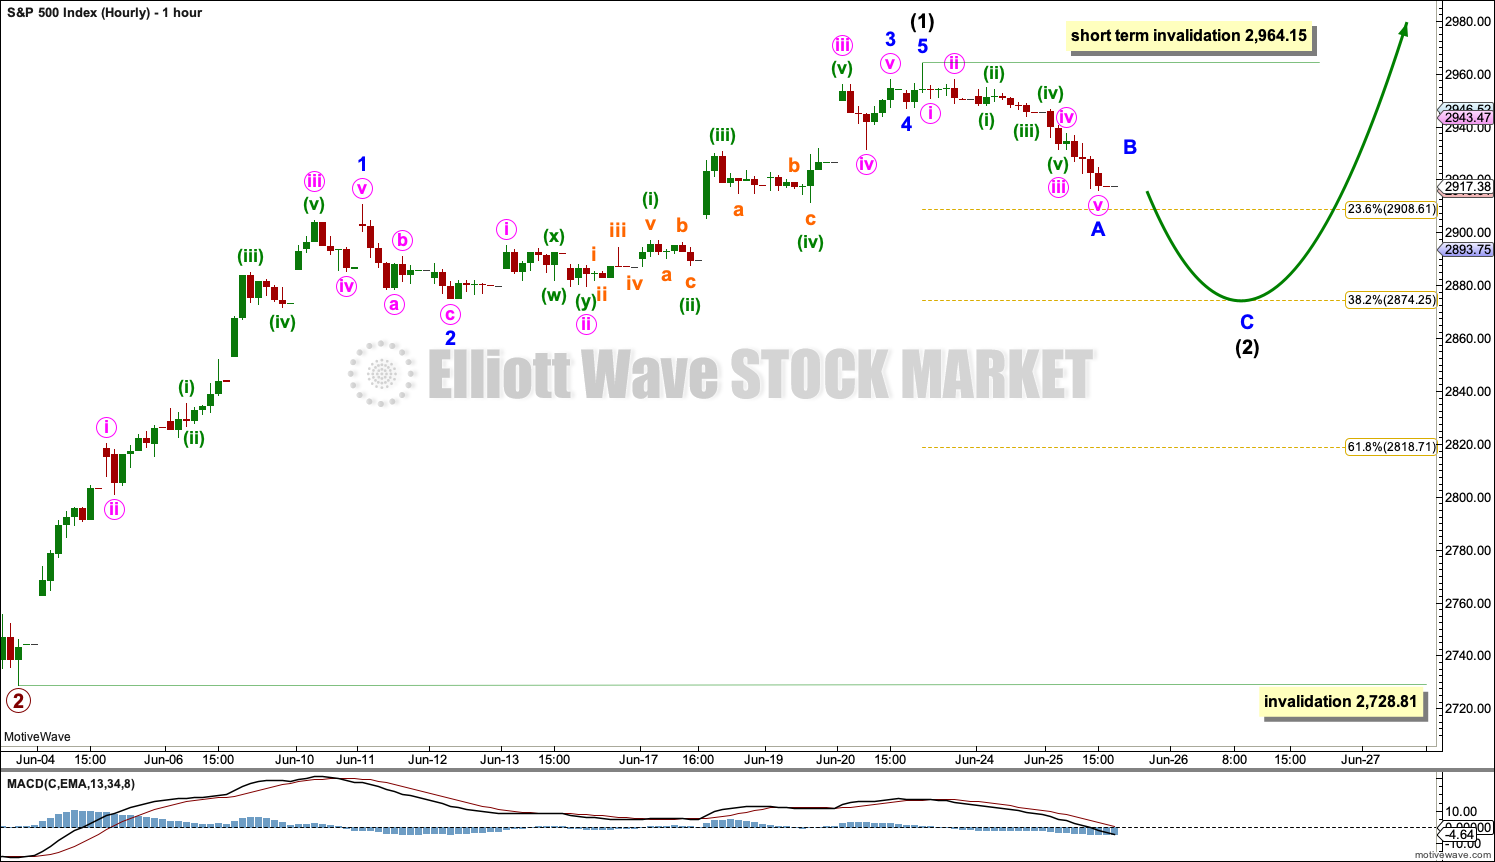
This short-term wave count is new today. It expects that intermediate wave (1) was over at the last high and intermediate wave (2) may be currently unfolding.
A preferred target for intermediate wave (2) may be the 0.382 Fibonacci ratio of intermediate wave (1). The strong upwards pull of intermediate wave (3) within primary wave 3 just ahead may force intermediate wave (2) to be relatively shallow.
Intermediate awe (2) would most likely subdivide as a zigzag. Minor wave A would most likely subdivide as a five wave structure, and it may be a complete impulse at today’s low. Minor wave B may not move beyond the start of minor wave A above 2,964.15.
ALTERNATE HOURLY CHART
Click chart to enlarge.
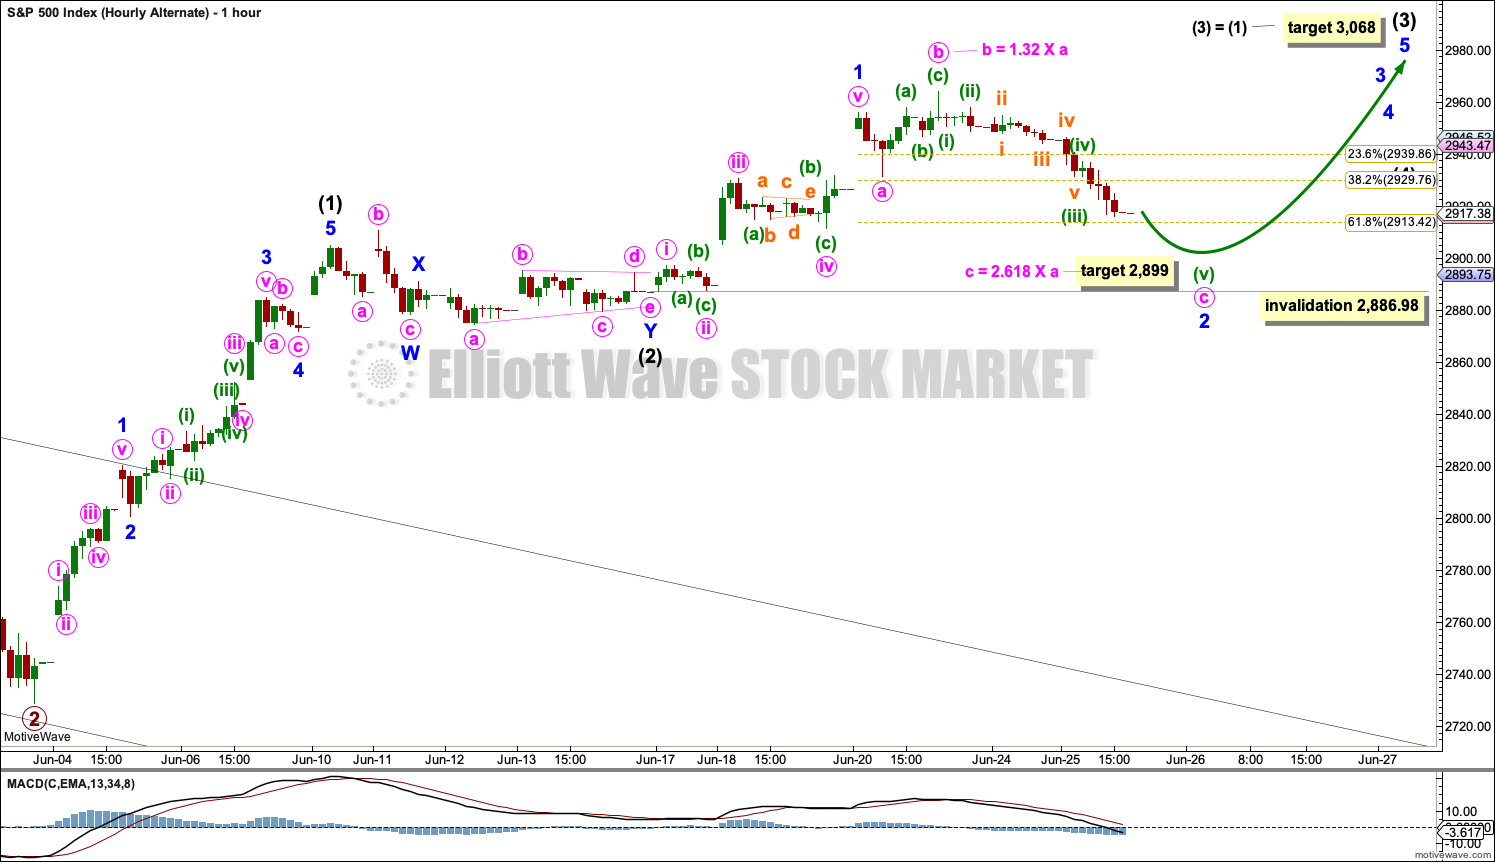
This wave count was the only hourly wave count up to yesterday. Today it is an alternate and may be discarded tomorrow if price continues lower. With deeper than expected movement today and bearish classic analysis suggesting more downwards movement ahead, minor wave 2 now looks out of proportion to intermediate wave (2) one degree higher. This wave count no longer has the right look.
Intermediate waves (1) and (2) may be complete. Intermediate wave (3) may have begun. Intermediate wave (3) may only subdivide as an impulse. A target is calculated for intermediate wave (3) to end.
Within intermediate wave (3), minor wave 1 may be complete.
Minor wave 1 fits well as a five wave impulse.
Minor wave 2 may be unfolding as an expanded flat correction. Within the flat, minute wave b subdivides well as a zigzag and is within the most common range of 1 to 1.38 times the length of minute wave a. At 2,924 minute wave c would reach 1.618 the length of minute wave a. This is close to the 0.382 Fibonacci ratio of minor wave 1, giving a 6 point target zone.
Minute wave c must sub divide as a five wave structure, most likely an impulse.
When minor wave 2 may be complete, then there may be a series of three first and second waves complete. This wave count would then expect a strong increase in upwards momentum.
SECOND WAVE COUNT
WEEKLY CHART
Click chart to enlarge.
This weekly chart is almost identical to the first weekly chart, with the sole exception being the degree of labelling.
This weekly chart moves the degree of labelling for the impulse beginning in March 2009 all down one degree. This difference is best viewed on monthly charts.
The impulse is still viewed as nearing an end; a fifth wave is still seen as needing to complete higher. This wave count labels it primary wave 5.
TECHNICAL ANALYSIS
MONTHLY CHART
Click chart to enlarge. Chart courtesy of StockCharts.com.
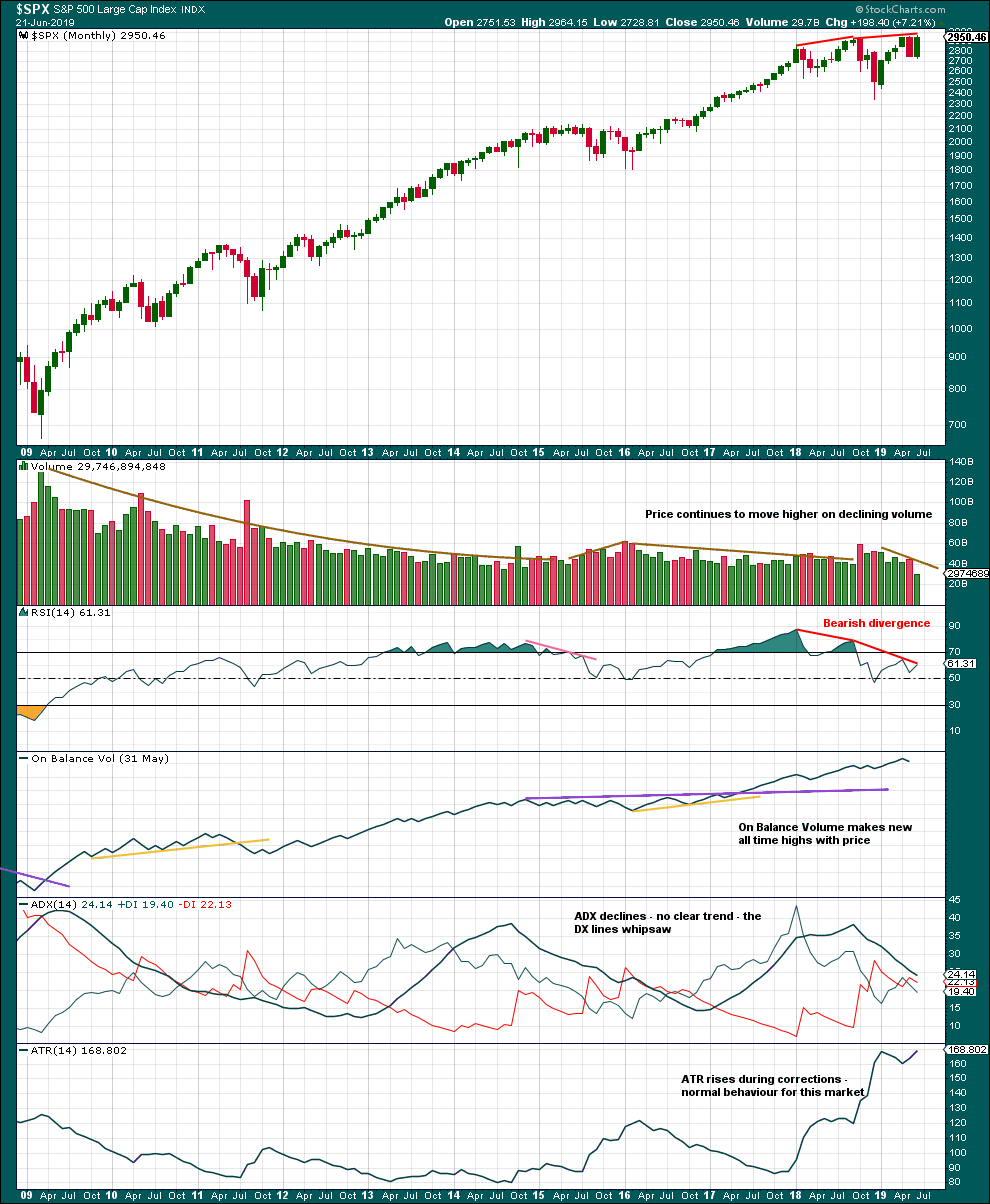
This monthly chart shows the entire bull market from the low in March 2009.
Greatest strength as measured by RSI was in what the Elliott wave count sees as the end of a third wave. This wave count fits with classic technical analysis.
Declining volume persisting for years fits an expectation for a Super Cycle degree fifth wave. This fits the first weekly chart. Although declining volume may also appear within a first wave, this may be less likely.
RSI currently exhibits strong bearish divergence over several months, which is a warning of some underlying weakness developed and persisting. This may continue as a fifth wave comes to an end.
WEEKLY CHART
Click chart to enlarge. Chart courtesy of StockCharts.com.
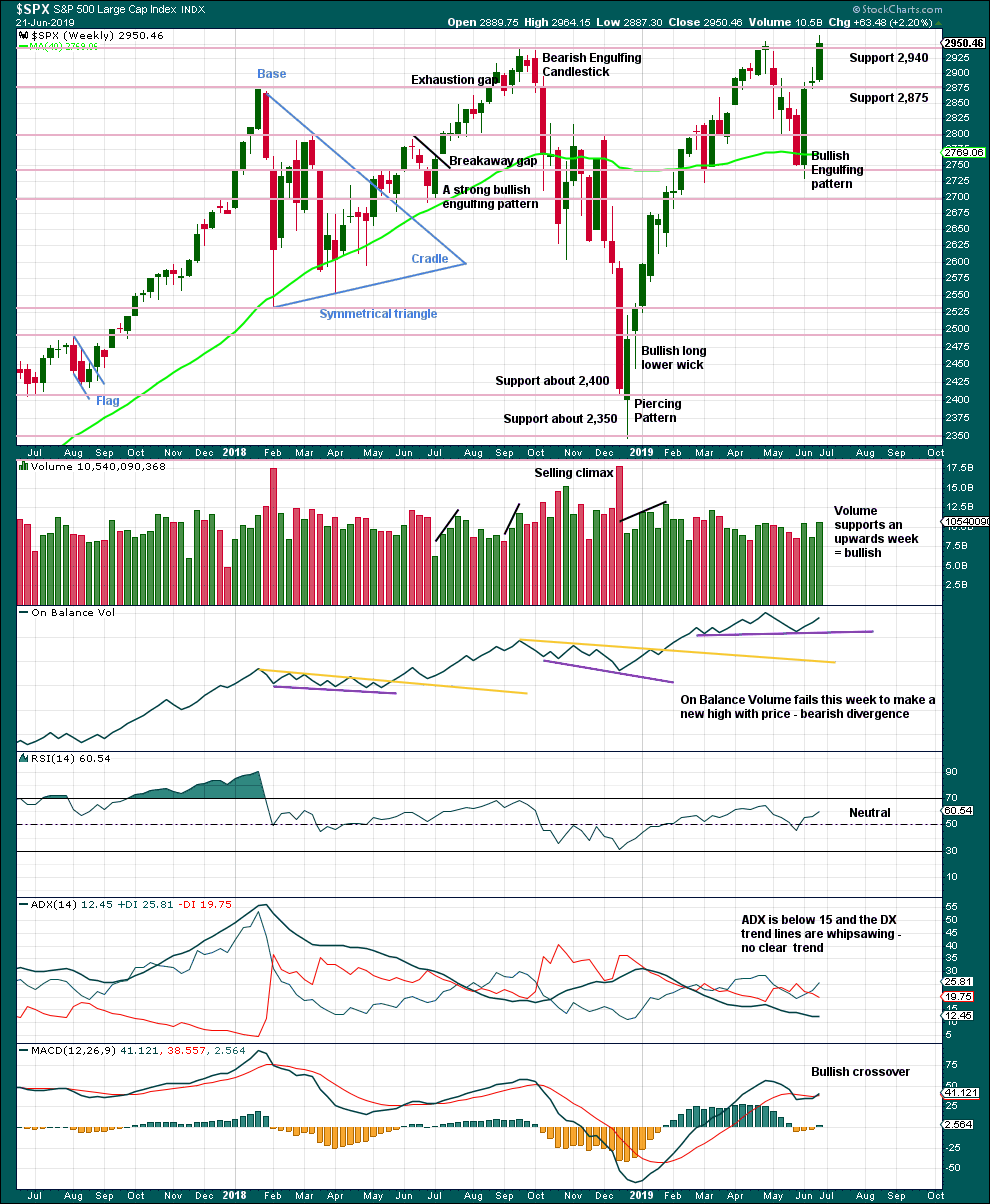
While price has made a new all time high on Friday, it has not closed at a new all time high. However, a strong bullish candlestick with support from volume suggests more upwards movement overall this week.
DAILY CHART
Click chart to enlarge. Chart courtesy of StockCharts.com.
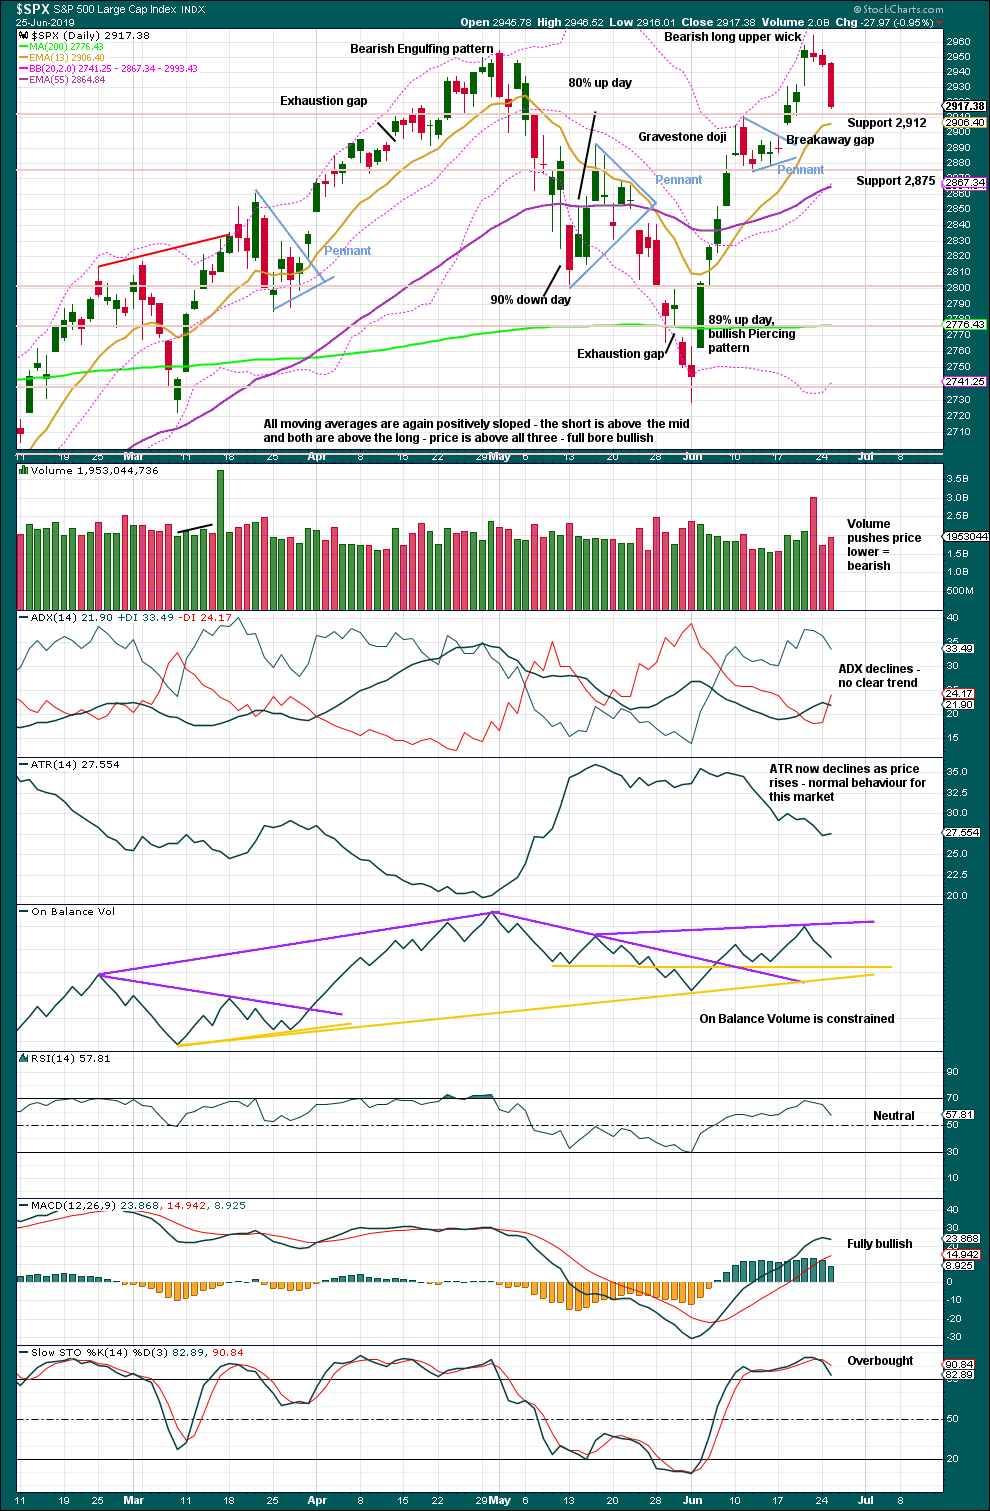
A target from the flag pole is recalculated about 3,079. This is 11 points above the short-term Elliott wave target at 3,068.
The breakaway gap may offer support at 2,897.27. If this gap is closed, then next support may be about 2,875, which is very close to the new preferred target on the hourly chart at 2,874.
Volume pushes price lower today and price closed near the low for the session. This suggests more downwards movement tomorrow.
BREADTH – AD LINE
WEEKLY CHART
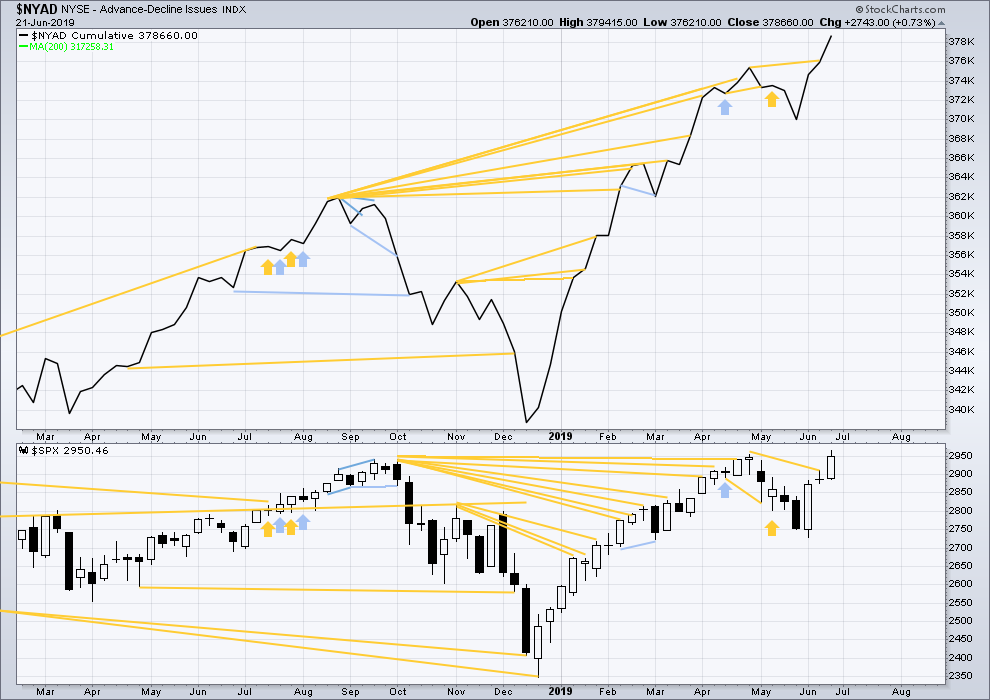
Click chart to enlarge. Chart courtesy of StockCharts.com. So that colour blind members are included, bearish signals
will be noted with blue and bullish signals with yellow.
Bear markets from the Great Depression and onwards have been preceded by an average minimum of 4 months divergence between price and the AD line with only two exceptions in 1946 and 1976. With the AD line making new all time highs last week, the end of this bull market and the start of a new bear market is very likely a minimum of 4 months away, which is mid October 2019.
In all bear markets in the last 90 years there is some positive correlation (0.6022) between the length of bearish divergence and the depth of the following bear market. No to little divergence is correlated with more shallow bear markets. Longer divergence is correlated with deeper bear markets.
If a bear market does develop here, it comes after no bearish divergence. It would therefore more likely be shallow.
Last week large caps have made new all time highs, but mid caps are a little distance off doing so and small caps are lagging far behind. This is normal in the latter stages of an aged bull market.
DAILY CHART
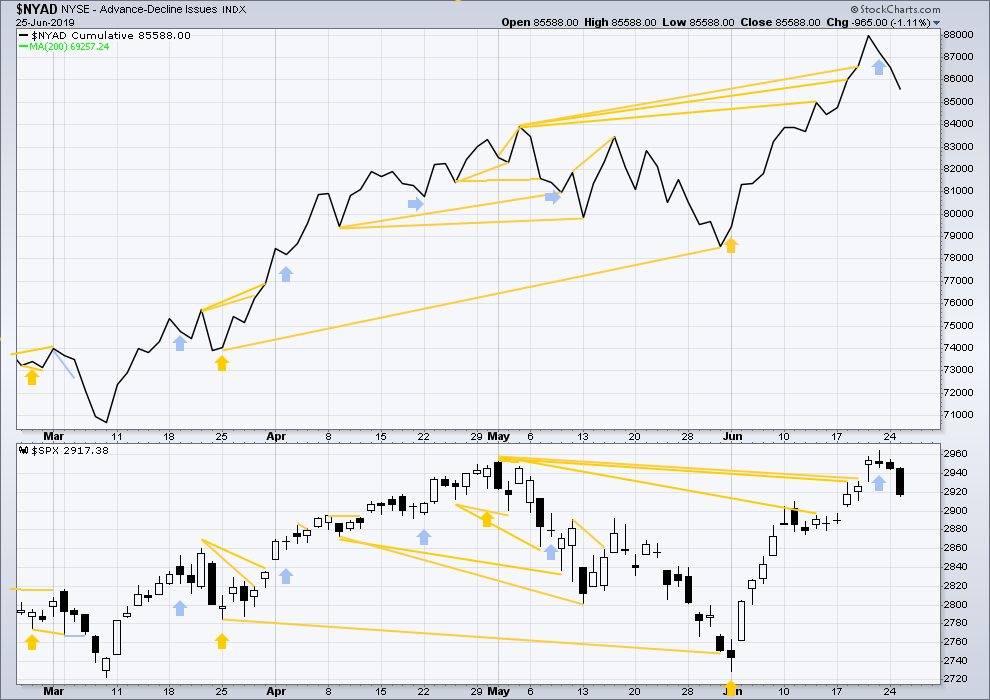
Click chart to enlarge. Chart courtesy of StockCharts.com. So that colour blind members are included, bearish signals
will be noted with blue and bullish signals with yellow.
Breadth should be read as a leading indicator.
Short-term bearish divergence noted on Friday has now been followed by two downwards days. It may be resolved here, or it may yet be followed by more downwards movement.
Today both price and the AD line have moved strongly lower. Neither have made a new swing low. There is no divergence.
VOLATILITY – INVERTED VIX CHART
WEEKLY CHART
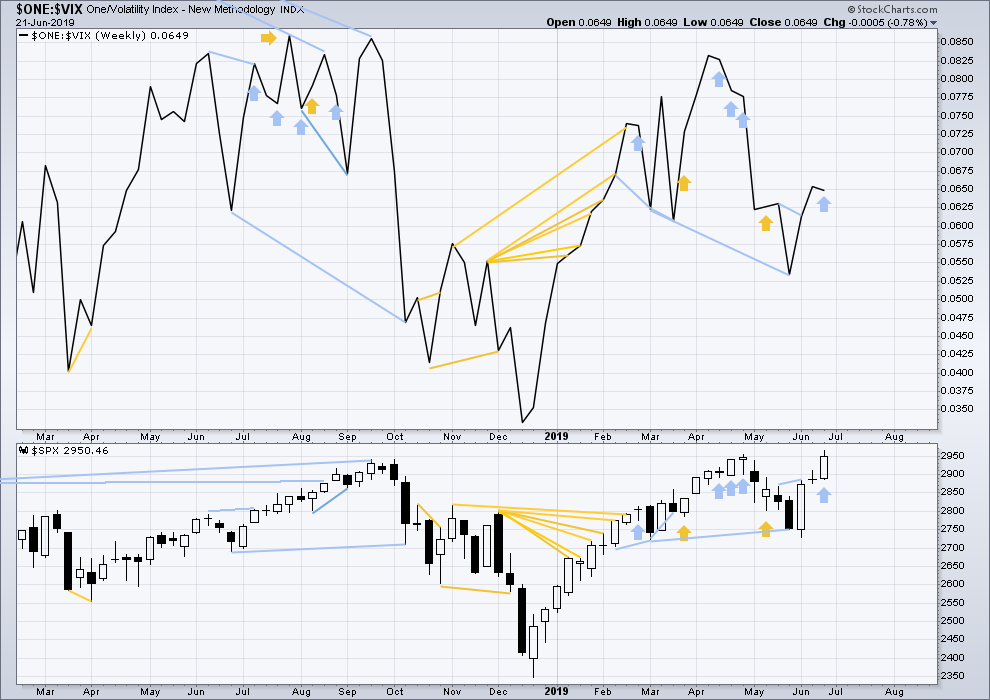
Click chart to enlarge. Chart courtesy of StockCharts.com. So that colour blind members are included, bearish signals
will be noted with blue and bullish signals with yellow.
Long-term bearish divergence remains. It may develop further before the upwards trend ends.
This week price moved higher, but inverted VIX has moved slightly lower. This is a single week of bearish divergence. The divergence may yet develop further before it is followed by reasonable downwards movement.
DAILY CHART
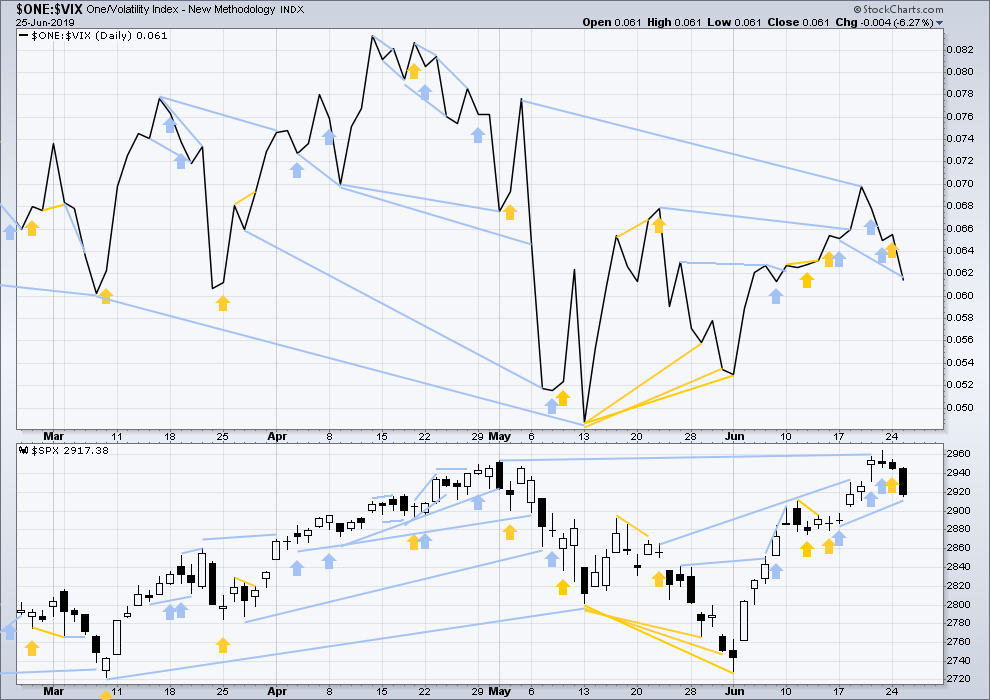
Click chart to enlarge. Chart courtesy of StockCharts.com. So that colour blind members are included, bearish signals
will be noted with blue and bullish signals with yellow.
Bullish divergence noted in last analysis has been followed by a strong downwards day. It is considered to have failed.
Today inverted VIX has made a new low below the prior low of the 17th of June, but price has not. This divergence is bearish for the short term.
DOW THEORY
Dow Theory confirmed a bear market in December 2018. This does not necessarily mean a bear market at Grand Super Cycle degree though; Dow Theory makes no comment on Elliott wave counts. On the 25th of August 2015 Dow Theory also confirmed a bear market. The Elliott wave count sees that as part of cycle wave II. After Dow Theory confirmation of a bear market in August 2015, price went on to make new all time highs and the bull market continued.
DJIA: 23,344.52 – a close on the 19th of December at 23,284.97 confirms a bear market.
DJT: 9,806.79 – price has closed below this point on the 13th of December.
S&P500: 2,532.69 – a close on the 19th of December at 2,506.96 provides support to a bear market conclusion.
Nasdaq: 6,630.67 – a close on the 19th of December at 6,618.86 provides support to a bear market conclusion.
With all the indices having moved higher following a Dow Theory bear market confirmation, Dow Theory would confirm a bull market if the following highs are made:
DJIA: 26,951.81
DJT: 11,623.58
S&P500: 2,940.91 – a new all time high has been made on the 29th of April 2019.
Nasdaq: 8,133.30 – a new high has been made on 24th of April 2019.
Published @ 07:08 p.m. EST.
—
Careful risk management protects your trading account(s).
Follow my two Golden Rules:
1. Always trade with stops.
2. Risk only 1-5% of equity on any one trade.
—
New updates to this analysis are in bold.
Hourly chart updated:
this looks like 5-3- and now 5 to complete a zigzag.
Sorry Peter!
Just in time, thanks Lara!
Hmmm…gonna need some hedging here methinks….
i say we completed a 5 down, and its up time….
until Lara corrects me 🙂
Looks like the Alternate is the right one but don’t think it will get to the target, seems like low is in for the day… G20 over the weekend
The main Hourly still looks good to me. The quick pop up for B this morning and now down in C of (2). Will probably continue down to the target tomorrow, IMHO.
If that was really B up this morning, it looks a little weak though.
Well it looked more like a 4th wave triangle (could also be B wave traingle, so main is still alive) but i think for that it really needs to break strong support here, doesn’t seem to have volume or energy to do that but u never know….
Hourly B could be a developing Expanded Flat to kill some time. That would make the proportions to A somewhat better.
I love thinking out loud, anticipating Lara’s arrival to keep us on the right track…
Carolyn Boroden’s “time cycles” video from 6/26/19 is worth watching (a search using “Boroden time cycles” finds it). She uses fibonacci extensions of TIME at all the usual percentages on the time period of high to high, high to low, and low to high swings to identify “clusters” in time in the future that may indicate a market turn. Sure enough, lots lined up with a day or two of the recent high. Good stuff if you aren’t familiar with time cycle analysis. I need to do more of that myself.
Thanks Kevin, I’ll watch it.
Does it mean that we have had a high for a long time??
like all indicators, there’s no guarantee her cycles “perform”, nor to what degree. clearly she nailed the turn this time (and often does!) with this technique, but this little public video where she promotes her service by showing real results doesn’t speak to targets. She usually runs loads of retrace and extension fibo’s to find cluster areas, and she’s also big on symmetric projections to add to target clusters, and I suspect she has one or two such zones identified as targets for her customers who took shorts.
DRIP second bounce off the 0.618, reload now or gap fill at 0.786….
Triangle-ing.
But what’s the right count? I suspect the one I put in ? marks, i.e., consolidation then more down….
well that was wrong in every way possible…
so my short term calls near the high, loaded puts sold half already looking to fill the gap, and then SOH for more info
*sold
you seem to have that short term trading thing pretty solid Peter. No fear, follow the count and the action, commit, and ring the register! “That ain’t workin’, that’s the way you do it!”. You make it look easy, but I know for a fact it’s not. it’s a difficult style to master.
small positions, keeps me busy
need you guys for the big picture long term stuff
thanks to all who post !
that’s the way to do it as you build up experience and confidence and most critically, a proof of a winning methodology. Get that solid and size it up slow but sure!
Thank you Kevin – ES futures is ES1! on TradingView. Now I can watch charts into the night. Won’t my wife be pleased. 🙂
ROTFLMAO!!!! Spouse’s just don’t get it, do they? It’s…it’s…THE GREATEST GAME IN THE HISTORY OF MANKIND!! So of course it’s a top priority…
Just be sure she’s happy with the bottom line results and you’ll squeak by.
Drat! Opening gap & crap on the short term chart. Could be Lara’s hourly B-wave…
C of (2) coming?
Hey Kevin, 2 of your 3 lines in the sand have been crossed this morning. Are you going long yet?
Ron I’m already long as a kite high the sky. about 24 “small” positions that take up about 95% of my money, lol!!! So if we get a hard crash here, I’ll take as much as a 15% hit on my overall equity (though that would be remarkable, 10% would be more likely in that scenario). I’m banking on the higher tf count being oh so right. But my stops (and limit profit sells) are all in place.
/ES hourly with overnight data…Trend line broken….first key level broken….second touched but turned away (2939 here on /ES, which is about 2935 on SPX). I think it will fall shortly, then the next big test is the strong descending trend line shown. If it gets above that…probably this 2 or whatever degree is over.
I can’t seem to get /ES on my charting platform (TradingView) I guess I have to pay extra for that. I’m translating your /ES chart to SPX and SPY.
Some day I hoping to figure out e-mini trading. Right now just simple SPY & QQQ directional calls & puts. Mostly intraday, sometimes hold for a few days, but never hold over a weekend – I’m chicken!
To be clear, I don’t trade futures. I like /ES because I view it as the nose of the dog. What happens in SPX tends to happen first (by a minute perhaps?) in /ES. I also think the market action including the overnight is revealing in an additive way to the daily session only view in SPX.
I think the /ES symbol in tradingview is ES1!. Or maybe just ES1. Try both.
type ES and wait for it to fill with choices and the use ES1
#1
Lonely at the top, Ron?
May the market come up and find you there!