
For the very short term, a small pullback was expected to begin the new trading week, which is what has happened. The Elliott wave count and targets remain the same.
Summary: For the very short term, a little more downwards movement may find support about 2,930 to 2,924.
The low of December 2018 is expected to most likely remain intact.
The next short-term target is at 3,068 (Elliott wave) to 3,079 (classic analysis from the pennant). This next upwards wave may exhibit further strength. Look for corrections to continue to be very shallow and brief.
The mid-term target remains at 3,104 for a more time consuming consolidation or pullback, which may also be shallow.
The biggest picture, Grand Super Cycle analysis, is here.
Monthly charts were last published here, with video here. There are two further alternate monthly charts here, with video here.
ELLIOTT WAVE COUNTS
The two Elliott wave counts below will be labelled First and Second. They may be about of even probability. When the fifth wave currently unfolding on weekly charts may be complete, then these two wave counts will diverge on the severity of the expected following bear market. To see an illustration of this future divergence monthly charts should be viewed.
FIRST WAVE COUNT
WEEKLY CHART
Click chart to enlarge.
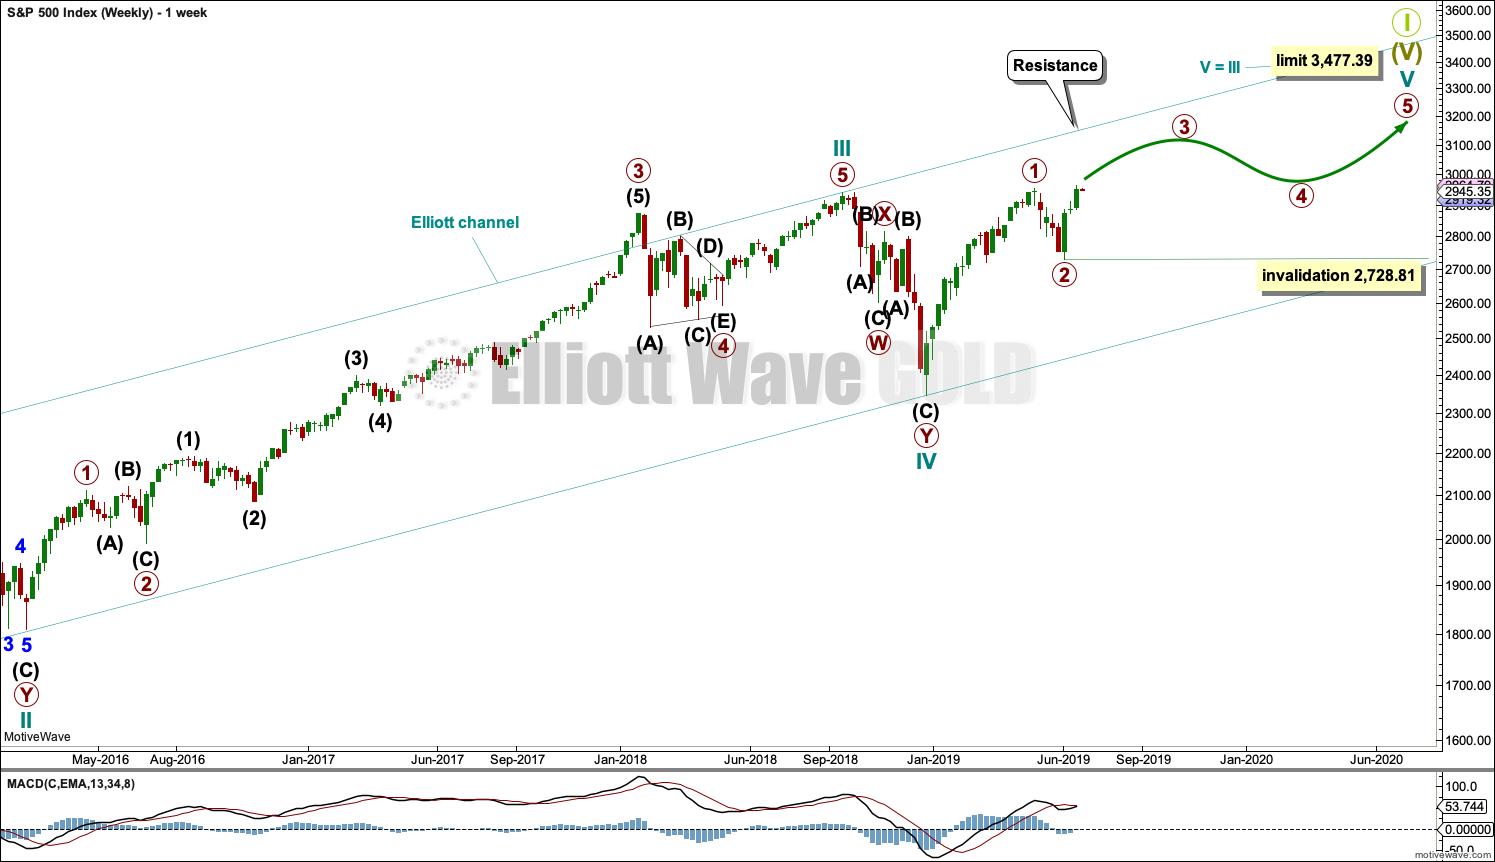
The basic Elliott wave structure consists of a five wave structure up followed by a three wave structure down (for a bull market). This wave count sees the bull market beginning in March 2009 as an incomplete five wave impulse and now within the last fifth wave, which is labelled cycle wave V. This impulse is best viewed on monthly charts. The weekly chart focusses on the end of it.
Elliott wave is fractal. This fifth wave labelled cycle wave V may end a larger fifth wave labelled Super Cycle wave (V), which may end a larger first wave labelled Grand Super Cycle wave I.
The teal Elliott channel is drawn using Elliott’s first technique about the impulse of Super Cycle wave (V). Draw the first trend line from the end of cycle wave I (off to the left of the chart, the weekly candlestick beginning 30th November 2014) to the end of cycle wave III, then place a parallel copy on the end of cycle wave II. This channel perfectly shows where cycle wave IV ended at support. The strongest portion of cycle wave III, the end of primary wave 3, overshoots the upper edge of the channel. This is a typical look for a third wave and suggests the channel is drawn correctly and the way the impulse is counted is correct.
Within Super Cycle wave (V), cycle wave III is shorter than cycle wave I. A core Elliott wave rule states that a third wave may never be the shortest. For this rule to be met in this instance, cycle wave V may not be longer in length than cycle wave III. This limit is at 3,477.39.
The structure of cycle wave V is focussed on at the daily chart level below.
Within cycle wave V, primary waves 1 and 2 may now be complete. Within primary wave 3, no second wave correction may move beyond its start below 2,728.81.
In historic analysis, two further monthly charts have been published that do not have a limit to upwards movement and are more bullish than this wave count. Members are encouraged to consider those possibilities (links below summary) alongside the wave counts presented on a daily and weekly basis.
DAILY CHART
Click chart to enlarge.
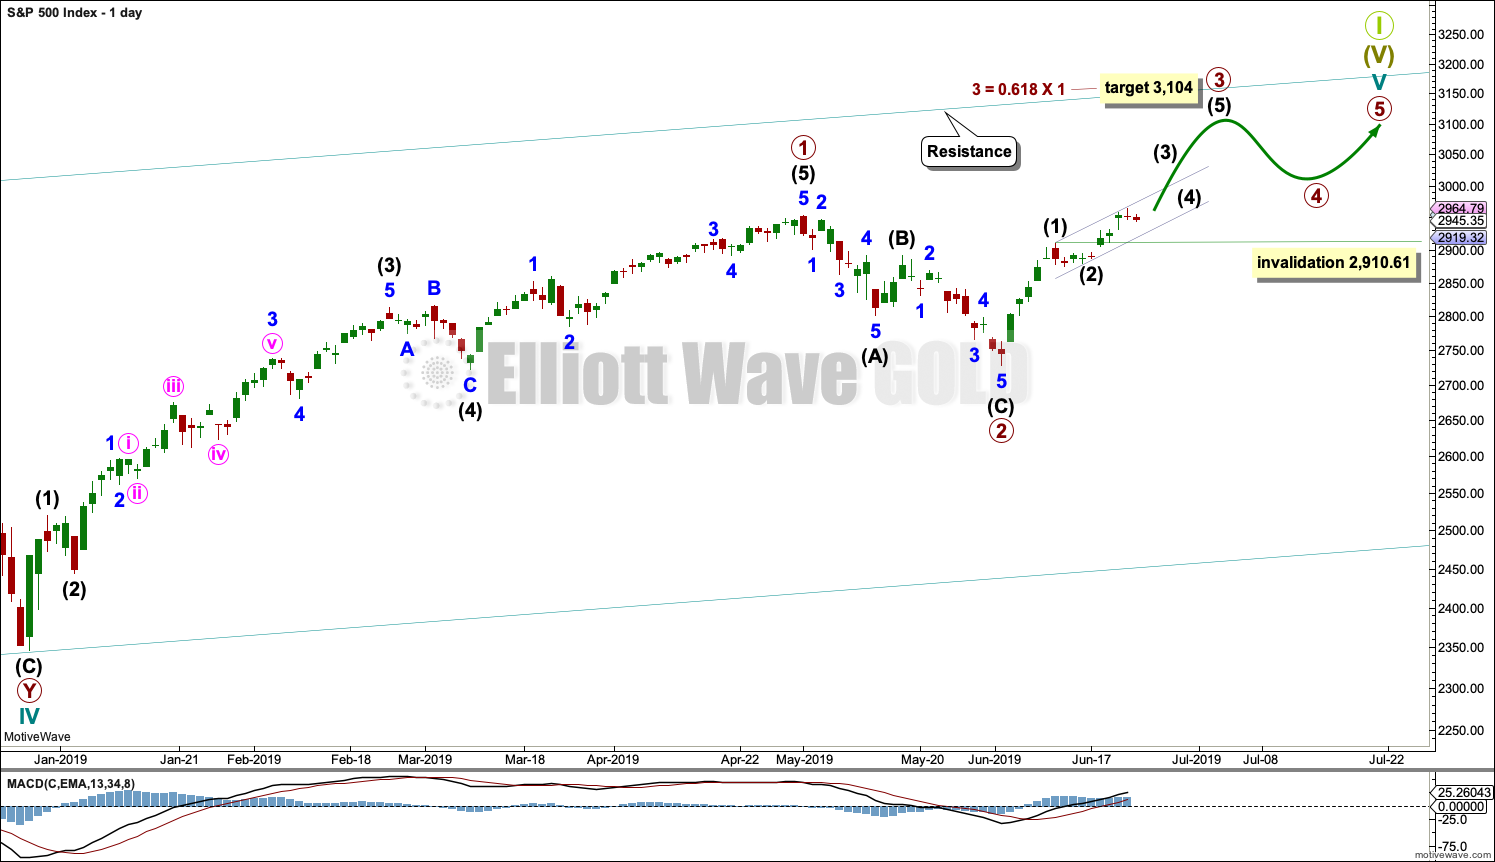
Cycle wave V must subdivide as a five wave motive structure. Within that five wave structure, primary waves 1 and 2 may be complete.
Primary wave 3 must move above the end of primary wave 1 (this rule has now been met). Primary wave 3 may only subdivide as an impulse. Within the impulse, intermediate waves (1) and (2) may be complete. Intermediate wave (3) has moved above the end of intermediate wave (1) meeting a core Elliott wave rule. When it arrives, intermediate wave (4) may not move into intermediate wave (1) price territory below 2,910.61.
When primary wave 3 is over, then primary wave 4 may be a shallow sideways consolidation.
Thereafter, primary wave 5 should move above the end of primary wave 3 to avoid a truncation.
The best fit channel on the daily and hourly charts in last analysis is removed as it did not show where downwards movement today found support. A narrow acceleration channel is drawn: draw the first trend line from the end of intermediate wave (1) to the end of minor wave 1, then place a parallel copy on the end of intermediate wave (2). The lower edge of this channel may show where minor wave 2 may find support.
Primary wave 1 lasted 86 sessions, 3 short of a Fibonacci 89. Primary wave 2 lasted 22 sessions, 1 longer than a Fibonacci 21. Primary wave 3 may end about a Fibonacci 55 sessions, give or take two or three sessions either side. This is a rough guideline only.
So far primary wave 3 has lasted 15 sessions.
HOURLY CHART
Click chart to enlarge.
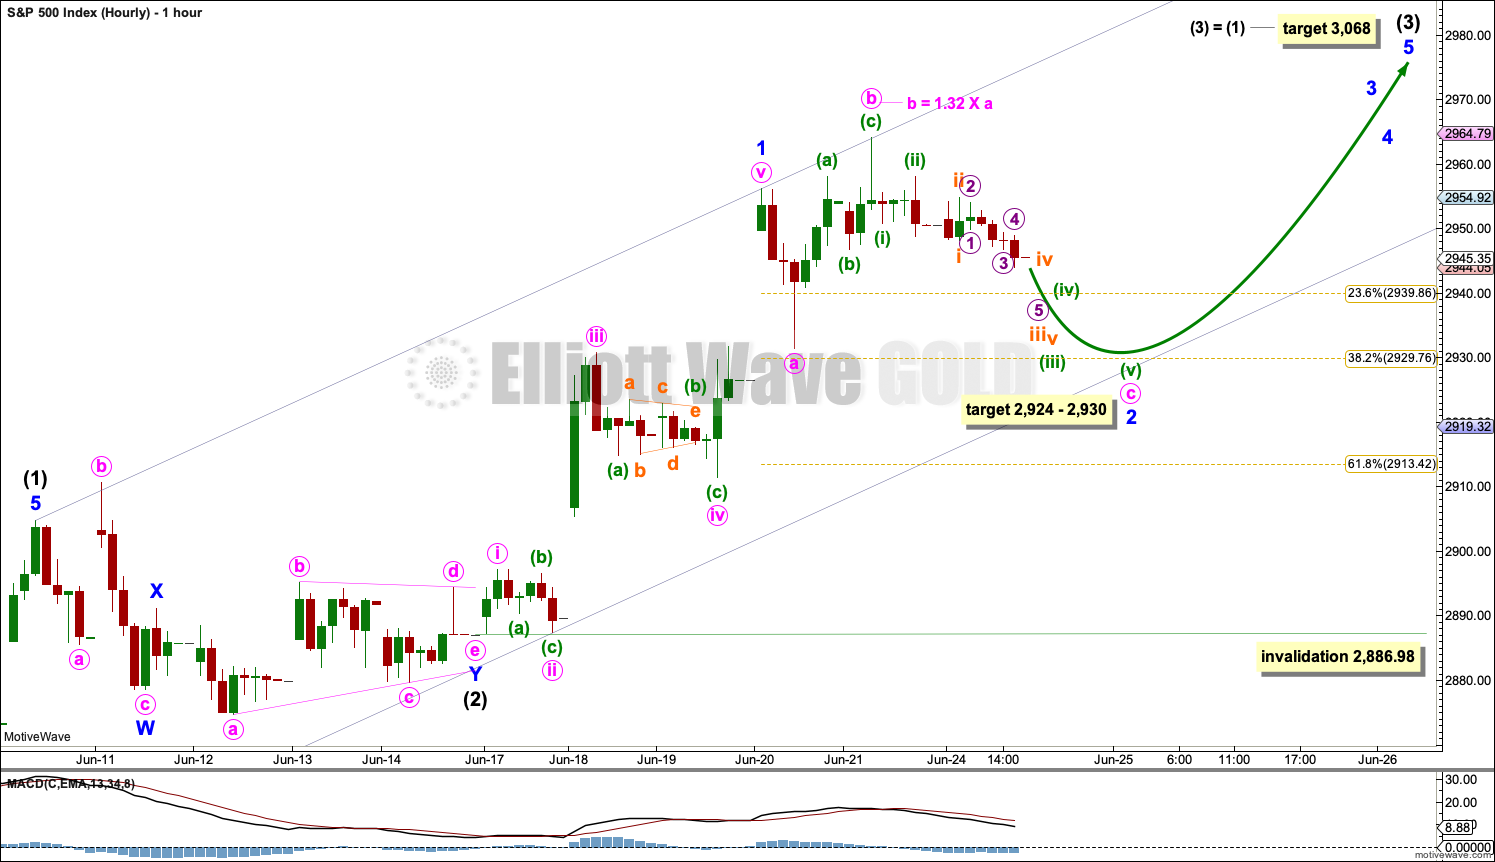
A target is calculated for intermediate wave (3) to end.
Intermediate wave (3) may only subdivide as an impulse. Within intermediate wave (3), minor wave 1 may be complete.
The newly drawn acceleration channel is copied over from the daily chart.
Minor wave 1 fits well as a five wave impulse.
Minor wave 2 may be unfolding as an expanded flat correction. Within the flat, minute wave b subdivides well as a zigzag and is within the most common range of 1 to 1.38 times the length of minute wave a. At 2,924 minute wave c would reach 1.618 the length of minute wave a. This is close to the 0.382 Fibonacci ratio of minor wave 1, giving a 6 point target zone.
Minute wave c must sub divide as a five wave structure, most likely an impulse.
When minor wave 2 may be complete, then there may be a series of three first and second waves complete. This wave count would then expect a strong increase in upwards momentum.
SECOND WAVE COUNT
WEEKLY CHART
Click chart to enlarge.
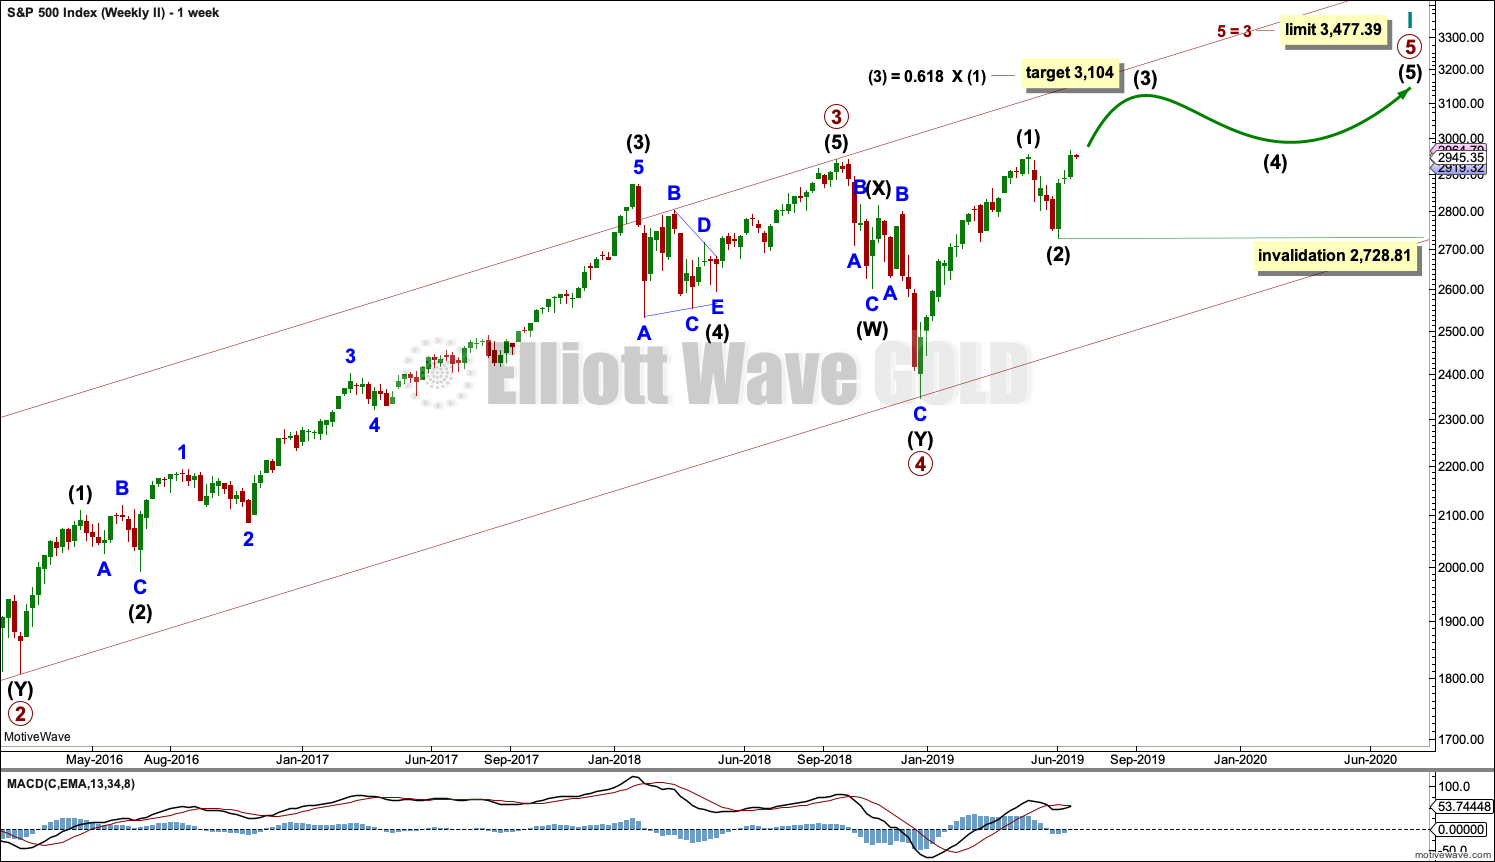
This weekly chart is almost identical to the first weekly chart, with the sole exception being the degree of labelling.
This weekly chart moves the degree of labelling for the impulse beginning in March 2009 all down one degree. This difference is best viewed on monthly charts.
The impulse is still viewed as nearing an end; a fifth wave is still seen as needing to complete higher. This wave count labels it primary wave 5.
TECHNICAL ANALYSIS
MONTHLY CHART
Click chart to enlarge. Chart courtesy of et=”_blank”>StockCharts.com.
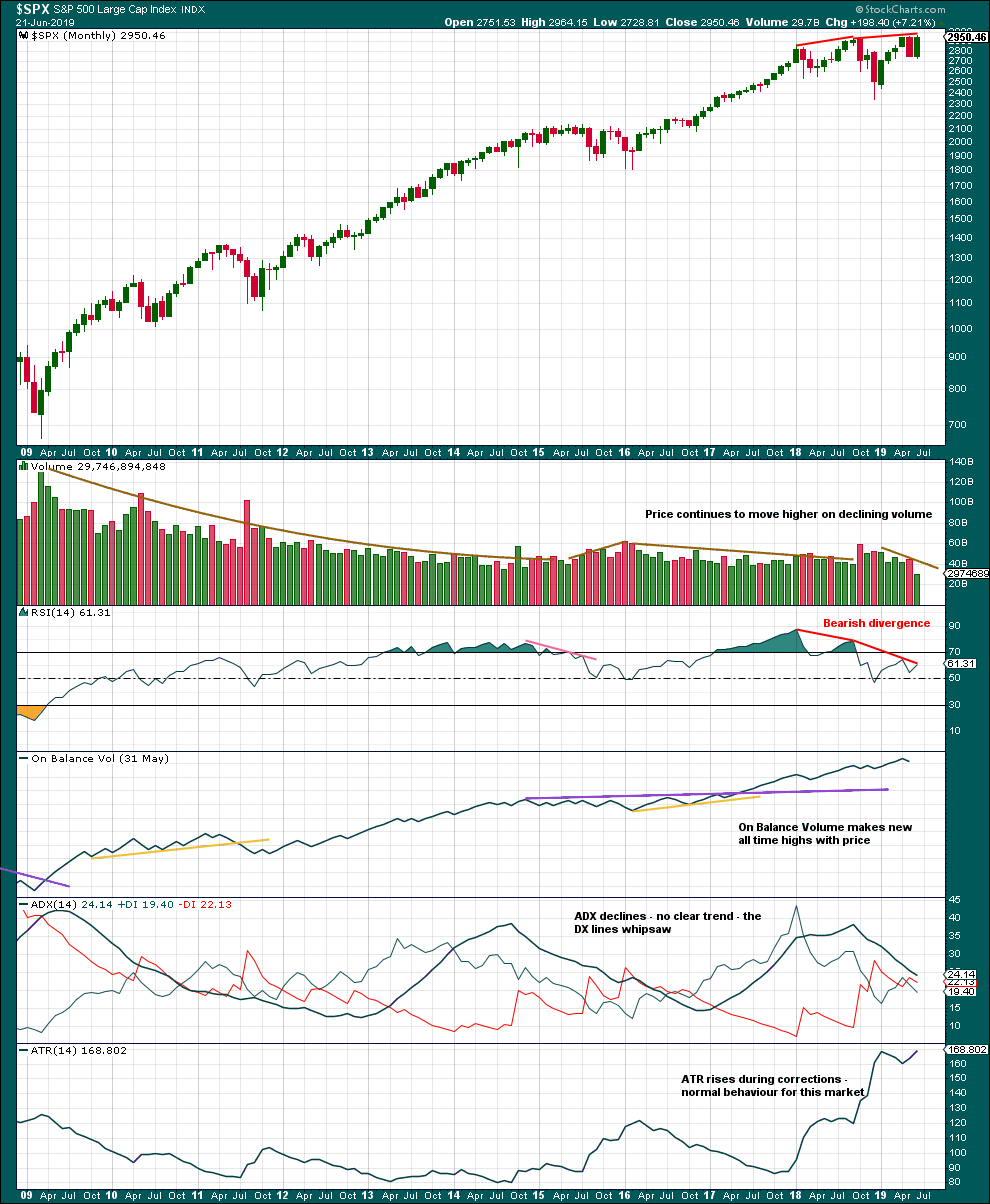
This monthly chart shows the entire bull market from the low in March 2009.
Greatest strength as measured by RSI was in what the Elliott wave count sees as the end of a third wave. This wave count fits with classic technical analysis.
Declining volume persisting for years fits an expectation for a Super Cycle degree fifth wave. This fits the first weekly chart. Although declining volume may also appear within a first wave, this may be less likely.
RSI currently exhibits strong bearish divergence over several months, which is a warning of some underlying weakness developed and persisting. This may continue as a fifth wave comes to an end.
WEEKLY CHART
Click chart to enlarge. Chart courtesy of et=”_blank”>StockCharts.com.
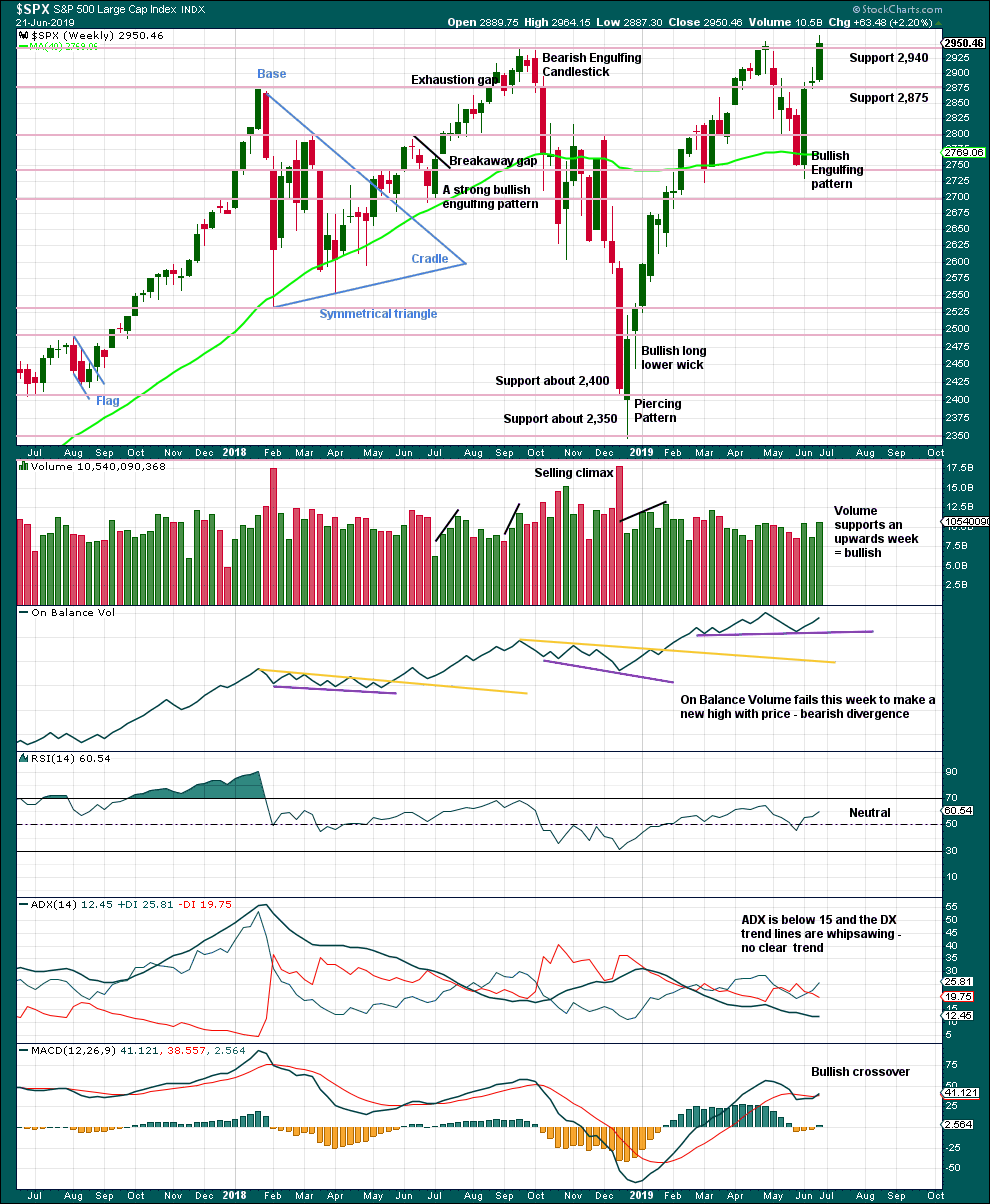
While price has made a new all time high on Friday, it has not closed at a new all time high. However, a strong bullish candlestick with support from volume suggests more upwards movement overall this week.
DAILY CHART
Click chart to enlarge. Chart courtesy of StockCharts.com.
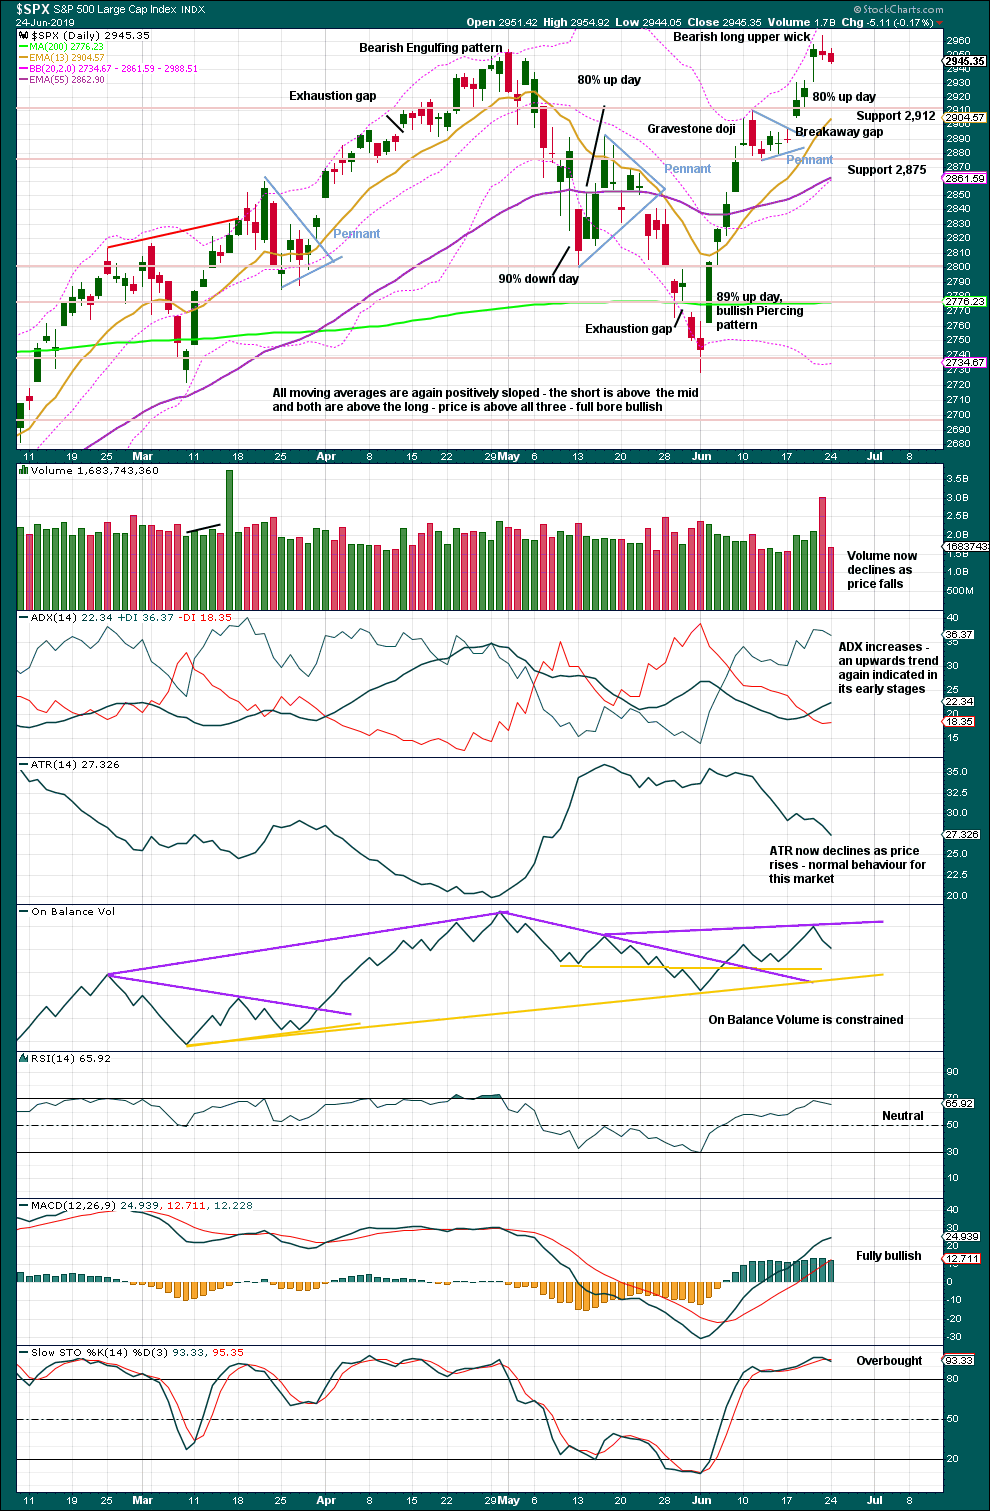
A target from the flag pole is recalculated about 3,079. This is 11 points above the short-term Elliott wave target at 3,068.
The breakaway gap may offer support at 2,897.27.
For the very short term, a strong decline in volume today shows sellers are no longer actively pushing price lower. Downwards movement may now be limited.
BREADTH – AD LINE
WEEKLY CHART
Click chart to enlarge. Chart courtesy of StockCharts.com. So that colour blind members are included, bearish signals
will be noted with blue and bullish signals with yellow.
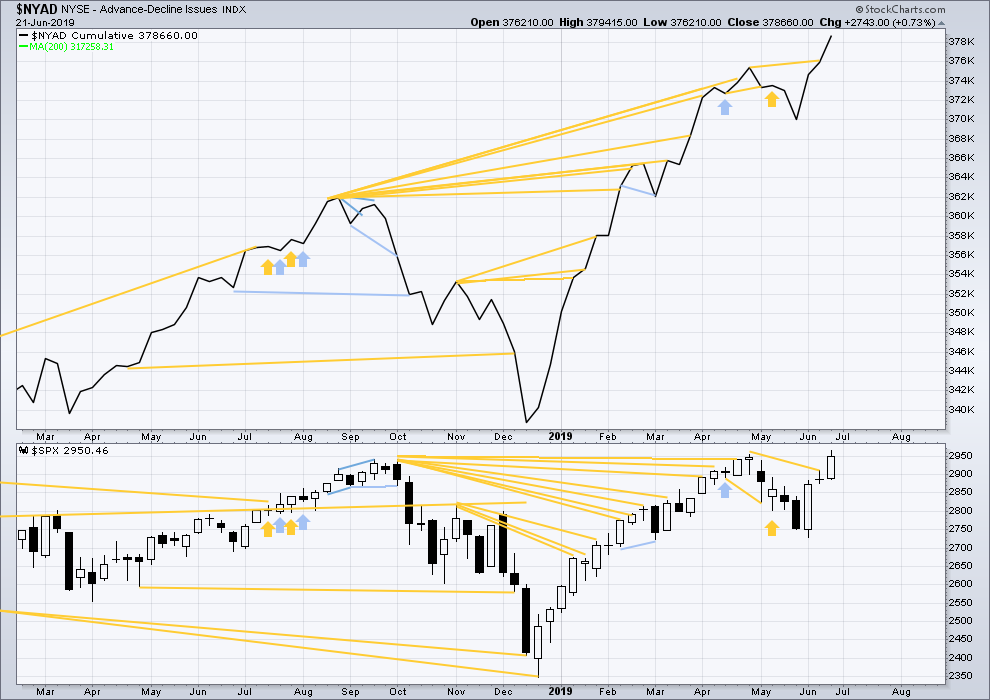
Bear markets from the Great Depression and onwards have been preceded by an average minimum of 4 months divergence between price and the AD line with only two exceptions in 1946 and 1976. With the AD line making new all time highs last week, the end of this bull market and the start of a new bear market is very likely a minimum of 4 months away, which is mid October 2019.
In all bear markets in the last 90 years there is some positive correlation (0.6022) between the length of bearish divergence and the depth of the following bear market. No to little divergence is correlated with more shallow bear markets. Longer divergence is correlated with deeper bear markets.
If a bear market does develop here, it comes after no bearish divergence. It would therefore more likely be shallow.
Last week large caps have made new all time highs, but mid caps are a little distance off doing so and small caps are lagging far behind. This is normal in the latter stages of an aged bull market.
DAILY CHART
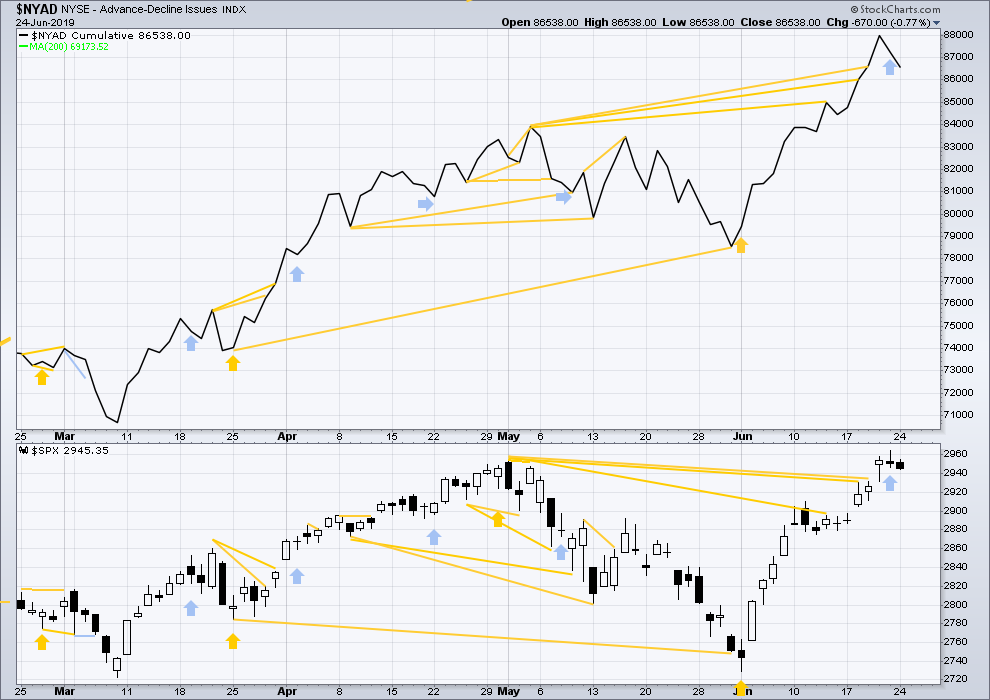
Click chart to enlarge. Chart courtesy of StockCharts.com. So that colour blind members are included, bearish signals
will be noted with blue and bullish signals with yellow.
Breadth should be read as a leading indicator.
Short-term bearish divergence noted on Friday has now been followed by a downwards day. It may be resolved here, or it may yet need another downwards session to resolve it.
Today both price and the AD line have moved lower. There is no new divergence.
VOLATILITY – INVERTED VIX CHART
WEEKLY CHART
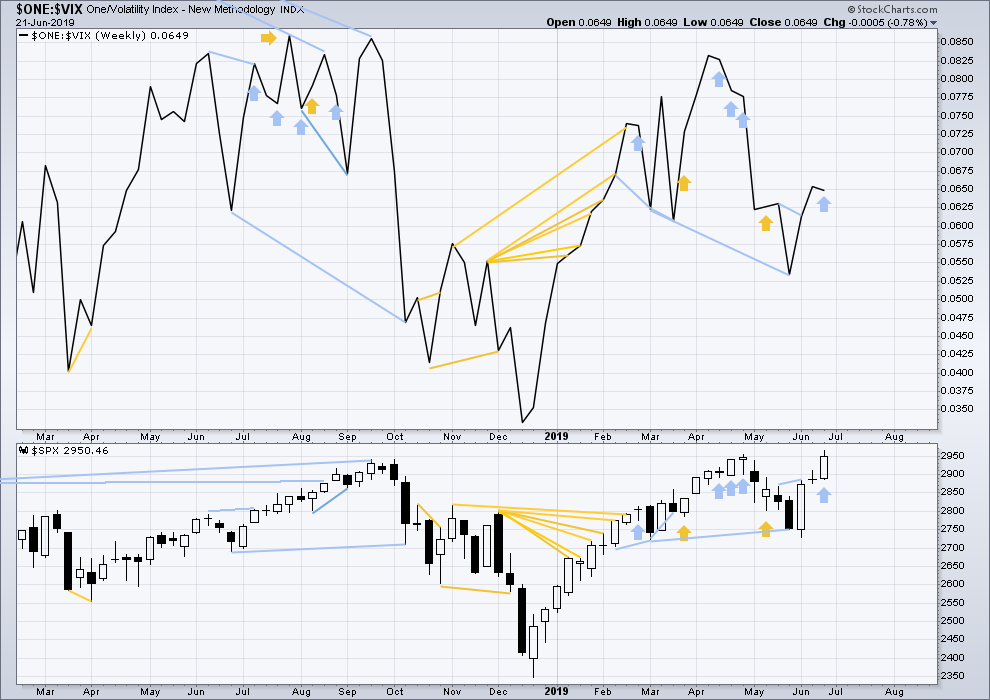
Click chart to enlarge. Chart courtesy of StockCharts.com. So that colour blind members are included, bearish signals
will be noted with blue and bullish signals with yellow.
Long-term bearish divergence remains. It may develop further before the upwards trend ends.
This week price moved higher, but inverted VIX has moved slightly lower. This is a single week of bearish divergence. The divergence may yet develop further before it is followed by reasonable downwards movement.
DAILY CHART
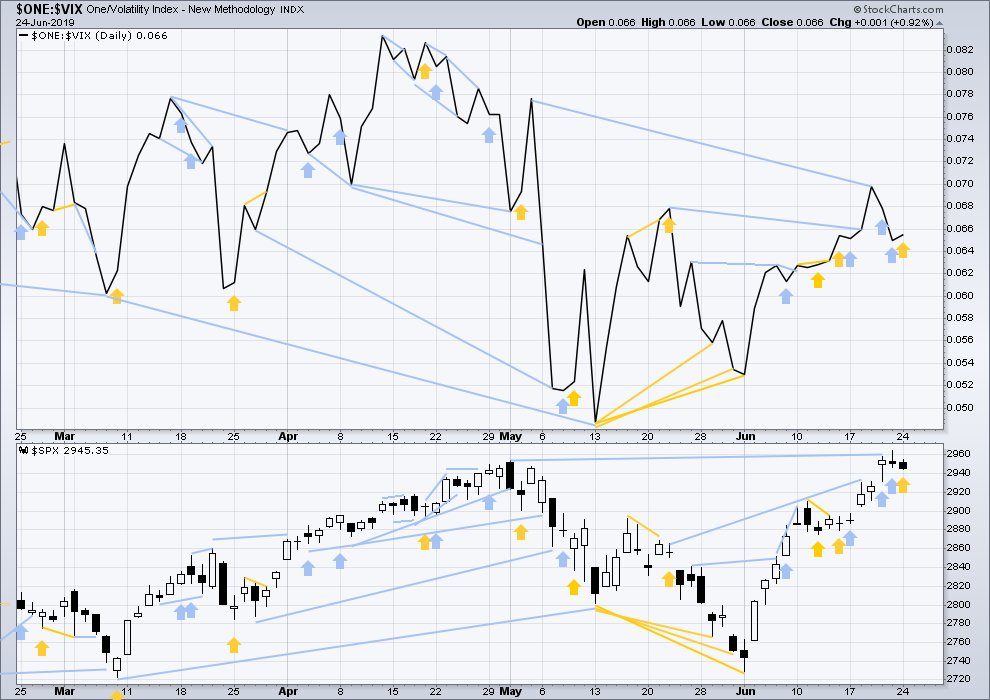
Click chart to enlarge. Chart courtesy of StockCharts.com. So that colour blind members are included, bearish signals
will be noted with blue and bullish signals with yellow.
Bearish divergence noted at the end of last week has now been followed by a downwards session. It may now be resolved here, or it may yet be followed by another downwards session before it may be resolved.
Today price has moved lower, but inverted VIX has moved slightly higher. This divergence is bullish for the short term.
DOW THEORY
Dow Theory confirmed a bear market in December 2018. This does not necessarily mean a bear market at Grand Super Cycle degree though; Dow Theory makes no comment on Elliott wave counts. On the 25th of August 2015 Dow Theory also confirmed a bear market. The Elliott wave count sees that as part of cycle wave II. After Dow Theory confirmation of a bear market in August 2015, price went on to make new all time highs and the bull market continued.
DJIA: 23,344.52 – a close on the 19th of December at 23,284.97 confirms a bear market.
DJT: 9,806.79 – price has closed below this point on the 13th of December.
S&P500: 2,532.69 – a close on the 19th of December at 2,506.96 provides support to a bear market conclusion.
Nasdaq: 6,630.67 – a close on the 19th of December at 6,618.86 provides support to a bear market conclusion.
With all the indices having moved higher following a Dow Theory bear market confirmation, Dow Theory would confirm a bull market if the following highs are made:
DJIA: 26,951.81
DJT: 11,623.58
S&P500: 2,940.91 – a new all time high has been made on the 29th of April 2019.
Nasdaq: 8,133.30 – a new high has been made on 24th of April 2019.
Published @ 07:02 p.m. EST.
—
Careful risk management protects your trading account(s).
Follow my two Golden Rules:
1. Always trade with stops.
2. Risk only 1-5% of equity on any one trade.
—
New updates to this analysis are in bold.
How low will it go?? I’m hungry for a sweet wave 3 of (3)!
Hourly chart updated:
the structure of minute c may now be complete
let’s see if there is any weakness in this downwards movement today. if it shows a further decline in volume that may indicate it may end here or soon.
although increasing volume is not necessary for price to continue lower, it does seem to be a feature of deeper pullbacks for this market. when volume is light and declining on downward movement it tends to be more short lived and shallow.
We made it down to Lara’s SPX Minor 2 target zone…
Next move a 3 of (3)? Might be exciting.
could get linked to “good news” PR coming out of the G20. The count must be fulfilled by Good News!
Again I’m always amazed how news events coincide with EW wave initiations or invalidations. I’m thinking of wiz of oz. And elliot himself back there watching and pulling levers behind the curtain lol
I’m looking for 3 events, each of which will build my confidence the 2 is over. The break of the black trend line, the move above the lower swing high (lower blue dashed line), then the move above the higher swing high (higher blue dashed line). When it does all three…odds are high price has entered minor 3 of intermediate 3.
Excellent! Thanks
I projected two “likely” tops for this run up in GLD using fibo fitting projections. One was 135, the over just over 140. The 135 is tagged now. I’m going to be fascinated to see how commonly these projections work…
Last week bought GLD Sep 149 and Jan 168 ……
And just closed my SPY puts today….
you are on fire Peter!
oops, how’d that get posted…old news now!
Some of you may find this most recent article on SPX and this site helpful–
http://www.gunner24.com/newsletter/nl-062319/
Altman is a ‘Gann Man’
Good Day…Melanie
Thanks, good information.
I’m seeing this correction as a WXY, with the W and X complete. This based on /ES hourly bars including overnight data.
Good morning to all. I would like to ask two questions. Lara presented two invalidation points in her analysis: one at the intermediate level and the other appears to be at the minor level. Which would have precedence? Secondly, if the count were to be invalidated at the intermediate level, would the assumption be that primary two was incomplete?
I think the lower invalidation point is “the one of interest” here. If the lower tf wave count is still valid, then the higher one must be as well is my thinking. But it’s an interesting question.
I would think a smaller time frame invalidation would in general yield to a larger time frame in regards to precedence- but in some situations an Invalidation of a smaller time frame may also invalidate a larger time frame wave count. If intermediate wave 2 were invalidated it may suggest an expanded flat, running flat or expanding triangle- however there may be more technical requirements or rules I’m not fully educated on yet.
That’s a good point Ron, and I had realised it could be confusing.
It’s a matter of timing. Right now, minor 2 can move right down to the start of minor 1 at 2,886.98 and the wave count at all time frames would remain valid.
When minor 2 is complete and minor 3 moves above the end of minor 1 then the higher invalidation point on the daily chart comes into play. At that point we’ll be looking for intermediate (3) to near and end, and the invalidation point will be for intermediate (4).
To remove this confusion I need to make them the same, and it has to be 2,886.98 to make sense. That’s the point which is effective now.
Fibonacci fitted retrace levels pointing to three targets for a pivot high of the June up move. This in /ES with overnight data. These are 4 hour bars.
Results: projection #1 is hit, as a result of the 100% retrace back up.
Projection #2 is to 3017.
Projection #3 is to 3095.
Projection #3 is close to Lara’s wave 3 target of 3104.
My view is these becomes quite interesting if/when price approaches (without substantial correction first) and a pivot develops at one of these levels. That could be happening “right now”, since target #1 is hit.
Bottom line: I think these the odds are high one of these three price levels will be a significant pivot high here. “The fractal structure suggests so…”
Here’s a closer up view of the action, with “all” the levels properly filled in, including the 161% extension of the move up. To sell the full set of fibonacci levels at each level, look at the far left side (not all the level extend all the way to the right). These are pretty strong zones of potential for turning the market.
The potential turning point would be start of P4? I wonder if Lara has any counts that would fit P4 starting here? Doesn’t feel like it yet. This weekend could be a big catalyst though with G20 meeting and high potential for trade negotiation headlines. Kevin are you still heavy bullish or hedging a bit of that risk here?
Thanks!
My bullish positions are locked into a system with simple rules, 15% stop loss and 3-4% profit targets. No losses yet on this round…but I suspect some may come. Bailing early is not allowed by the plan. So I am still very long. Note though that my positions where were over about 1.2% of profit, I have break even stops on now. In fact my FB position just now exited with $1 profit (lol!!). I have a smallish hedge on via an SPX butterfly centered at SPX 2910 for Monday. If that hits, it will cover me for a couple of full 15% stop losses.
This “fibonacci fitting” methodology I’m trying to project the ultimate ending pivot of price swings is independent of Elliott wave counts. Effectively the targeting here maps to where minor 1 would finish. I projected 3 likely levels, one of which was already hit…and now that’s played out as the correct one. Of course I did that a tad after the fact, but I’m confident had I done this project a week ago I’d have come up with this same target as one of the three. Minor 2 is obviously very much now in progress.
Great feedback, thank you!
I’m selling Aug 02 305 SPY Straddles here. Conservatively based on Lara’s price and time targets. And I’ll slowly work into some uvxy put spreads heading into this weekend.
Best of luck.
Just review my June to date results. 53 profit exits each at an average of about 3.1%. One full size loss at 15%. About 5 additional partial loss exits of averaging about 5% each (I violated system rules and bailed once when it appeared the market might be turning strongly against me). Roughly 8 or so scratch trades. Not bad. Quite good, actually.
Obviously, my general algorithm breaks even at a rate of 5 winners (15% total profits) to one loser (-15 loss). So long runs of winners is expected and required.
If the market goes into significant bear mode, I take a beating. Obviously, my deployment of this system is predicated on Lara’s very generally bullish count.
The stocks I’m using for this are all in the +3% volatility range, price above $15, and volume above 200k daily average. Current holdings are ALGN, ALTR, ATHM, AXSM, BAND, BOOM, CDLX, COWN, CYBR, FANH, FND, FRPT, GWPH, IBP, MA, MRCY, NEO, OLLI, PLNT, STNG, TAL, TCDA, VSAT. Part of the game is broadly diversifying to reduce variance and increase probably of tracking to a fast paced overall 3% growth curve (with compounding). People don’t realize how important trade rate is to growing an account exponentially and quickly. This is one of the key features of this “win small and win fast” system.
I like that one of the targets 3,097 is close to my 3,104 target.
The problem with target 2 at 3,017 is if P3 ends there, it doesn’t allow much room for P4 to unfold and remain above P1 price territory . P1 price territory ends at 2,954.13. That’s just 62.87 points.
#2 runner-up
#1