Upwards movement has continued for the session as expected. The Elliott wave counts remain the same.
Summary: The low of December 2018 is expected to most likely remain intact. New all time highs are expected soon.
The next short-term target is at 3,068 (Elliott wave) to 3,079 (classic analysis from the pennant). This next upwards wave may exhibit some strength. Look for corrections to continue to be very shallow and brief.
The mid-term target remains at 3,104 for a more time consuming consolidation or pullback, which may also be shallow.
The biggest picture, Grand Super Cycle analysis, is here.
Monthly charts were last published here, with video here. There are two further alternate monthly charts here, with video here.
ELLIOTT WAVE COUNTS
The two Elliott wave counts below will be labelled First and Second. They may be about of even probability. When the fifth wave currently unfolding on weekly charts may be complete, then these two wave counts will diverge on the severity of the expected following bear market. To see an illustration of this future divergence monthly charts should be viewed.
FIRST WAVE COUNT
WEEKLY CHART
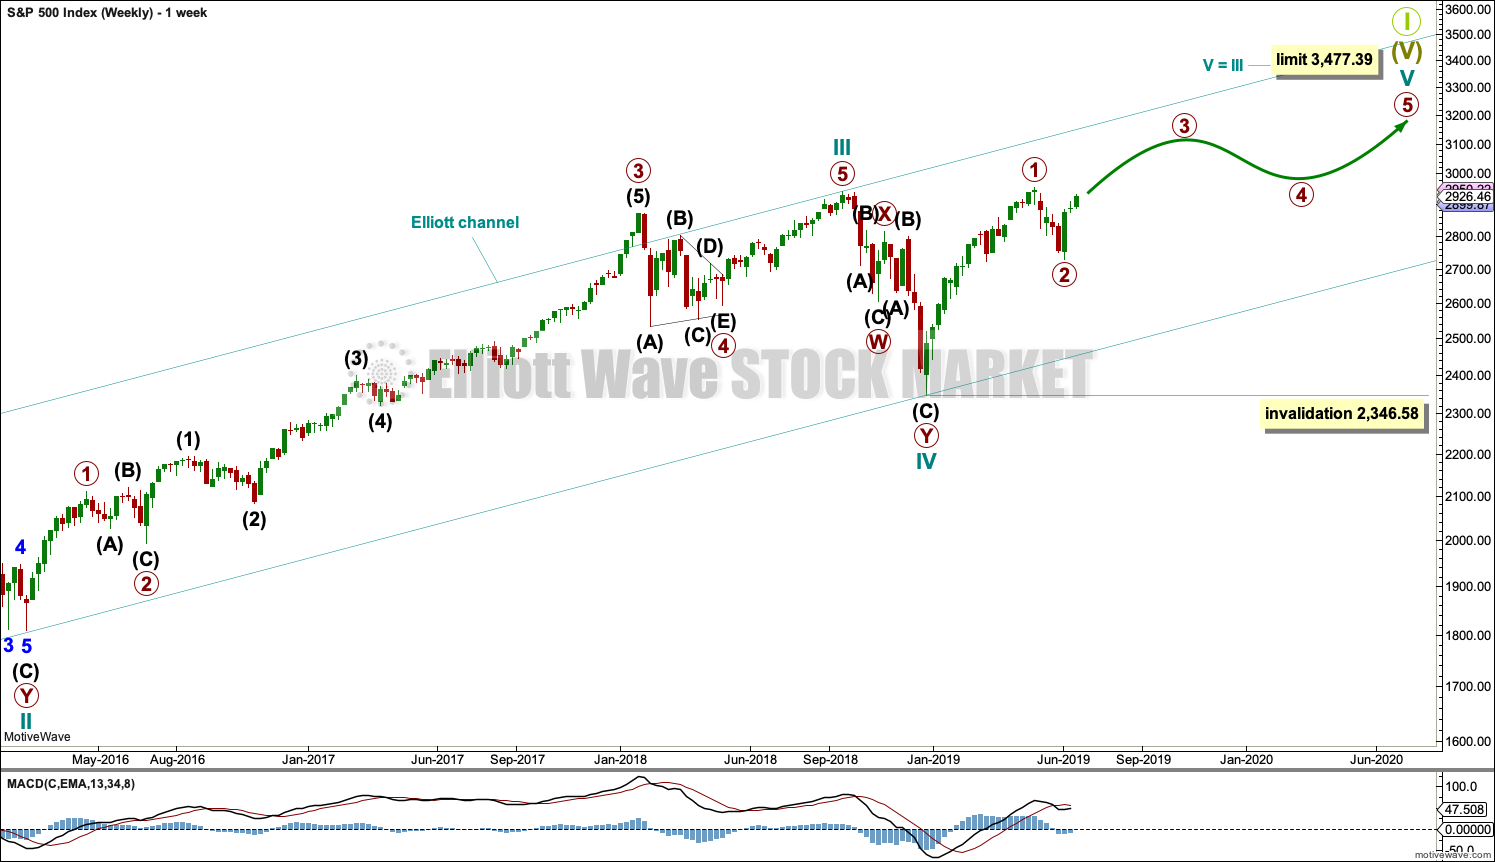
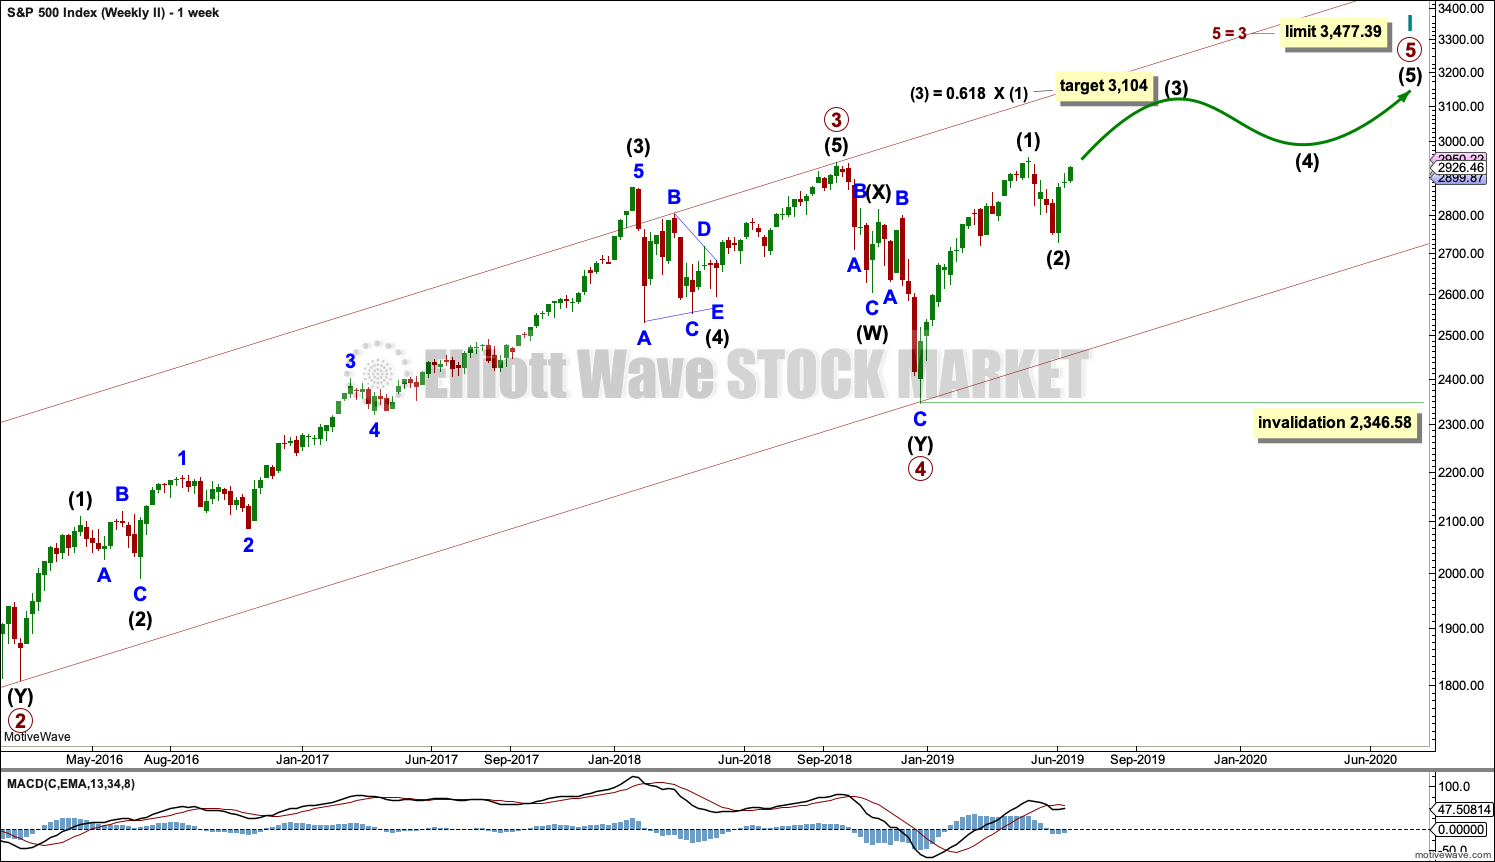
The basic Elliott wave structure consists of a five wave structure up followed by a three wave structure down (for a bull market). This wave count sees the bull market beginning in March 2009 as an incomplete five wave impulse and now within the last fifth wave, which is labelled cycle wave V. This impulse is best viewed on monthly charts. The weekly chart focusses on the end of it.
Elliott wave is fractal. This fifth wave labelled cycle wave V may end a larger fifth wave labelled Super Cycle wave (V), which may end a larger first wave labelled Grand Super Cycle wave I.
The teal Elliott channel is drawn using Elliott’s first technique about the impulse of Super Cycle wave (V). Draw the first trend line from the end of cycle wave I (off to the left of the chart, the weekly candlestick beginning 30th November 2014) to the end of cycle wave III, then place a parallel copy on the end of cycle wave II. This channel perfectly shows where cycle wave IV ended at support. The strongest portion of cycle wave III, the end of primary wave 3, overshoots the upper edge of the channel. This is a typical look for a third wave and suggests the channel is drawn correctly and the way the impulse is counted is correct.
Within Super Cycle wave (V), cycle wave III is shorter than cycle wave I. A core Elliott wave rule states that a third wave may never be the shortest. For this rule to be met in this instance, cycle wave V may not be longer in length than cycle wave III. This limit is at 3,477.39.
The structure of cycle wave V is focussed on at the daily chart level below.
Within cycle wave V, primary wave 2 may not move beyond the start of primary wave 1 below 2,346.58.
In historic analysis, two further monthly charts have been published that do not have a limit to upwards movement and are more bullish than this wave count. Members are encouraged to consider those possibilities (links below summary) alongside the wave counts presented on a daily and weekly basis.
DAILY CHART
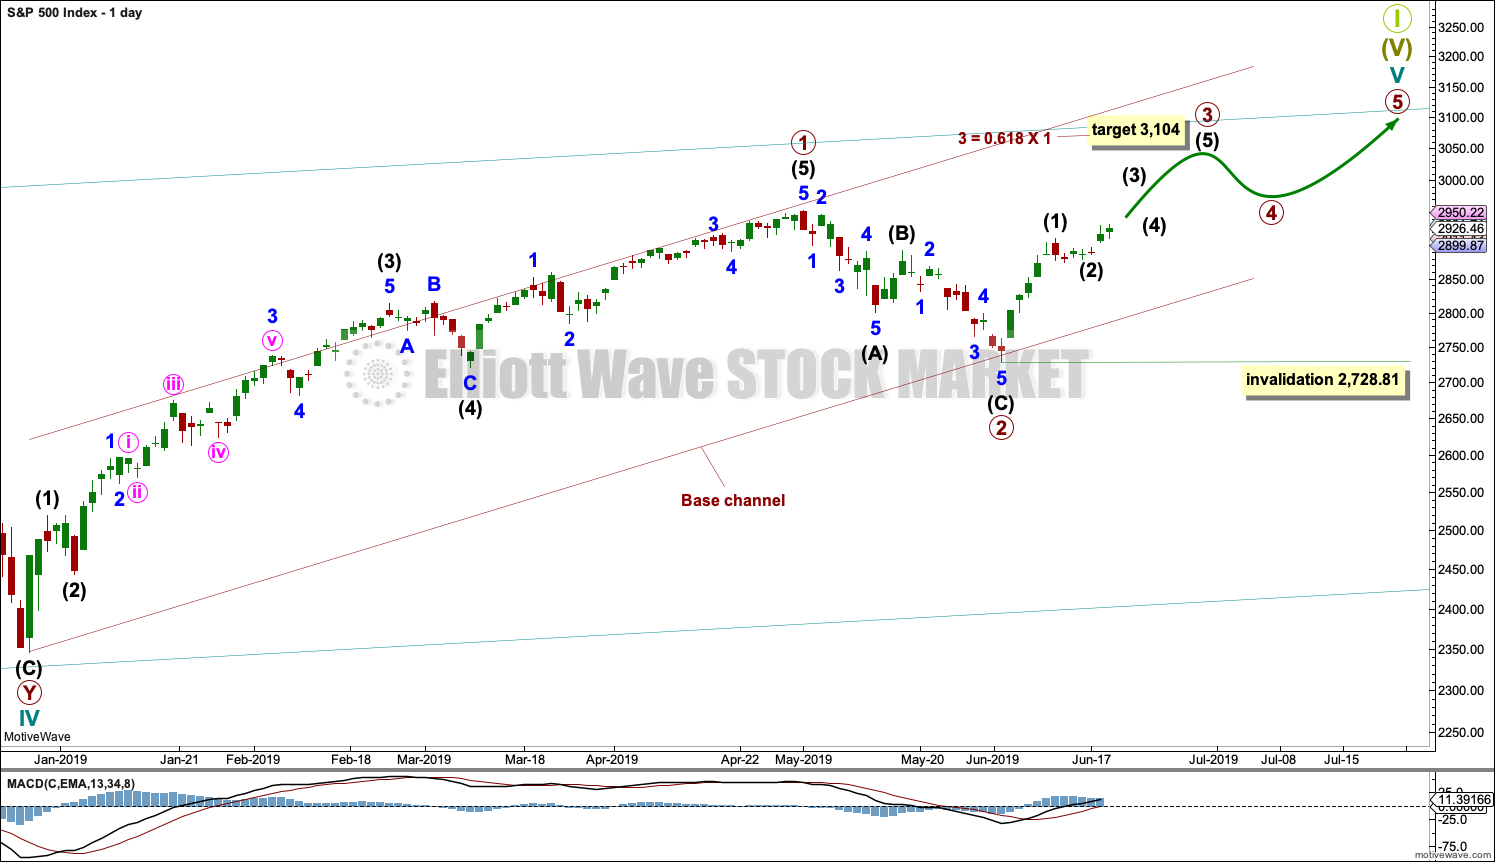
Cycle wave V must subdivide as a five wave motive structure. Within that five wave structure, primary waves 1 and 2 may be complete.
Primary wave 3 must move above the end of primary wave 1. Primary wave 3 may only subdivide as an impulse. Within the impulse, intermediate wave (2) may not move beyond the start intermediate wave (1) below 2,728.81. The invalidation point will be left here until primary wave 3 has moved above the end of primary wave 1, meeting a core Elliott wave rule.
When primary wave 3 is over, then primary wave 4 may be a shallow sideways consolidation that may not move into primary wave 1 price territory below 2,954.13.
Thereafter, primary wave 5 should move above the end of primary wave 3 to avoid a truncation.
A base channel is drawn about primary waves 1 and 2. The lower edge is drawn from the start of primary wave 1 to the end of primary wave 2, then a parallel copy is placed upon the high of primary wave 1. Along the way up, corrections within primary wave 3 may find support about the lower edge of the base channel. Primary wave 3 may have the power to break above the upper edge of the channel.
Primary wave 1 lasted 86 sessions, 3 short of a Fibonacci 89. Primary wave 2 lasted 22 sessions, 1 longer than a Fibonacci 21. Primary wave 3 may end about a Fibonacci 55 sessions, give or take two or three sessions either side. This is a rough guideline only.
So far primary wave 3 has lasted 12 sessions.
HOURLY CHART
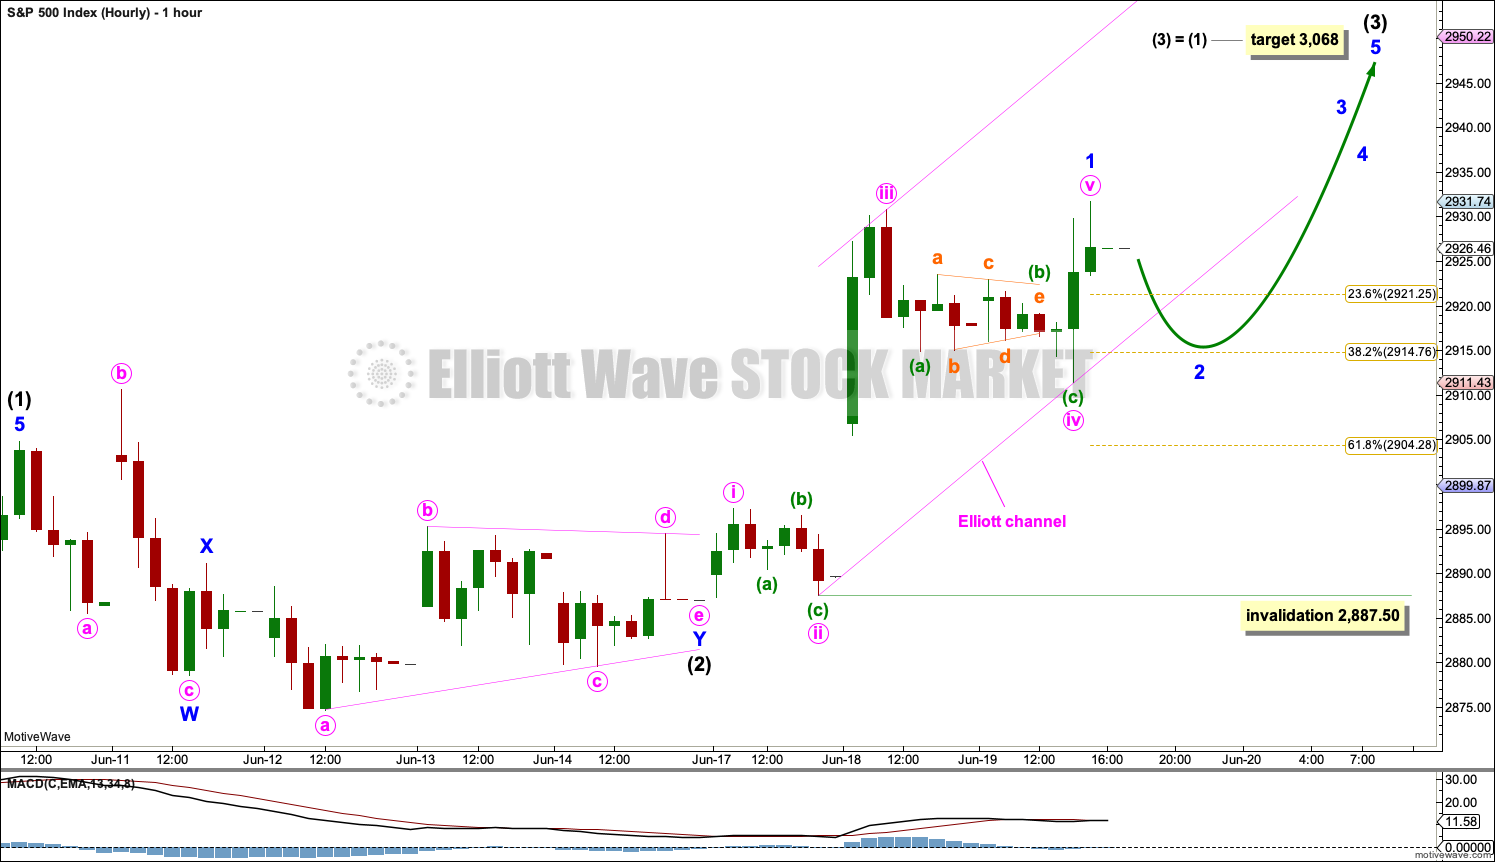
Intermediate wave (2) may now be a complete double combination: expanded flat – X – running barrier triangle.
A target is calculated for intermediate wave (3) to end.
Intermediate wave (3) may only subdivide as an impulse. Within intermediate wave (3), minor wave 1 may now be complete.
Fibonacci Ratios within minor wave 1 are: minute wave iii is just 0.30 short of 4.236 the length of minute wave i, and minute wave v has no Fibonacci ratio to either of minute waves i or iii.
A channel is drawn about minor wave 1 using Elliott’s second technique: the first trend line is drawn from the ends of minute waves ii to iv, then a parallel copy is placed upon the end of minute wave iii. When this channel is breached by downwards movement, then it shall indicate that minor wave 1 should be over and minor wave 2 should then be underway.
The strong upwards pull now of a third wave at three degrees may force minor wave 2 to be relatively brief and shallow.
Minor wave 2 may not move beyond the start of minor wave 1 below 2,887.50.
When minor wave 2 is complete, then there would be a series of three overlapping first and second waves complete at primary, intermediate and minor degree. The next wave up for minor wave 3 within intermediate wave (3) within primary wave 3 may be expected to exhibit an increase in strength.
If this chart is wrong, it may be in anticipating minor wave 2 to begin tomorrow when it may yet be another day to few days away. Look out now for any surprises to be to the upside.
SECOND WAVE COUNT
WEEKLY CHART
This weekly chart is almost identical to the first weekly chart, with the sole exception being the degree of labelling.
This weekly chart moves the degree of labelling for the impulse beginning in March 2009 all down one degree. This difference is best viewed on monthly charts.
The impulse is still viewed as nearing an end; a fifth wave is still seen as needing to complete higher. This wave count labels it primary wave 5.
TECHNICAL ANALYSIS
WEEKLY CHART
Click chart to enlarge. Chart courtesy of et=”_blank”>StockCharts.com.
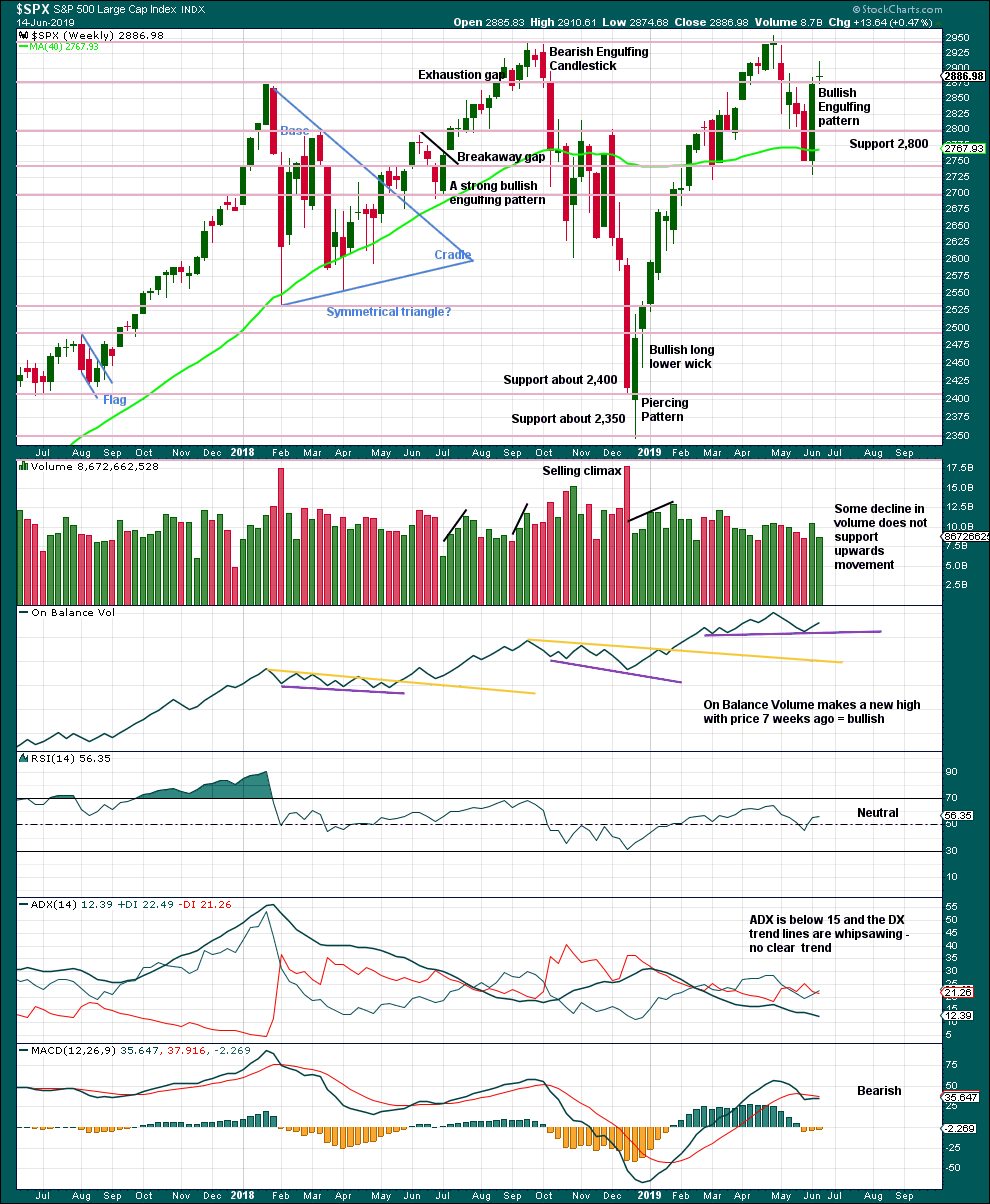
Weight will be given in this analysis to the strong bullish reversal pattern, which has support from volume. This supports the main Elliott wave counts.
The Doji candlestick last week represents indecision, a balance of bulls and bears. A Doji on its own is not a reversal signal; they can appear within trends as a small pause.
A new support line is drawn on On Balance Volume.
DAILY CHART
Click chart to enlarge. Chart courtesy of StockCharts.com.
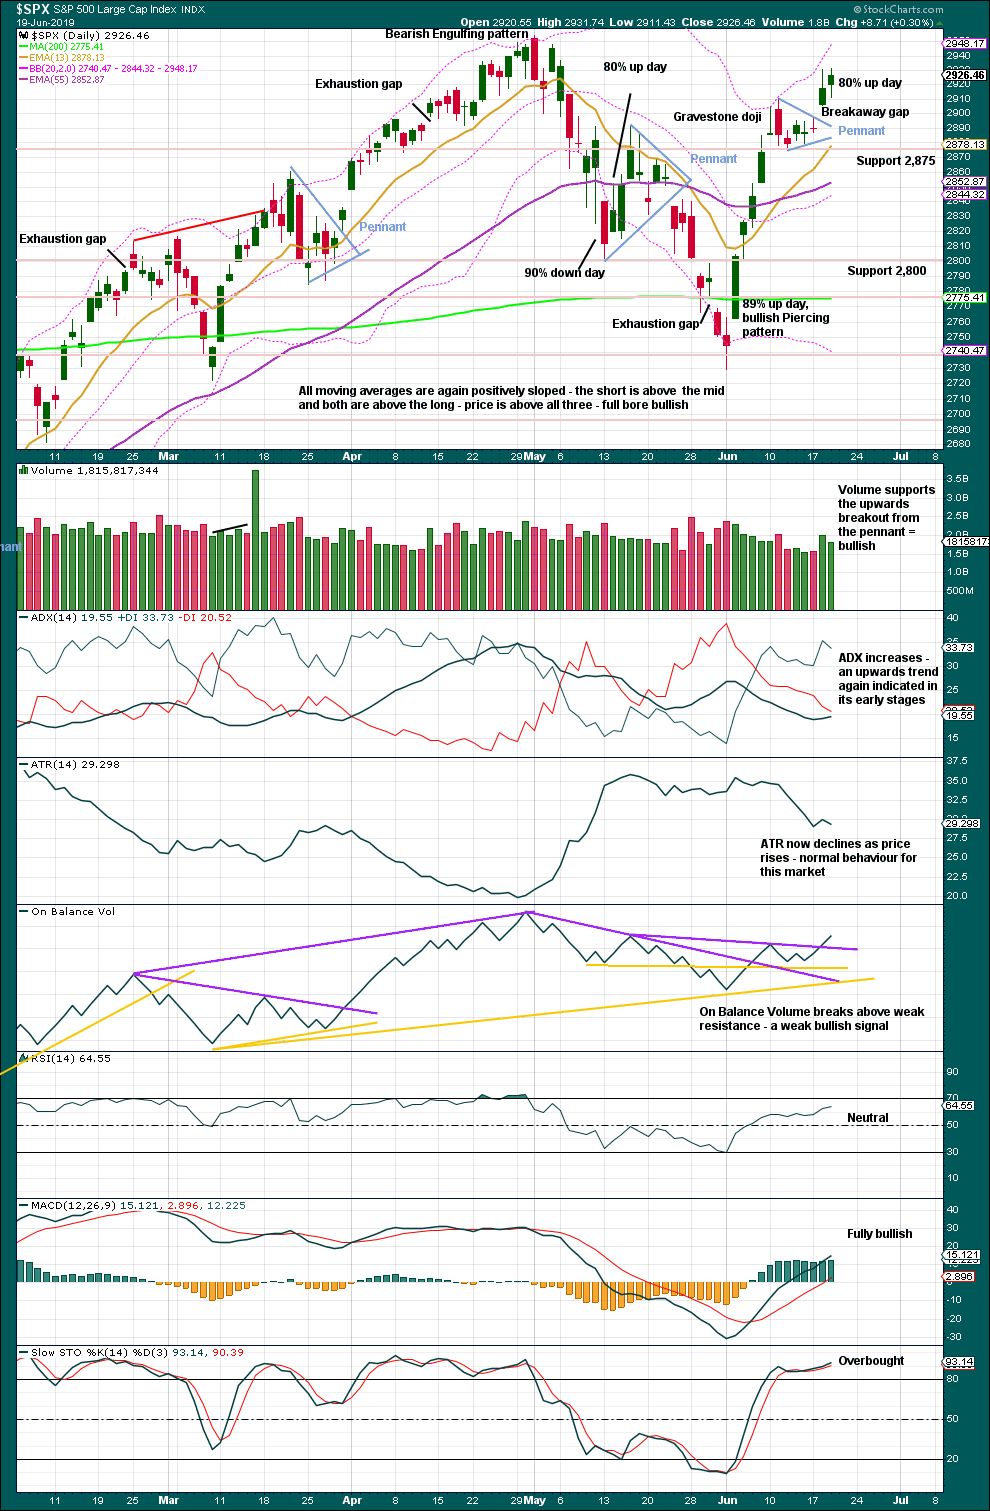
A target from the flag pole is recalculated about 3,079. This is 11 points above the short-term Elliott wave target at 3,068.
The breakaway gap may offer support at 2,897.27.
There is an upwards trend still intact and it is far from extreme. Stochastics may remain extreme for long periods of time when this market trends. RSI has further room to rise before it reaches overbought. ADX indicates the trend has reasonable room to run before it reaches extreme. This chart is fully bullish. Expect new all time highs shortly.
BREADTH – AD LINE
WEEKLY CHART
Click chart to enlarge. Chart courtesy of StockCharts.com. So that colour blind members are included, bearish signals
will be noted with blue and bullish signals with yellow.
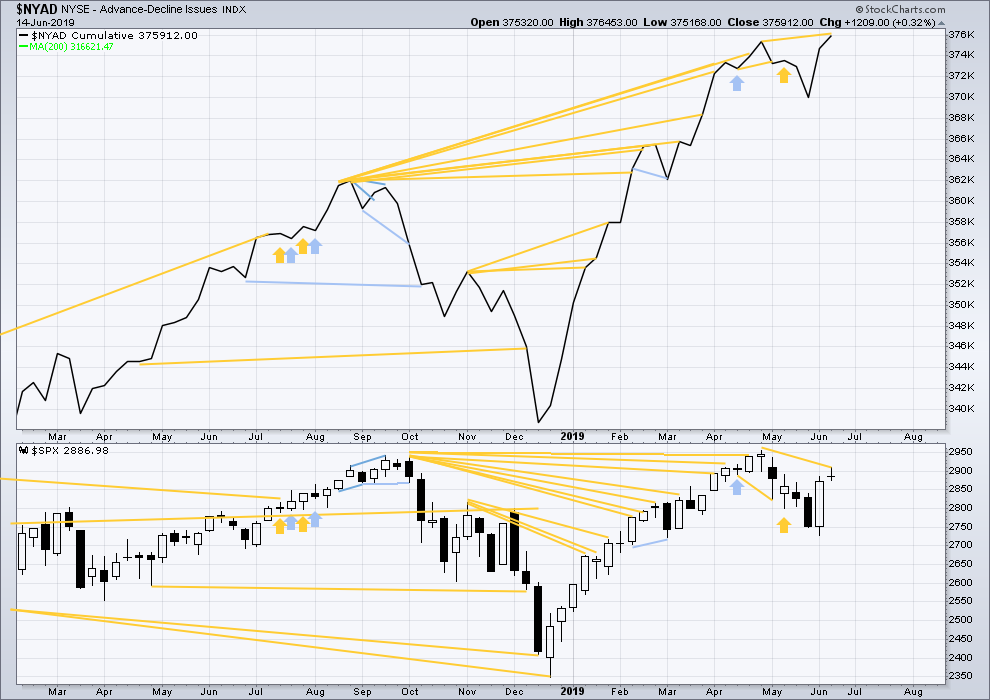
Bear markets from the Great Depression and onwards have been preceded by an average minimum of 4 months divergence between price and the AD line with only two exceptions in 1946 and 1976. With the AD line making another new all time high today, the end of this bull market and the start of a new bear market is very likely a minimum of 4 months away, which is mid October 2019.
In all bear markets in the last 90 years there is some positive correlation (0.6022) between the length of bearish divergence and the depth of the following bear market. No to little divergence is correlated with more shallow bear markets. Longer divergence is correlated with deeper bear markets.
If a bear market does develop here, it comes after no bearish divergence. It would therefore more likely be shallow.
DAILY CHART
Click chart to enlarge. Chart courtesy of StockCharts.com. So that colour blind members are included, bearish signals
will be noted with blue and bullish signals with yellow.
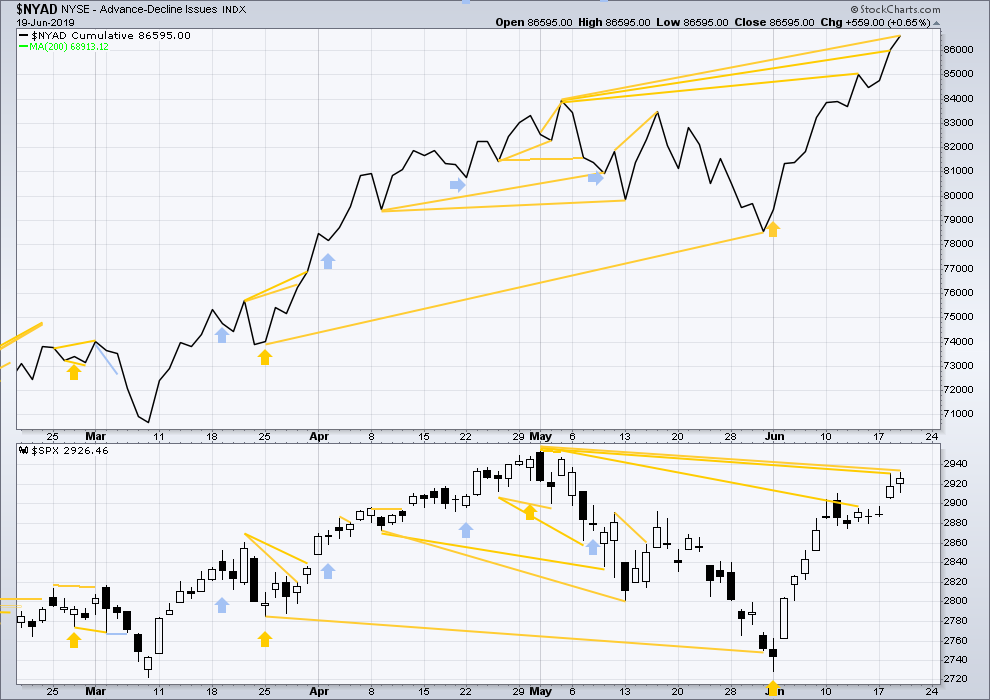
Breadth should be read as a leading indicator.
Today the AD line makes another new all time high. Price is very likely to follow. This divergence is bullish.
VOLATILITY – INVERTED VIX CHART
WEEKLY CHART
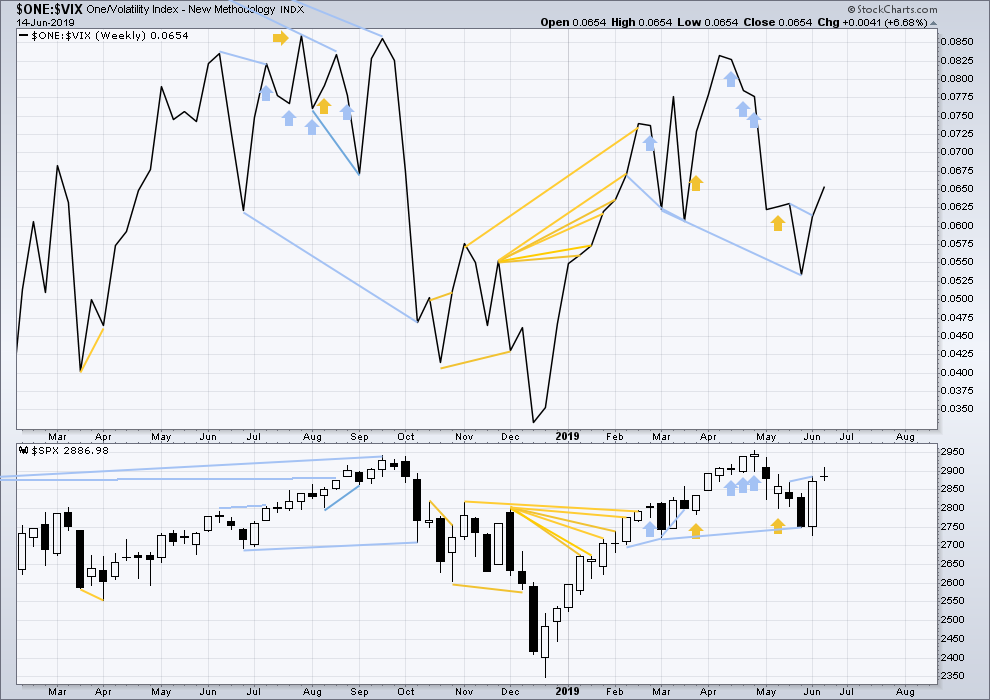
Click chart to enlarge. Chart courtesy of StockCharts.com. So that colour blind members are included, bearish signals
will be noted with blue and bullish signals with yellow.
Bearish divergence noted two weeks ago has not been followed by any downwards movement.
Last week both price and inverted VIX have moved higher. There is no new short-term divergence.
Long-term bearish divergence remains.
DAILY CHART
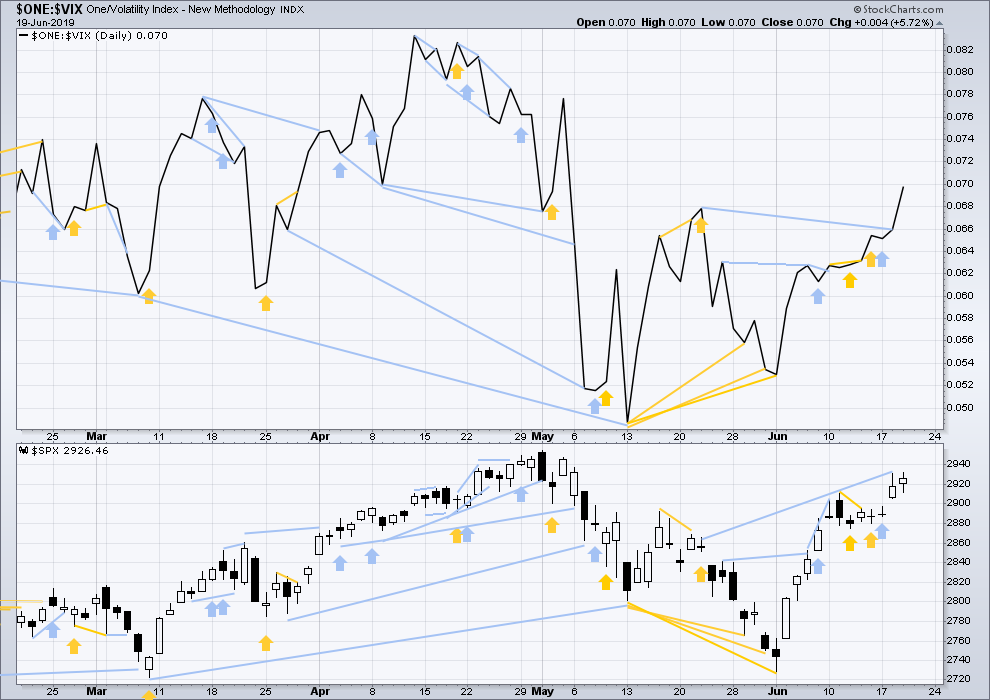
Click chart to enlarge. Chart courtesy of StockCharts.com. So that colour blind members are included, bearish signals
will be noted with blue and bullish signals with yellow.
Short-term bearish divergence noted yesterday between price and inverted VIX has not been followed by any downwards movement today, and today it has disappeared. It is considered to have failed.
Longer-term bearish divergence remains and may still be an early warning of a deeper pullback to come.
DOW THEORY
Dow Theory confirmed a bear market in December 2018. This does not necessarily mean a bear market at Grand Super Cycle degree though; Dow Theory makes no comment on Elliott wave counts. On the 25th of August 2015 Dow Theory also confirmed a bear market. The Elliott wave count sees that as part of cycle wave II. After Dow Theory confirmation of a bear market in August 2015, price went on to make new all time highs and the bull market continued.
DJIA: 23,344.52 – a close on the 19th of December at 23,284.97 confirms a bear market.
DJT: 9,806.79 – price has closed below this point on the 13th of December.
S&P500: 2,532.69 – a close on the 19th of December at 2,506.96 provides support to a bear market conclusion.
Nasdaq: 6,630.67 – a close on the 19th of December at 6,618.86 provides support to a bear market conclusion.
With all the indices having moved higher following a Dow Theory bear market confirmation, Dow Theory would confirm a bull market if the following highs are made:
DJIA: 26,951.81
DJT: 11,623.58
S&P500: 2,940.91 – a new all time high has been made on the 29th of April 2019.
Nasdaq: 8,133.30 – a new high has been made on 24th of April 2019.
Published @ 06:26 p.m. EST.
—
Careful risk management protects your trading account(s).
Follow my two Golden Rules:
1. Always trade with stops.
2. Risk only 1-5% of equity on any one trade.
—
New updates to this analysis are in bold.

Hourly chart updated:
Three first and second waves may now be complete; minor, intermediate and primary.
This count now expects very strong upwards movement ahead.
As warned, minor 2 may have been relatively brief and shallow. It may have ended at todays low close to the 0.382 Fibonacci ratio of minor 1, after the session began with minor 1 jumping up higher.
Gold looks to be on Lara alt now…. target real high too!
Whoa, talk about blowing out of the top side of a triangle! Truncated E wave, which isn’t unusual. Wow. That said, I’m done with trying to trade gold. Just too much random noise in gold for me, I find it horribly difficult.
Market up, gold up, bonds up, oil…up again? What’s it’s all mean, I haven’t a clue. But quite a bit different than last fall, when every asset class was falling!
I have 3 wave counts now for Gold; one bullish which sees Gold in the early stages of a multi decade bull market, and two which see cycle b continuing, to be followed by cycle c down to new lows.
I’ve updated the Gold analysis already.
Mid term, all three counts are now bullish.
now that’s music to my ears !
Well my spy calls beat my oil shorts, so profitable night ….. good job Kevin and Rod!
If the market follows the high probability path Lara has mapped out…the fun is just getting started.
If ever there was a time to be aggressive on the long side in the market based on Elliott wave information, NOW IS IT. In my opinion. The early stage of a primary 3 up doesn’t come around every day. Your mileage may vary, trade at your own risk, and always use stops, of course.
Speaking of which, here are two of my plays, butterflies in SPX using SPX calls, exactly as positioned here (gray boxes). Super cheap, very high payoff if they hit. Admittedly long shots, but given our wave count and the nominal trajectories of price and the structure of the fibo extensions, I like ’em.
shorted the open, done… long again
Classic overnight move by the pro’s to shut out the retail crowd from participating. A nice time to be “all in” already!
Yes-sirree. Now or very soon we will see the Fear Of Missing Out crowd coming in driving the SPX much higher. Remember the article from Market Watch highlighting all that cash on the sidelines? This is what a 3rd of a 3rd looks like in higher degrees. I am guessing Lara may move all labels down one degree either this week or next.
Bring it on Rodney!!!
Eight profit exits out of 23 positions this morning, at an average of just over 3% profit each. Ka-ching ka-ching. Shoving back in at a pretty furious pace. Cycle time (faster -> better!!) and compounding (assuming +EV per trade) are the keys to the kingdom.
Let the bull roar!!! Boy I love a rock solid EW count. THANK YOU LARA and fantastic work.
Thank you Lara, great job over the past month and also Kevin for your insight on interpreting her EW counts and potential inflection points. Your analysis has really helped me assign probabilities the wave counts and I’ve been able to scale / hedge accordingly, which has been the key.
You’re welcome. I’m glad at least one market is behaving as I’d expected.
Now to just sort out Gold…
Sweet! No. 1!
A Texas song for Lara:
? I`m back in the saddle again
Out where a friend is a friend
Where the longhorn cattle feed
On the lowly gypsum weed
Back in the saddle again. ?
Speaking of Texas…… looks like a great like to short Oil
Not quite seeing that here myself Peter. Three solid hits on the 61.8% of the 2019 up move and now a big push up. I wouldn’t short here myself, far to uncertain and if you made me place a bet for the short term (a week or two), I’d definitely bet long here given the strength of this week’s weekly bar, and the fact that today’s daily bar is fully on top of the 21 ema. I’d guess /CL is going up to 59ish, my upper volatility band on the daily, and also where the 200 day ma is sitting as well (re-test). My $0.02. Though I’m wrong almost as often as I’m right.
LOL
We’re doing a brief road trip to visit friends in Corpus Christi, and as I read this we just passed through Kenedy with some big long horns there. So appropriate!