
A consolidation was expected to be shallow and continue this week.
A pennant pattern identified on the daily chart now has an upwards breakout. The gap may be useful for traders. A target is calculated using the flag pole.
Summary: The low of December 2018 is expected to most likely remain intact. New all time highs are expected soon.
The next short-term target is at 3,068 (Elliott wave) to 3,079 (classic analysis from the pennant). This next upwards wave may exhibit some strength. Look for corrections to continue to be very shallow and brief.
The mid-term target remains at 3,104 for a more time consuming consolidation or pullback, which may also be shallow.
The biggest picture, Grand Super Cycle analysis, is here.
Monthly charts were last published here, with video here. There are two further alternate monthly charts here, with video here.
ELLIOTT WAVE COUNTS
The two Elliott wave counts below will be labelled First and Second. They may be about of even probability. When the fifth wave currently unfolding on weekly charts may be complete, then these two wave counts will diverge on the severity of the expected following bear market. To see an illustration of this future divergence monthly charts should be viewed.
FIRST WAVE COUNT
WEEKLY CHART
Click chart to enlarge.
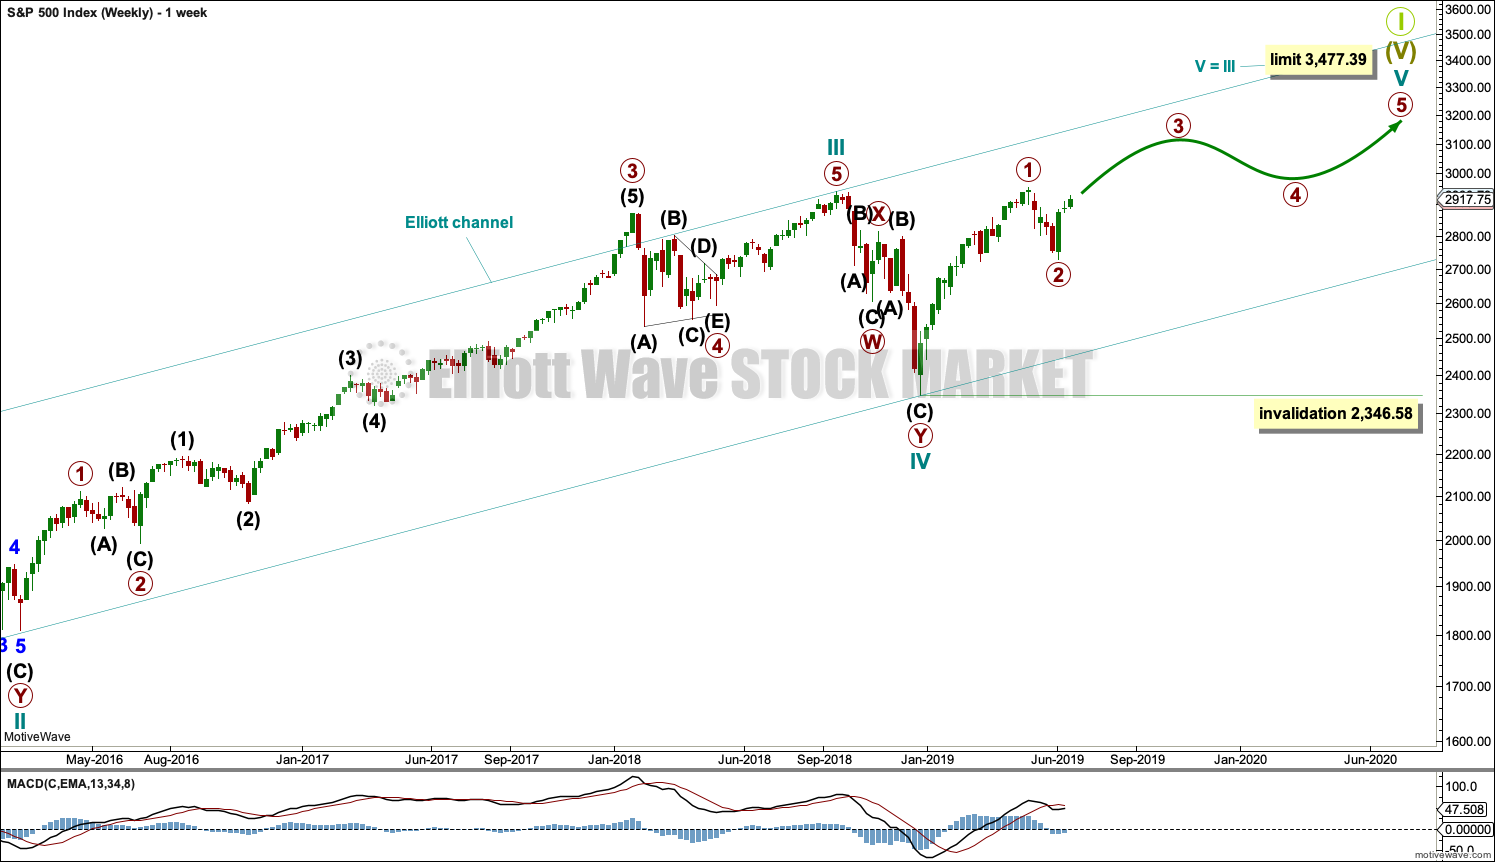
The basic Elliott wave structure consists of a five wave structure up followed by a three wave structure down (for a bull market). This wave count sees the bull market beginning in March 2009 as an incomplete five wave impulse and now within the last fifth wave, which is labelled cycle wave V. This impulse is best viewed on monthly charts. The weekly chart focusses on the end of it.
Elliott wave is fractal. This fifth wave labelled cycle wave V may end a larger fifth wave labelled Super Cycle wave (V), which may end a larger first wave labelled Grand Super Cycle wave I.
The teal Elliott channel is drawn using Elliott’s first technique about the impulse of Super Cycle wave (V). Draw the first trend line from the end of cycle wave I (off to the left of the chart, the weekly candlestick beginning 30th November 2014) to the end of cycle wave III, then place a parallel copy on the end of cycle wave II. This channel perfectly shows where cycle wave IV ended at support. The strongest portion of cycle wave III, the end of primary wave 3, overshoots the upper edge of the channel. This is a typical look for a third wave and suggests the channel is drawn correctly and the way the impulse is counted is correct.
Within Super Cycle wave (V), cycle wave III is shorter than cycle wave I. A core Elliott wave rule states that a third wave may never be the shortest. For this rule to be met in this instance, cycle wave V may not be longer in length than cycle wave III. This limit is at 3,477.39.
The structure of cycle wave V is focussed on at the daily chart level below.
Within cycle wave V, primary wave 2 may not move beyond the start of primary wave 1 below 2,346.58.
In historic analysis, two further monthly charts have been published that do not have a limit to upwards movement and are more bullish than this wave count. Members are encouraged to consider those possibilities (links below summary) alongside the wave counts presented on a daily and weekly basis.
DAILY CHART
Click chart to enlarge.
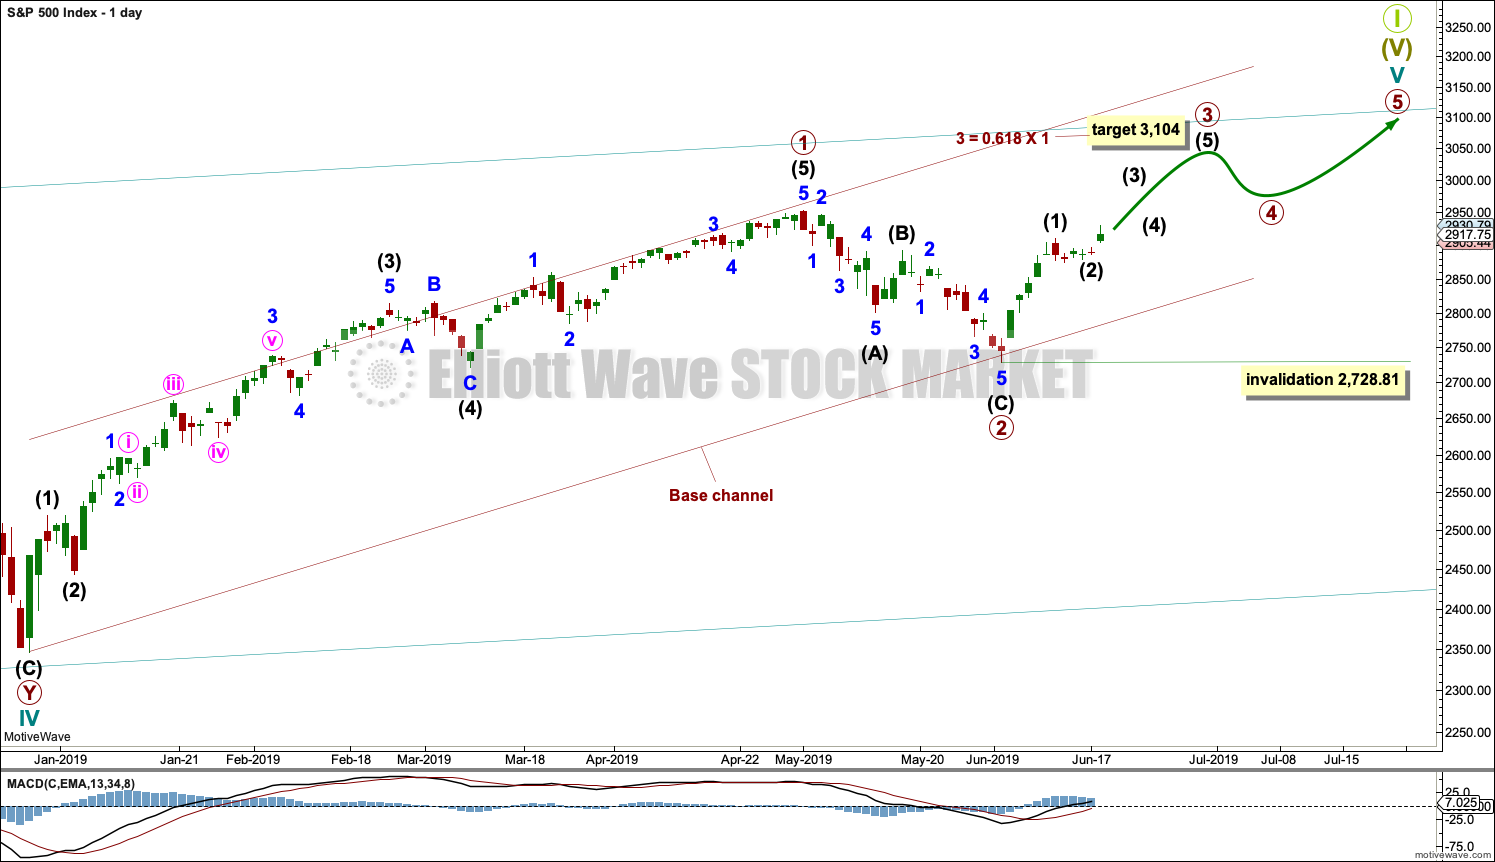
Cycle wave V must subdivide as a five wave motive structure. Within that five wave structure, primary waves 1 and 2 may be complete.
Primary wave 3 must move above the end of primary wave 1. Primary wave 3 may only subdivide as an impulse. Within the impulse, intermediate wave (2) may not move beyond the start intermediate wave (1) below 2,728.81. The invalidation point will be left here until primary wave 3 has moved above the end of primary wave 1, meeting a core Elliott wave rule.
When primary wave 3 is over, then primary wave 4 may be a shallow sideways consolidation that may not move into primary wave 1 price territory below 2,954.13.
Thereafter, primary wave 5 should move above the end of primary wave 3 to avoid a truncation.
A base channel is drawn about primary waves 1 and 2. The lower edge is drawn from the start of primary wave 1 to the end of primary wave 2, then a parallel copy is placed upon the high of primary wave 1. Along the way up, corrections within primary wave 3 may find support about the lower edge of the base channel. Primary wave 3 may have the power to break above the upper edge of the channel.
Primary wave 1 lasted 86 sessions, 3 short of a Fibonacci 89. Primary wave 2 lasted 22 sessions, 1 longer than a Fibonacci 21. Primary wave 3 may end about a Fibonacci 55 sessions, give or take two or three sessions either side. This is a rough guideline only.
So far primary wave 3 has lasted 11 sessions.
HOURLY CHART
Click chart to enlarge.
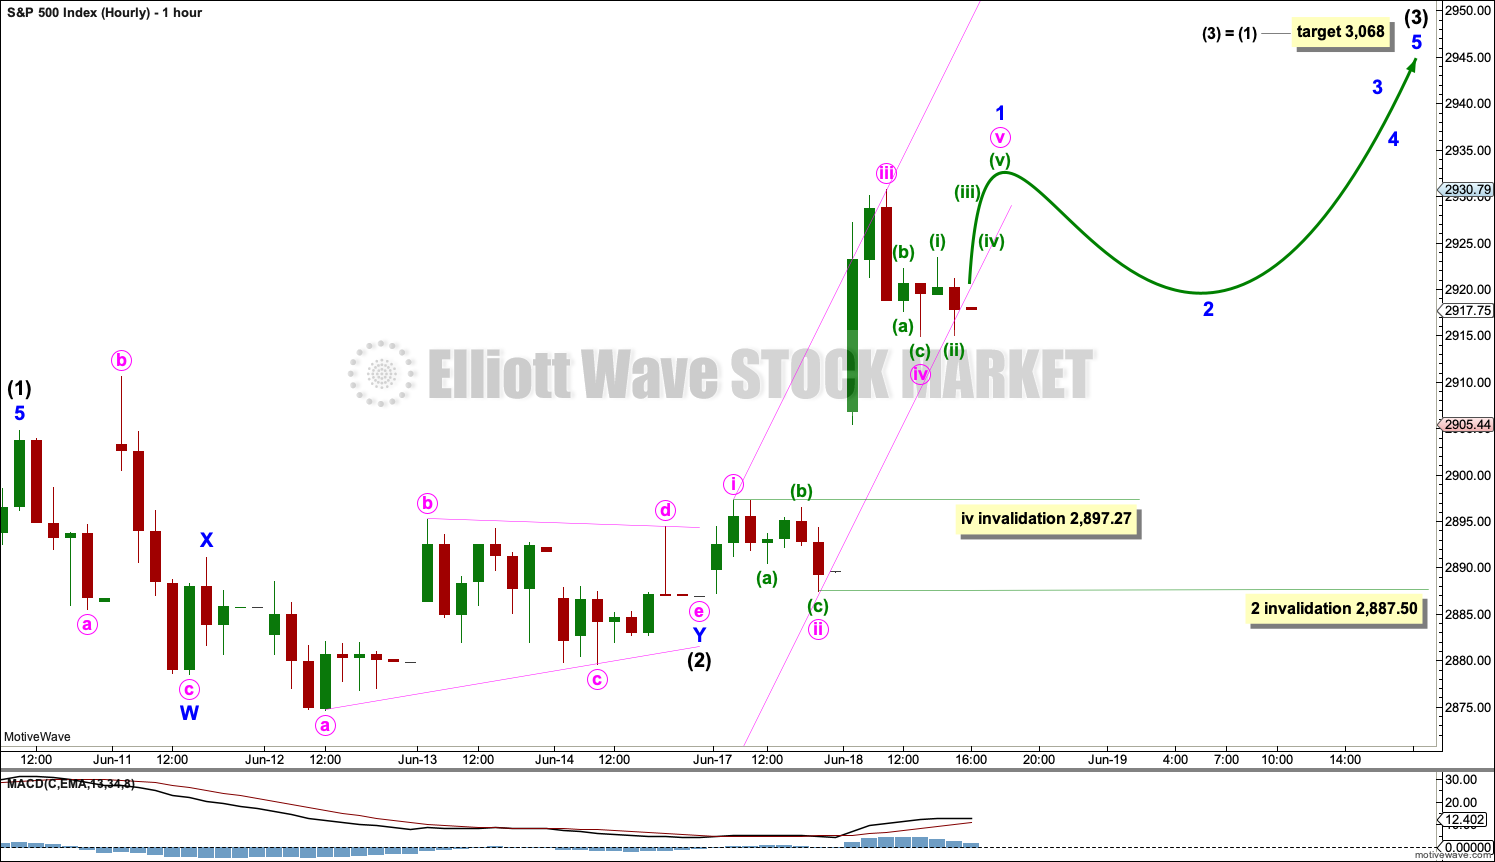
Intermediate wave (2) may now be a complete double combination: expanded flat – X – running barrier triangle.
A target is calculated for intermediate wave (3) to end.
Intermediate wave (3) may only subdivide as an impulse. Within intermediate wave (3), minor wave 1 may be incomplete.
Within minor wave 1, minute waves i through to iv may be complete. If it continues any lower, then minute wave iv may not move into minute wave i price territory below 2,897.27.
When minute wave v has moved above the end of the end of minute wave iii, avoiding a truncation, then it may be over at any stage. This would complete a five wave structure for minor wave 1. The following pullback for minor wave 2 may be expected to be relatively brief and shallow, but it may not move beyond the start of minor wave 1 below 2,887.50.
When minor wave 2 is complete, then there would be a series of three overlapping first and second waves complete at primary, intermediate and minor degree. The next wave up for minor wave 3 within intermediate wave (3) within primary wave 3 may be expected to exhibit an increase in strength.
SECOND WAVE COUNT
WEEKLY CHART
Click chart to enlarge.
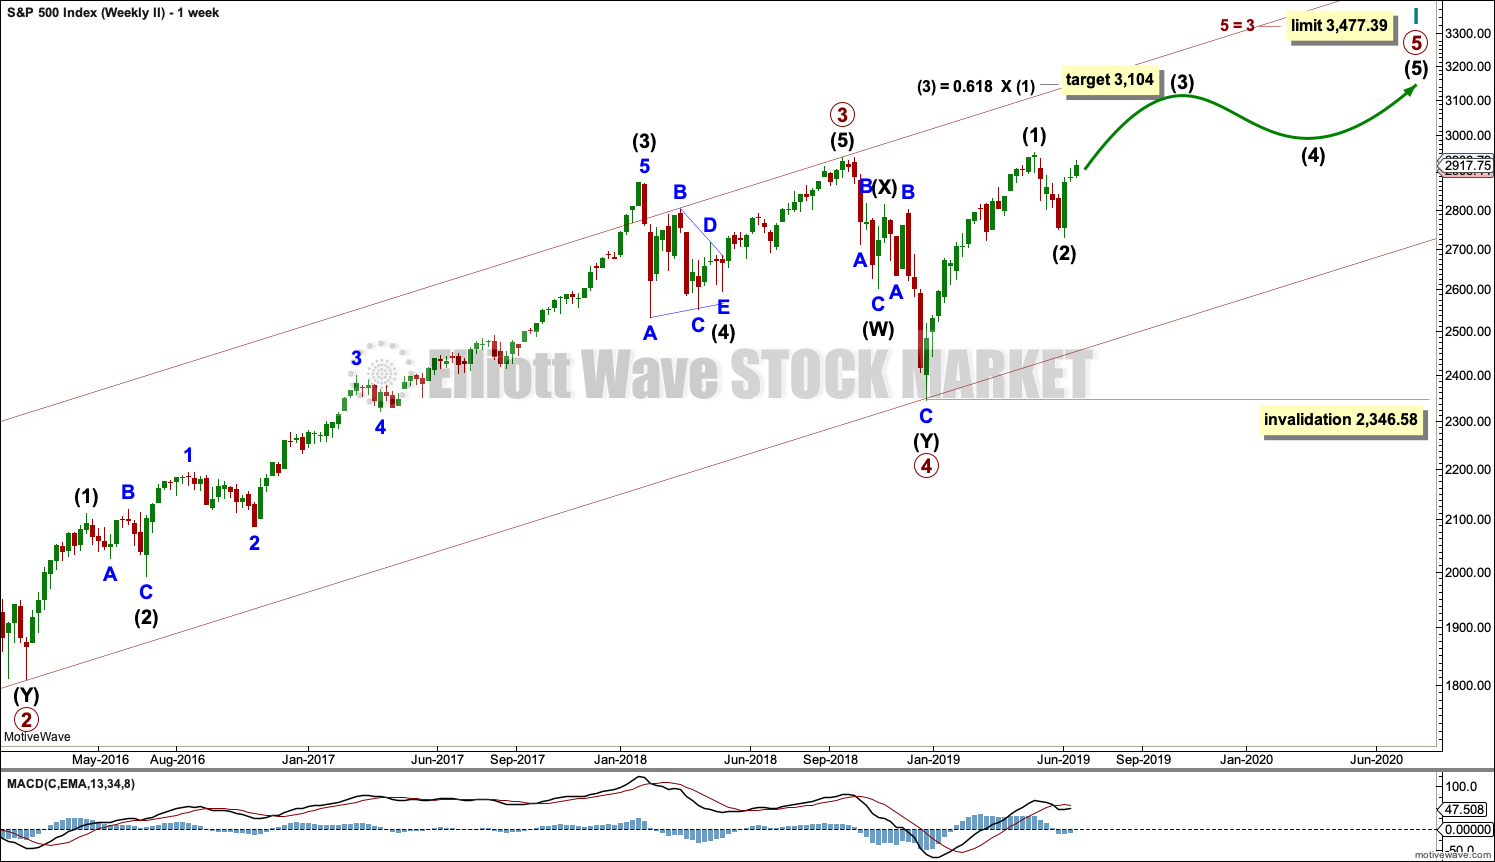
This weekly chart is almost identical to the first weekly chart, with the sole exception being the degree of labelling.
This weekly chart moves the degree of labelling for the impulse beginning in March 2009 all down one degree. This difference is best viewed on monthly charts.
The impulse is still viewed as nearing an end; a fifth wave is still seen as needing to complete higher. This wave count labels it primary wave 5.
TECHNICAL ANALYSIS
WEEKLY CHART
Click chart to enlarge. Chart courtesy of et=”_blank”>StockCharts.com.
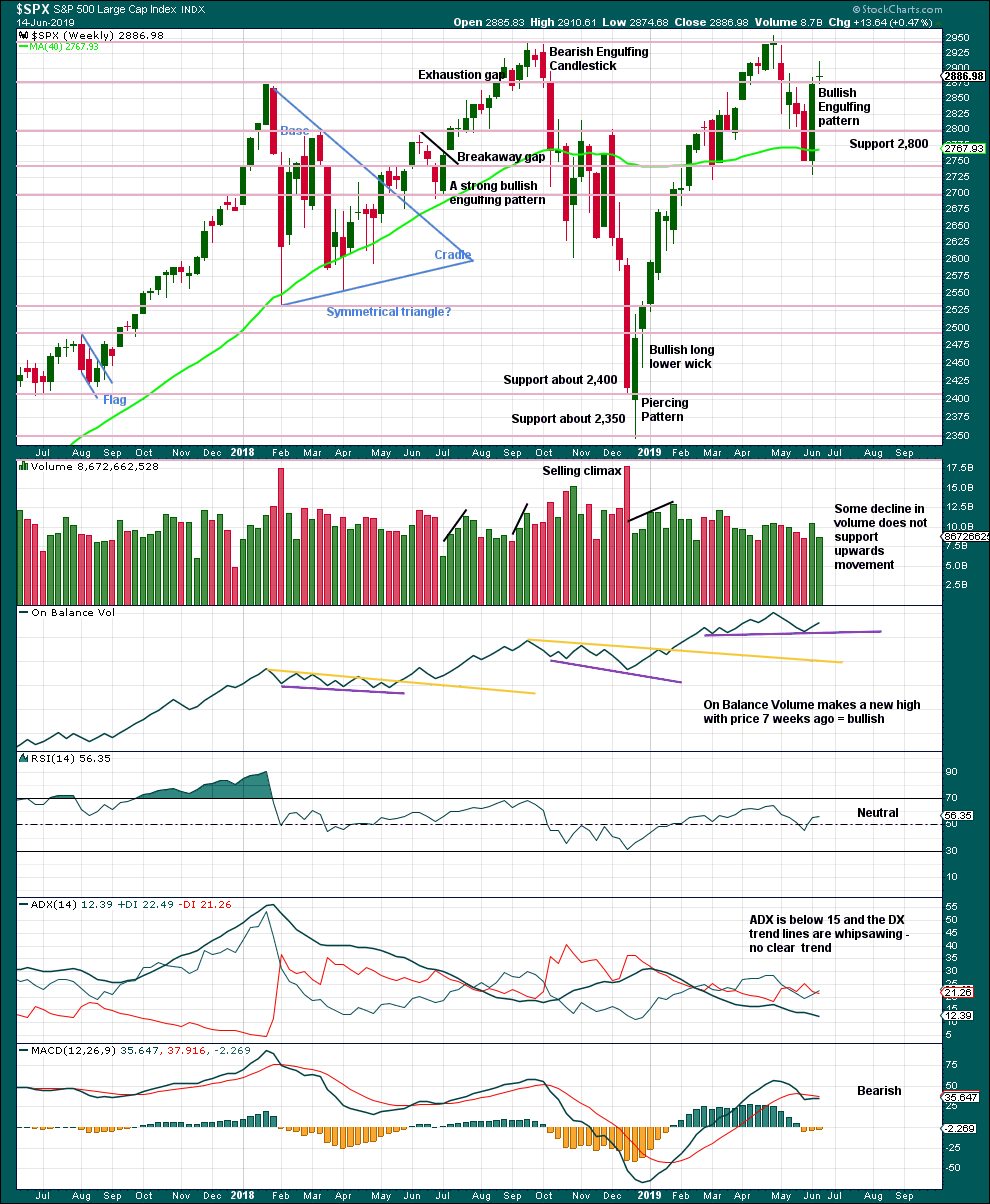
Weight will be given in this analysis to the strong bullish reversal pattern, which has support from volume. This supports the main Elliott wave counts.
The Doji candlestick last week represents indecision, a balance of bulls and bears. A Doji on its own is not a reversal signal; they can appear within trends as a small pause.
A new support line is drawn on On Balance Volume.
DAILY CHART
Click chart to enlarge. Chart courtesy of StockCharts.com.
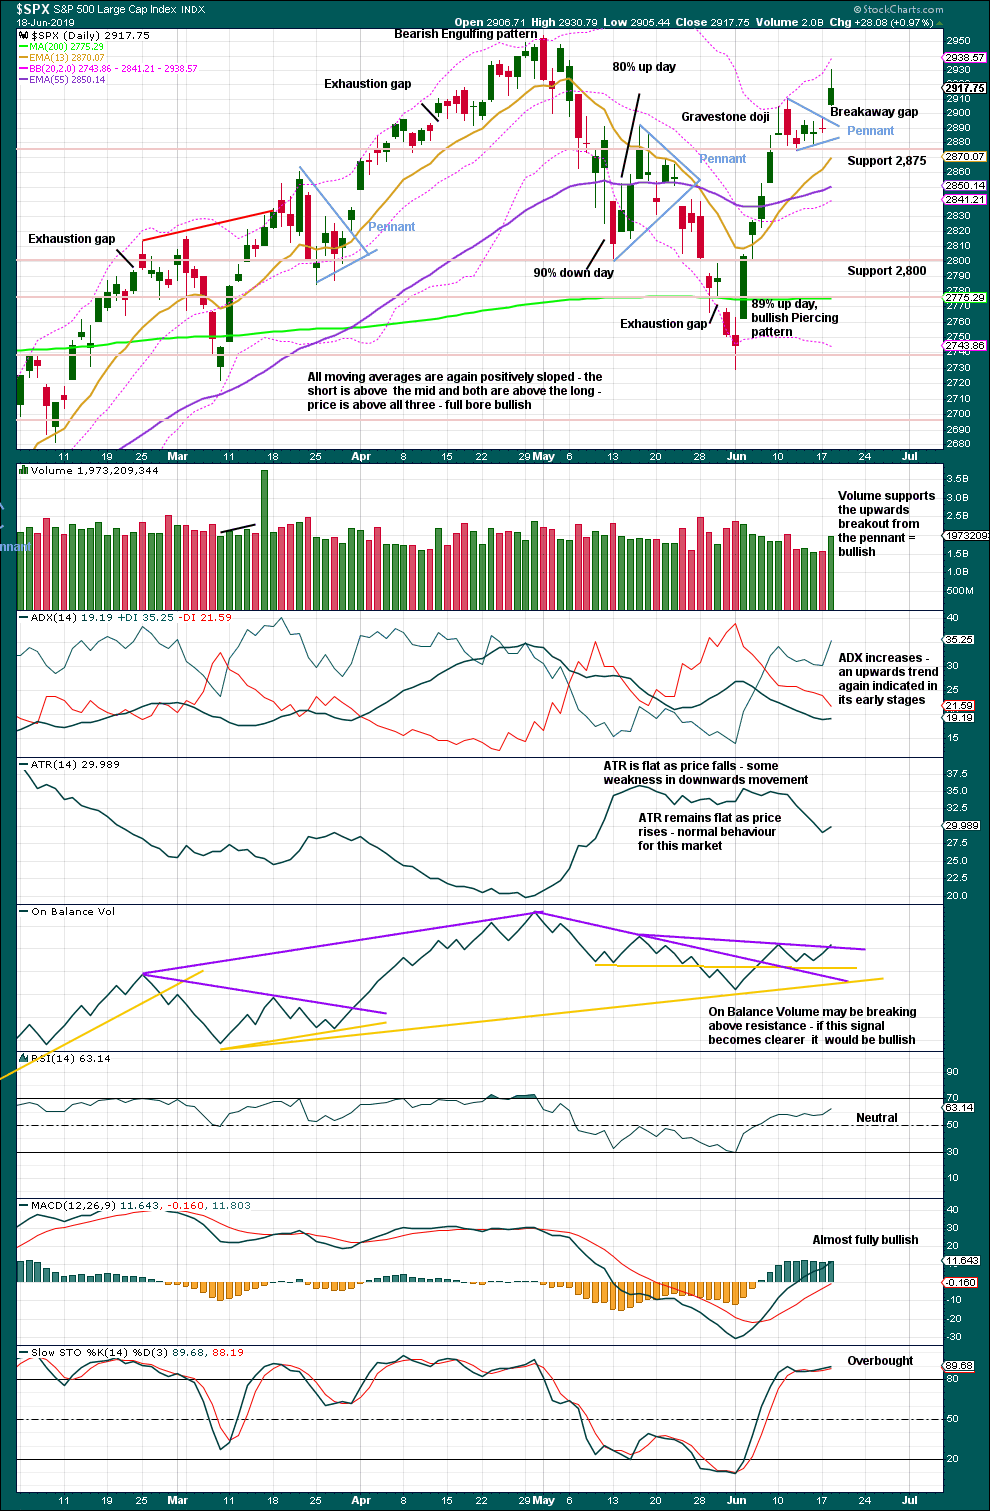
A target from the flag pole is recalculated about 3,079. This is 11 points above the short-term Elliott wave target at 3,068.
The breakaway gap today may offer support at 2,897.27.
There is an upwards trend still intact and it is far from extreme. Stochastics may remain extreme for long periods of time when this market trends. RSI has further room to rise before it reaches overbought. ADX indicates the trend has reasonable room to run before it reaches extreme. This chart is fully bullish. Expect new all time highs shortly.
BREADTH – AD LINE
WEEKLY CHART
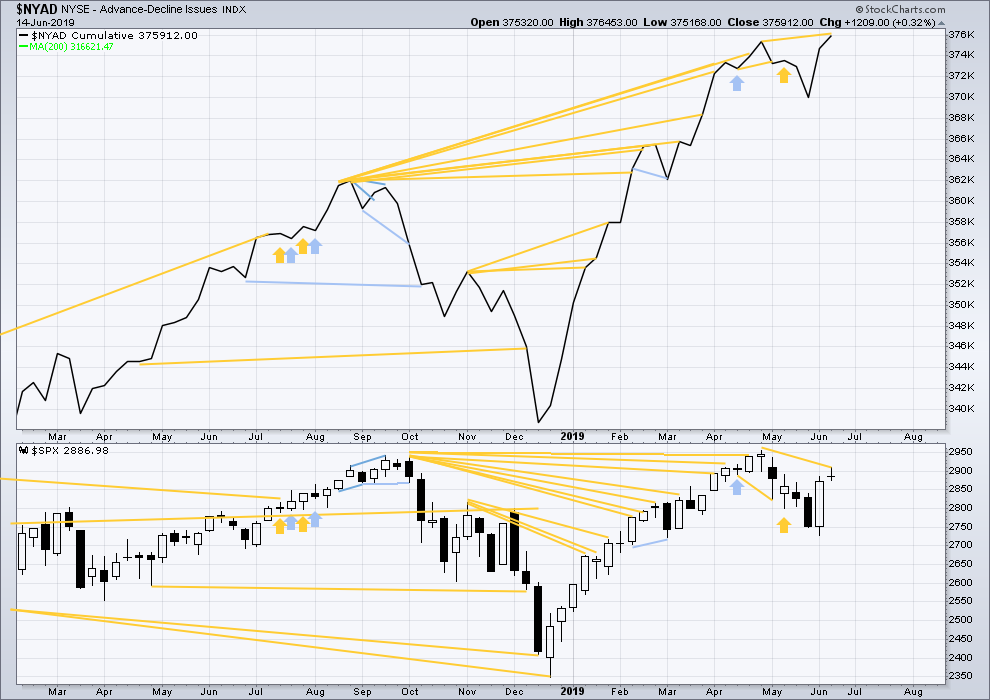
Click chart to enlarge. Chart courtesy of StockCharts.com. So that colour blind members are included, bearish signals
will be noted with blue and bullish signals with yellow.
Bear markets from the Great Depression and onwards have been preceded by an average minimum of 4 months divergence between price and the AD line with only two exceptions in 1946 and 1976. With the AD line making a new all time high today, the end of this bull market and the start of a new bear market is very likely a minimum of 4 months away, which is mid October 2019.
In all bear markets in the last 90 years there is some positive correlation (0.6022) between the length of bearish divergence and the depth of the following bear market. No to little divergence is correlated with more shallow bear markets. Longer divergence is correlated with deeper bear markets.
If a bear market does develop here, it comes after no bearish divergence. It would therefore more likely be shallow.
Today the AD line makes a new all time high, but price has failed to make a corresponding new high. Breadth normally precedes price, so a new all time high from price in coming weeks looks most likely.
DAILY CHART
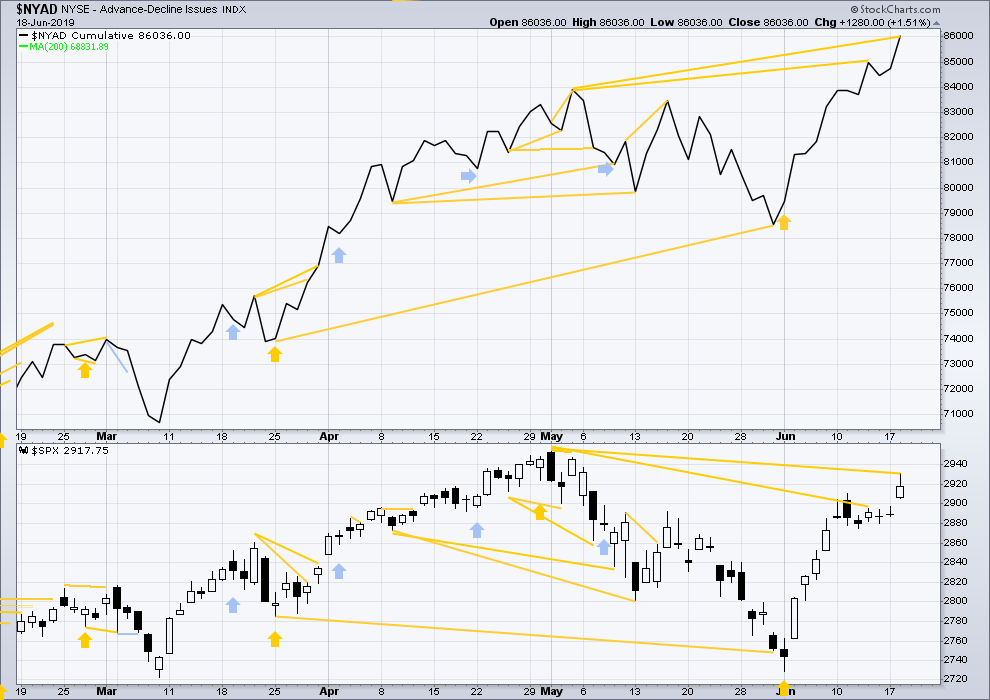
Click chart to enlarge. Chart courtesy of StockCharts.com. So that colour blind members are included, bearish signals
will be noted with blue and bullish signals with yellow.
Breadth should be read as a leading indicator.
Today the AD line makes a new all time high. Price is very likely to follow. This divergence is bullish.
VOLATILITY – INVERTED VIX CHART
WEEKLY CHART
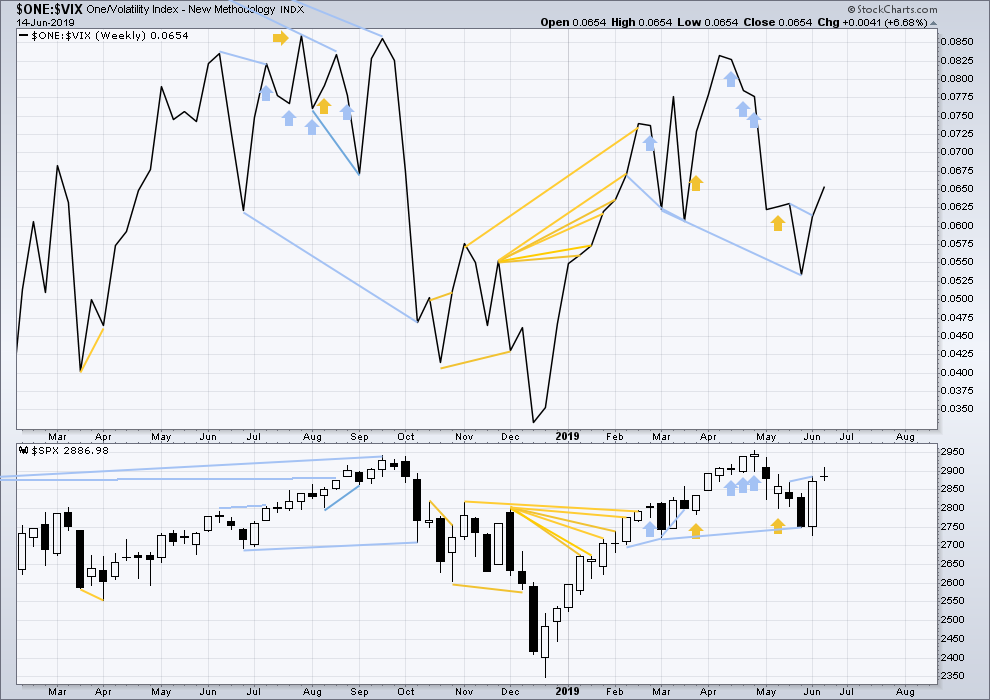
Click chart to enlarge. Chart courtesy of StockCharts.com. So that colour blind members are included, bearish signals
will be noted with blue and bullish signals with yellow.
Bearish divergence noted two weeks ago has not been followed by any downwards movement.
Last week both price and inverted VIX have moved higher. There is no new short-term divergence.
Long-term bearish divergence remains.
DAILY CHART
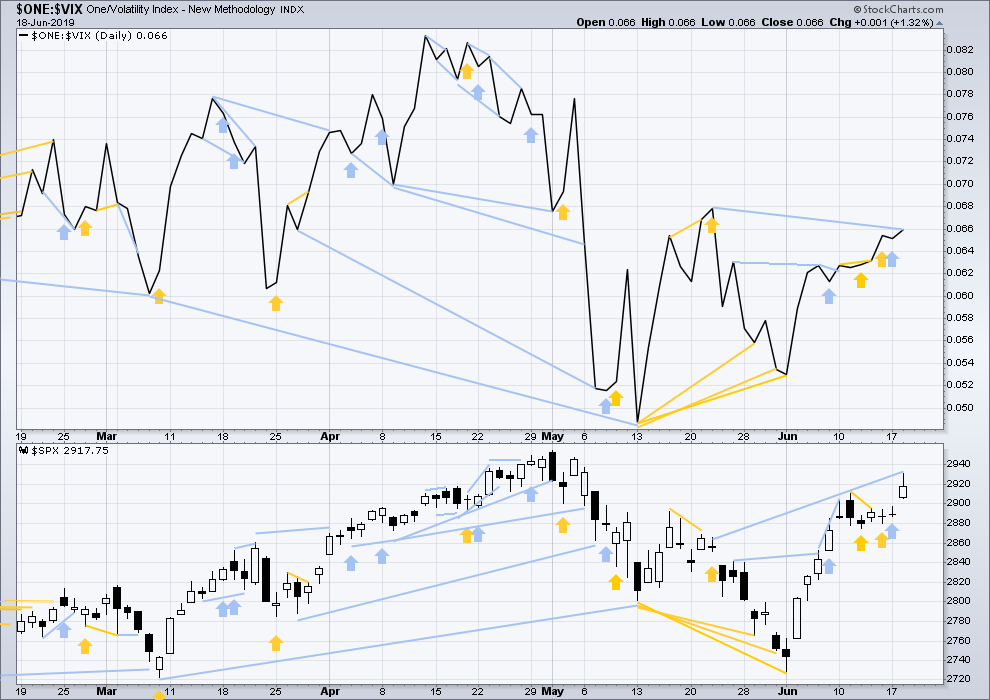
Click chart to enlarge. Chart courtesy of StockCharts.com. So that colour blind members are included, bearish signals
will be noted with blue and bullish signals with yellow.
The weak signal from bearish divergence noted in yesterday’s analysis has not been followed by downwards movement, so it is considered to have failed.
Today price has made another new high above the prior swing high of the 23rd of May, but inverted VIX has failed to make a corresponding new high. Upwards movement in price does not come with a normal corresponding decline in VIX. This divergence is bearish for the short term.
DOW THEORY
Dow Theory confirmed a bear market in December 2018. This does not necessarily mean a bear market at Grand Super Cycle degree though; Dow Theory makes no comment on Elliott wave counts. On the 25th of August 2015 Dow Theory also confirmed a bear market. The Elliott wave count sees that as part of cycle wave II. After Dow Theory confirmation of a bear market in August 2015, price went on to make new all time highs and the bull market continued.
DJIA: 23,344.52 – a close on the 19th of December at 23,284.97 confirms a bear market.
DJT: 9,806.79 – price has closed below this point on the 13th of December.
S&P500: 2,532.69 – a close on the 19th of December at 2,506.96 provides support to a bear market conclusion.
Nasdaq: 6,630.67 – a close on the 19th of December at 6,618.86 provides support to a bear market conclusion.
With all the indices having moved higher following a Dow Theory bear market confirmation, Dow Theory would confirm a bull market if the following highs are made:
DJIA: 26,951.81
DJT: 11,623.58
S&P500: 2,940.91 – a new all time high has been made on the 29th of April 2019.
Nasdaq: 8,133.30 – a new high has been made on 24th of April 2019.
Published @ 07:20 p.m. EST.
—
Careful risk management protects your trading account(s).
Follow my two Golden Rules:
1. Always trade with stops.
2. Risk only 1-5% of equity on any one trade.
—
New updates to this analysis are in bold.
Updated hourly chart:
Minute v could be over as soon as it makes a new high now above the end of minute iii at 2,930.75.
Thereafter look for a shallow pullback or consolidation for minor 2. The strong upwards pull now of a third wave at three degrees may force minor 2 to be relatively brief and shallow.
Fireworks of some sort tomorrow coming to a market near you…
I worry when there’s only one count. The odds are high for the main yes…but the implication if it doesn’t play out is “surprise reversal” which could be high momentum, as the retail crowd who all now believe this market “should go up” get caught by the professionals taking it down with big money. Could be a mini-rout.
So, the pennant should hold and I’ve bet on that, but if doesn’t, watch out below.
(Analyst speak: the market could go up or it could go down…)
Here is a headline claiming the opposite- I think EW players are bullish but majority is bearish because of trade war doom and gloom.
https://www.marketwatch.com/story/stock-market-investors-havent-been-this-bearish-since-the-2008-financial-crisis-says-bank-of-america-2019-06-18
Makes sense that all their short covers would push things higher
that’s nice…the crowd is usually wrong.
This quote from the article is amazing to me,
“Allocations to equities are at their lowest levels in history, while the month-over-month jump into cash and cash-like assets, was its biggest since August 2011. ”
Last week I pointed out the AAII bearish sentiment was at 42.58% which is its highest level since the low in Dec./Jan. In addition, the bullish sentiment was only 22% which is its lowest level in the same period. As we know this is a very good contrarian indicator. Thanks for the article reference Hokipa555.
YW Rodney
This is a 4 hour candle chart for June.
even to my untrained HA chart eye…that looks bullish.