
More sideways movement was expected to begin the new week. A small range Doji candlestick exactly fits this expectation. A target for this consolidation to end may now be calculated.
Summary: The low of December 2018 is expected to most likely remain intact.
The current consolidation may end this week and may continue to be very shallow. The target is now at 2,874. A third wave up may then continue and may exhibit an increase in strength. The target remains at 3,104.
The biggest picture, Grand Super Cycle analysis, is here.
Monthly charts were last published here, with video here. There are two further alternate monthly charts here, with video here.
ELLIOTT WAVE COUNTS
The two Elliott wave counts below will be labelled First and Second. They may be about of even probability. When the fifth wave currently unfolding on weekly charts may be complete, then these two wave counts will diverge on the severity of the expected following bear market. To see an illustration of this future divergence monthly charts should be viewed.
FIRST WAVE COUNT
WEEKLY CHART
Click chart to enlarge.
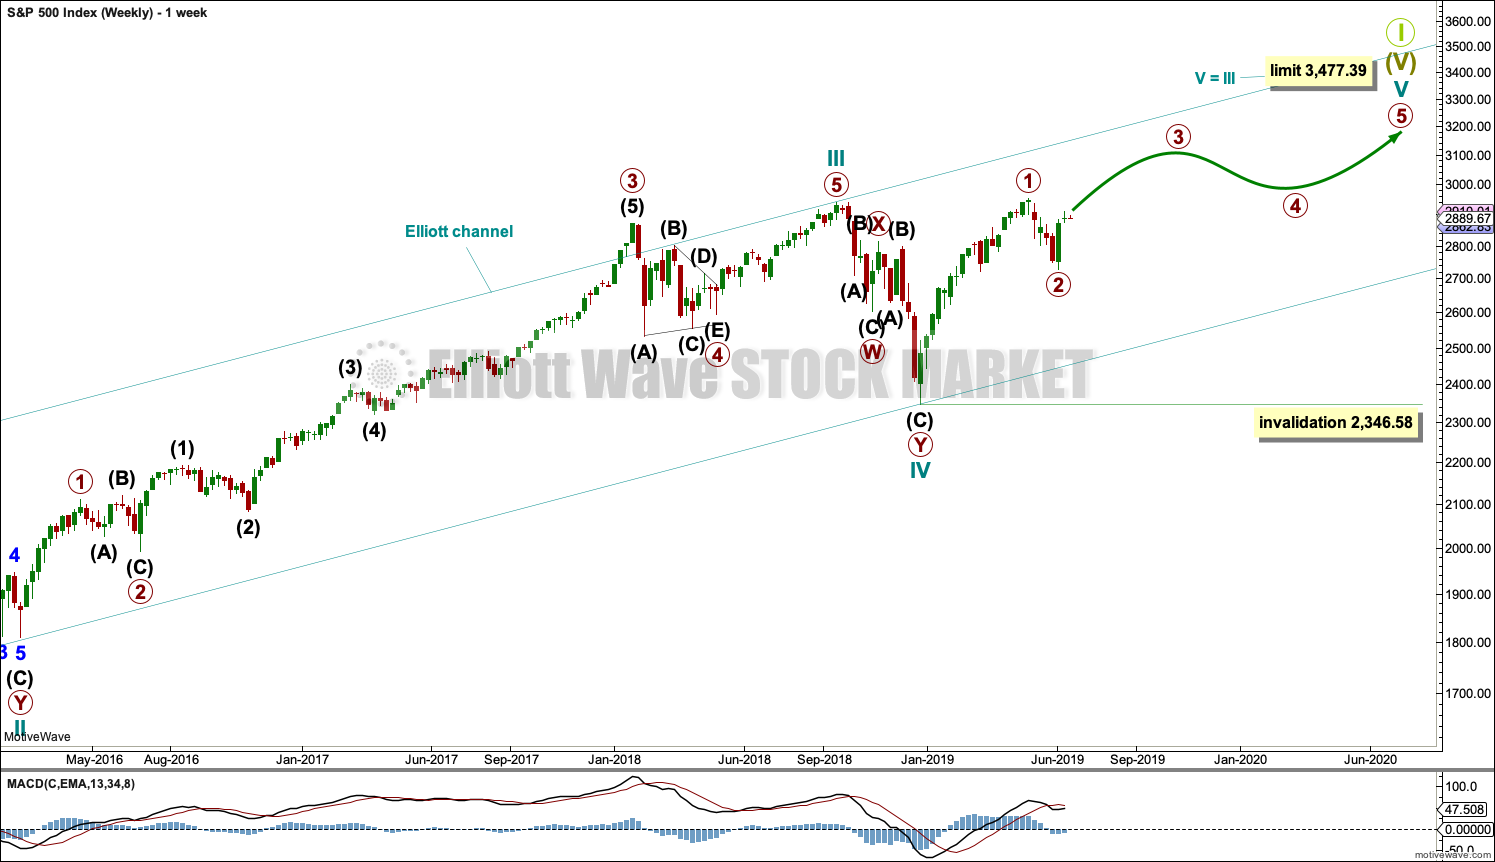
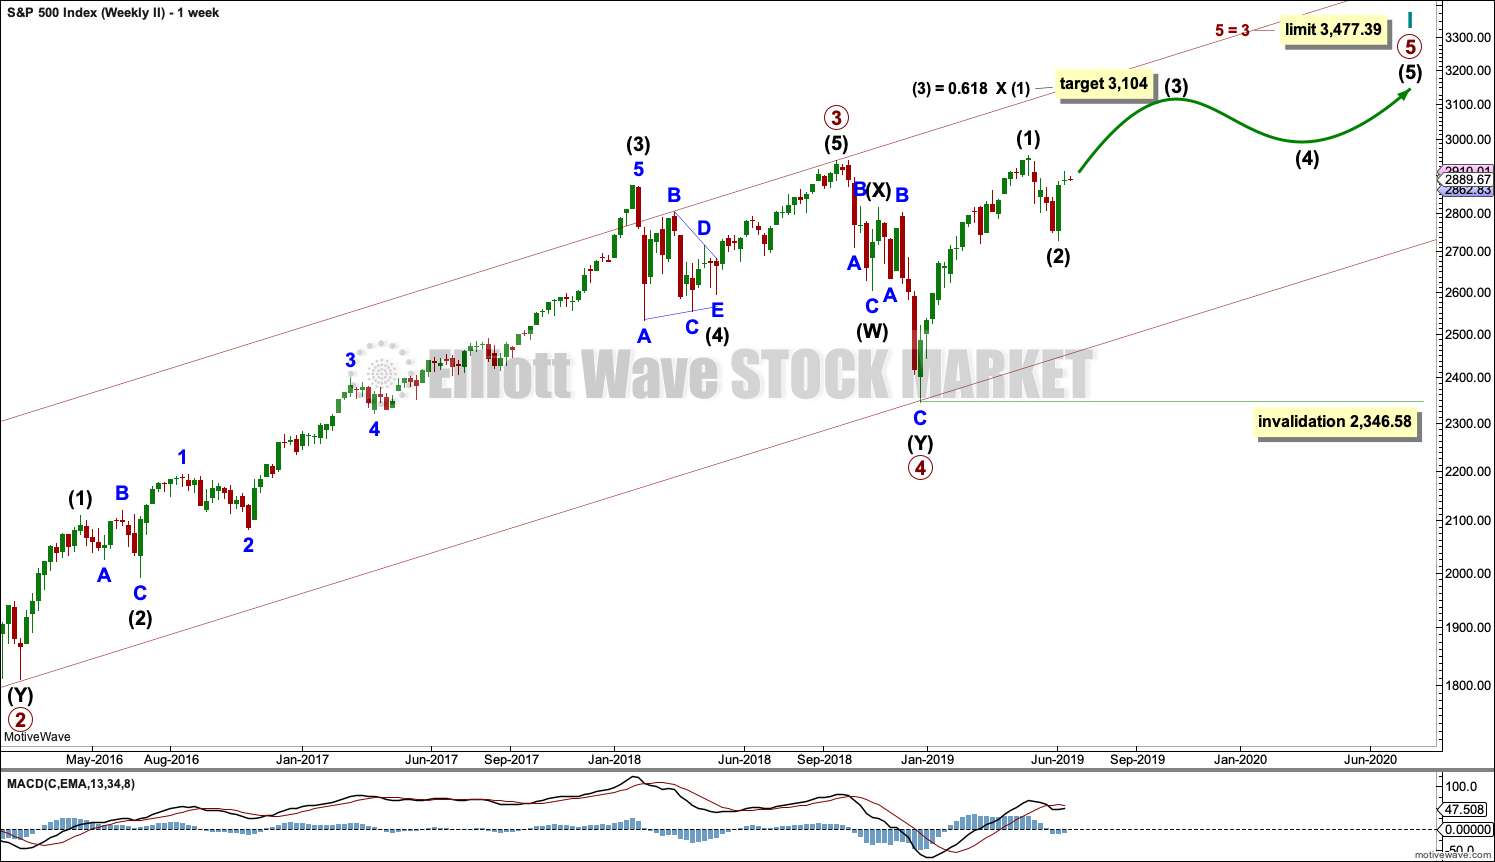
The basic Elliott wave structure consists of a five wave structure up followed by a three wave structure down (for a bull market). This wave count sees the bull market beginning in March 2009 as an incomplete five wave impulse and now within the last fifth wave, which is labelled cycle wave V. This impulse is best viewed on monthly charts. The weekly chart focusses on the end of it.
Elliott wave is fractal. This fifth wave labelled cycle wave V may end a larger fifth wave labelled Super Cycle wave (V), which may end a larger first wave labelled Grand Super Cycle wave I.
The teal Elliott channel is drawn using Elliott’s first technique about the impulse of Super Cycle wave (V). Draw the first trend line from the end of cycle wave I (off to the left of the chart, the weekly candlestick beginning 30th November 2014) to the end of cycle wave III, then place a parallel copy on the end of cycle wave II. This channel perfectly shows where cycle wave IV ended at support. The strongest portion of cycle wave III, the end of primary wave 3, overshoots the upper edge of the channel. This is a typical look for a third wave and suggests the channel is drawn correctly and the way the impulse is counted is correct.
Within Super Cycle wave (V), cycle wave III is shorter than cycle wave I. A core Elliott wave rule states that a third wave may never be the shortest. For this rule to be met in this instance, cycle wave V may not be longer in length than cycle wave III. This limit is at 3,477.39.
The structure of cycle wave V is focussed on at the daily chart level below.
Within cycle wave V, primary wave 2 may not move beyond the start of primary wave 1 below 2,346.58.
In historic analysis, two further monthly charts have been published that do not have a limit to upwards movement and are more bullish than this wave count. Members are encouraged to consider those possibilities (links below summary) alongside the wave counts presented on a daily and weekly basis.
DAILY CHART
Click chart to enlarge.
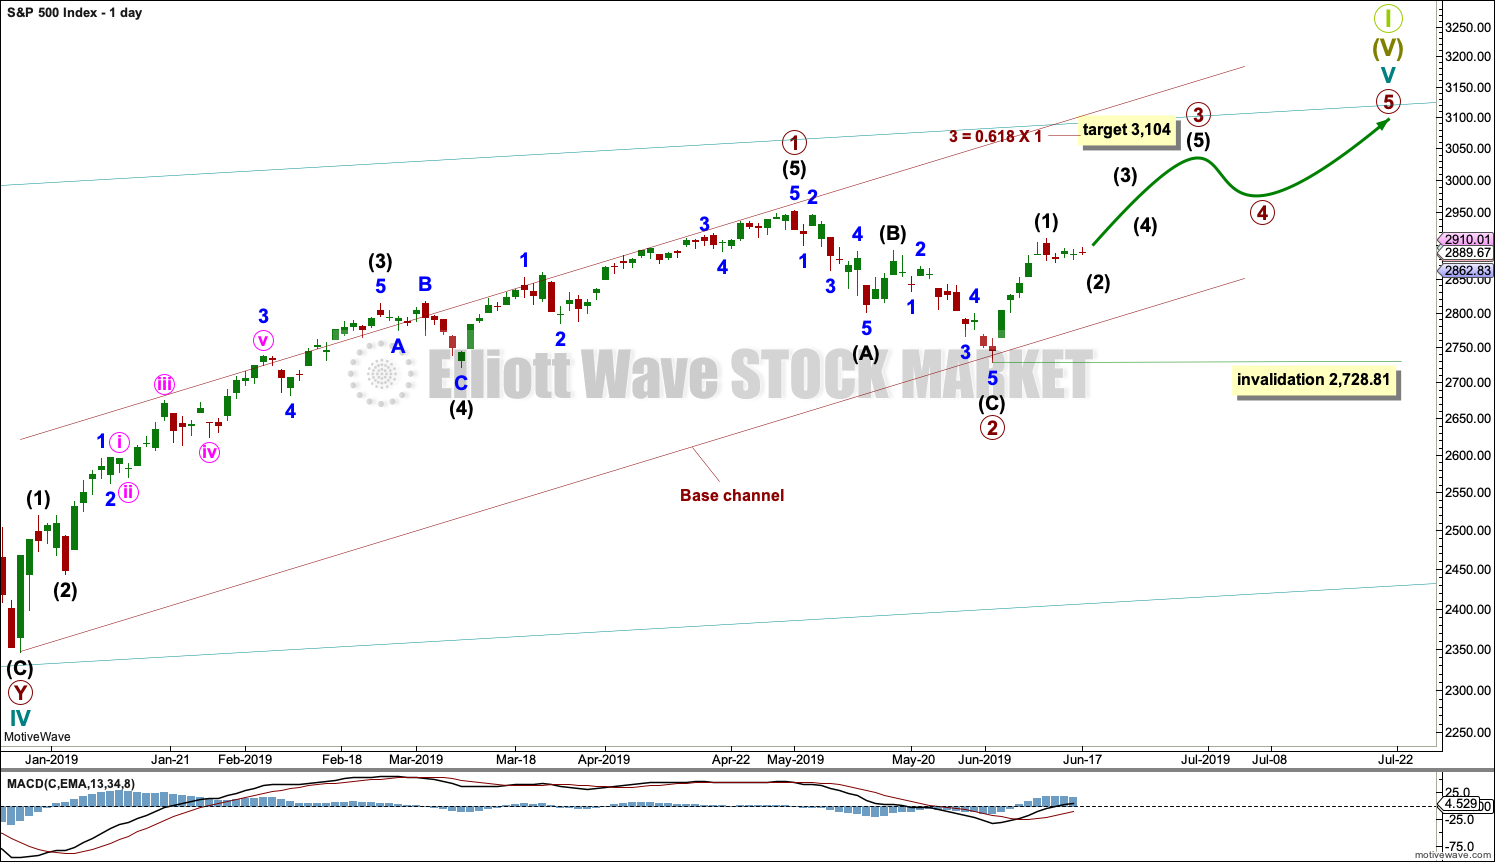
Cycle wave V must subdivide as a five wave motive structure. Within that five wave structure, primary waves 1 and 2 may be complete.
Primary wave 3 must move above the end of primary wave 1. Primary wave 3 may only subdivide as an impulse. Within the impulse, intermediate wave (2) may not move beyond the start intermediate wave (1) below 2,728.81.
When primary wave 3 is over, then primary wave 4 may be a shallow sideways consolidation that may not move into primary wave 1 price territory below 2,954.13.
Thereafter, primary wave 5 should move above the end of primary wave 3 to avoid a truncation.
A base channel is drawn about primary waves 1 and 2. The lower edge is drawn from the start of primary wave 1 to the end of primary wave 2, then a parallel copy is placed upon the high of primary wave 1. Along the way up, corrections within primary wave 3 may find support about the lower edge of the base channel. Primary wave 3 may have the power to break above the upper edge of the channel.
Primary wave 1 lasted 86 sessions, 3 short of a Fibonacci 89. Primary wave 2 lasted 22 sessions, 1 longer than a Fibonacci 21. Primary wave 3 may end about a Fibonacci 55 sessions, give or take two or three sessions either side. This is a rough guideline only.
So far primary wave 3 has lasted 10 sessions.
HOURLY CHART
Click chart to enlarge.
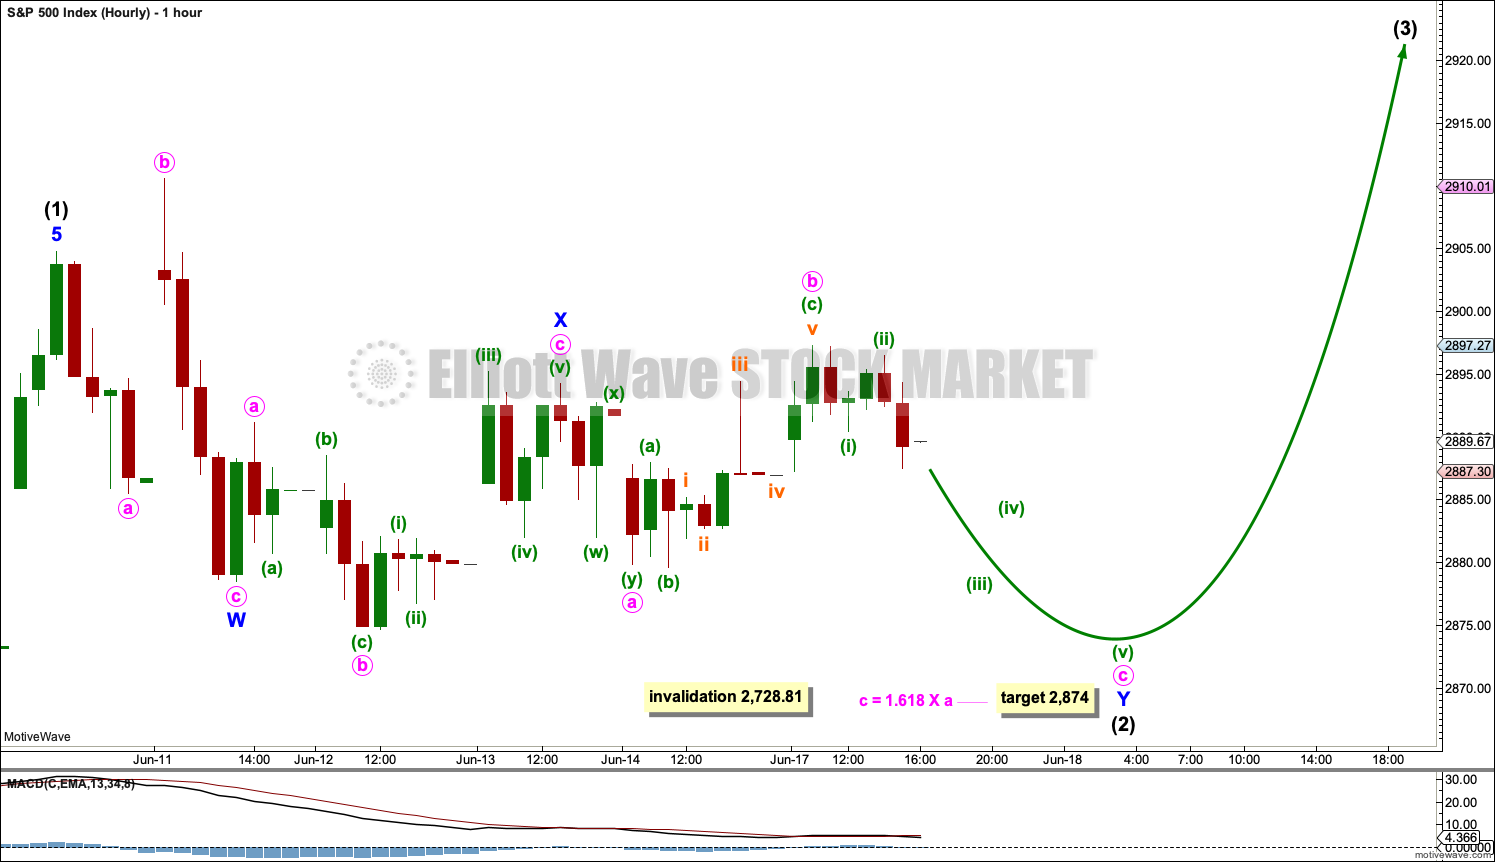
Following a five up, a three back should develop. This will be labelled intermediate wave (2).
Intermediate wave (2) may unfold as any corrective Elliott wave structure except a triangle. Today intermediate wave (2) will be labelled as an incomplete double flat. The first structure in the double may be a complete expanded flat labelled minor wave W. The double may now be joined by a small three in the opposite direction labelled minor wave X, which subdivides as an expanded flat.
The second structure in the double labelled minor wave Y may now unfold as a flat correction to complete a double flat for intermediate wave (2). Within this flat correction, minute wave b has met the minimum required retracement of 0.9 the length of minute wave a. Minute wave b is a 1.21 length of minute wave a, indicating minor wave Y may be an expanded flat.
Minute wave c may then move below the end of minute wave a to avoid a truncation. A target is calculated for minute wave c to end.
Due to the strong upwards pull of intermediate wave (3) within primary wave 3 just ahead, intermediate wave (2) may be forced to be relatively shallow. If intermediate wave (2) is deeper, then the lower edge of the black Elliott channel may provide final support for a back test.
Intermediate wave (2) may not move beyond the start of intermediate wave (1) below 2,728.81.
ALTERNATE HOURLY CHART
Click chart to enlarge.
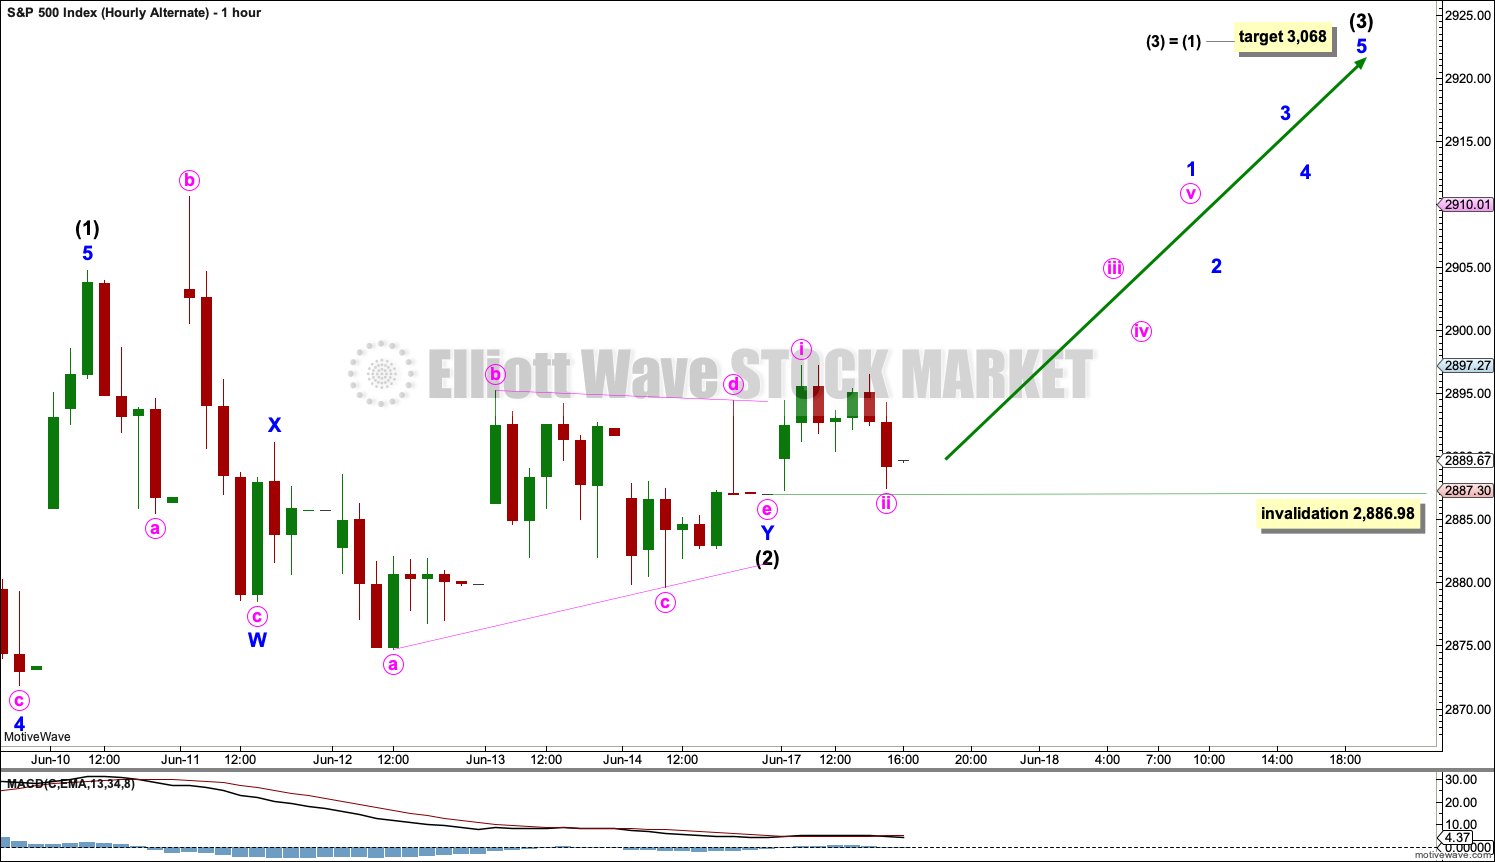
It is today possible to see intermediate wave (2) a complete double combination: expanded flat – X – running barrier triangle.
A target is calculated for intermediate wave (3) to end.
Minute wave ii may not move beyond the start of minute wave i below 2,886.98.
SECOND WAVE COUNT
WEEKLY CHART
Click chart to enlarge.
This weekly chart is almost identical to the first weekly chart, with the sole exception being the degree of labelling.
This weekly chart moves the degree of labelling for the impulse beginning in March 2009 all down one degree. This difference is best viewed on monthly charts.
The impulse is still viewed as nearing an end; a fifth wave is still seen as needing to complete higher. This wave count labels it primary wave 5.
TECHNICAL ANALYSIS
WEEKLY CHART
Click chart to enlarge. Chart courtesy of et=”_blank”>StockCharts.com.
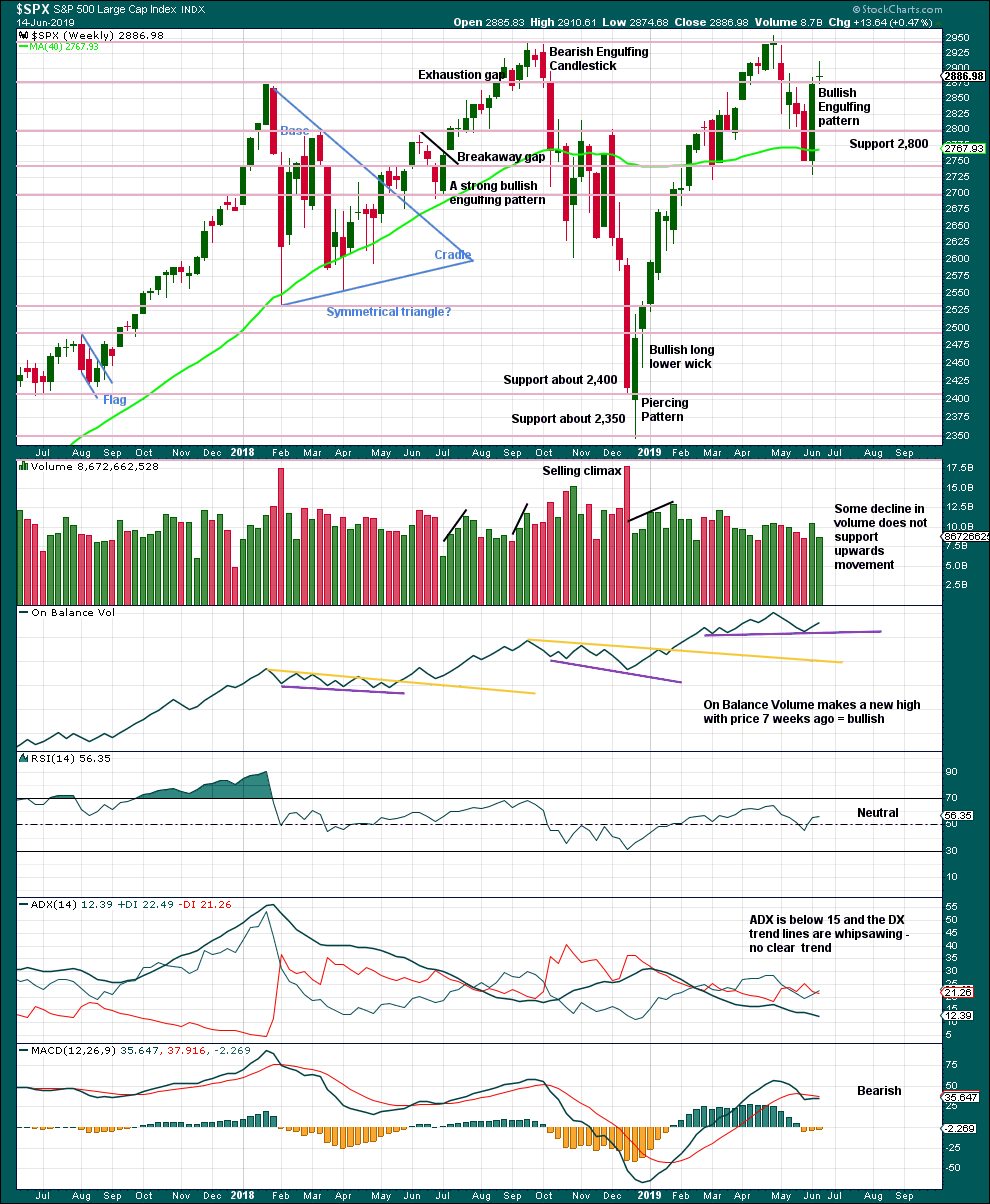
Weight will be given in this analysis to the strong bullish reversal pattern, which has support from volume. This supports the main Elliott wave counts.
The Doji candlestick last week represents indecision, a balance of bulls and bears. A Doji on its own is not a reversal signal; they can appear within trends as a small pause.
A new support line is drawn on On Balance Volume.
DAILY CHART
Click chart to enlarge. Chart courtesy of StockCharts.com.
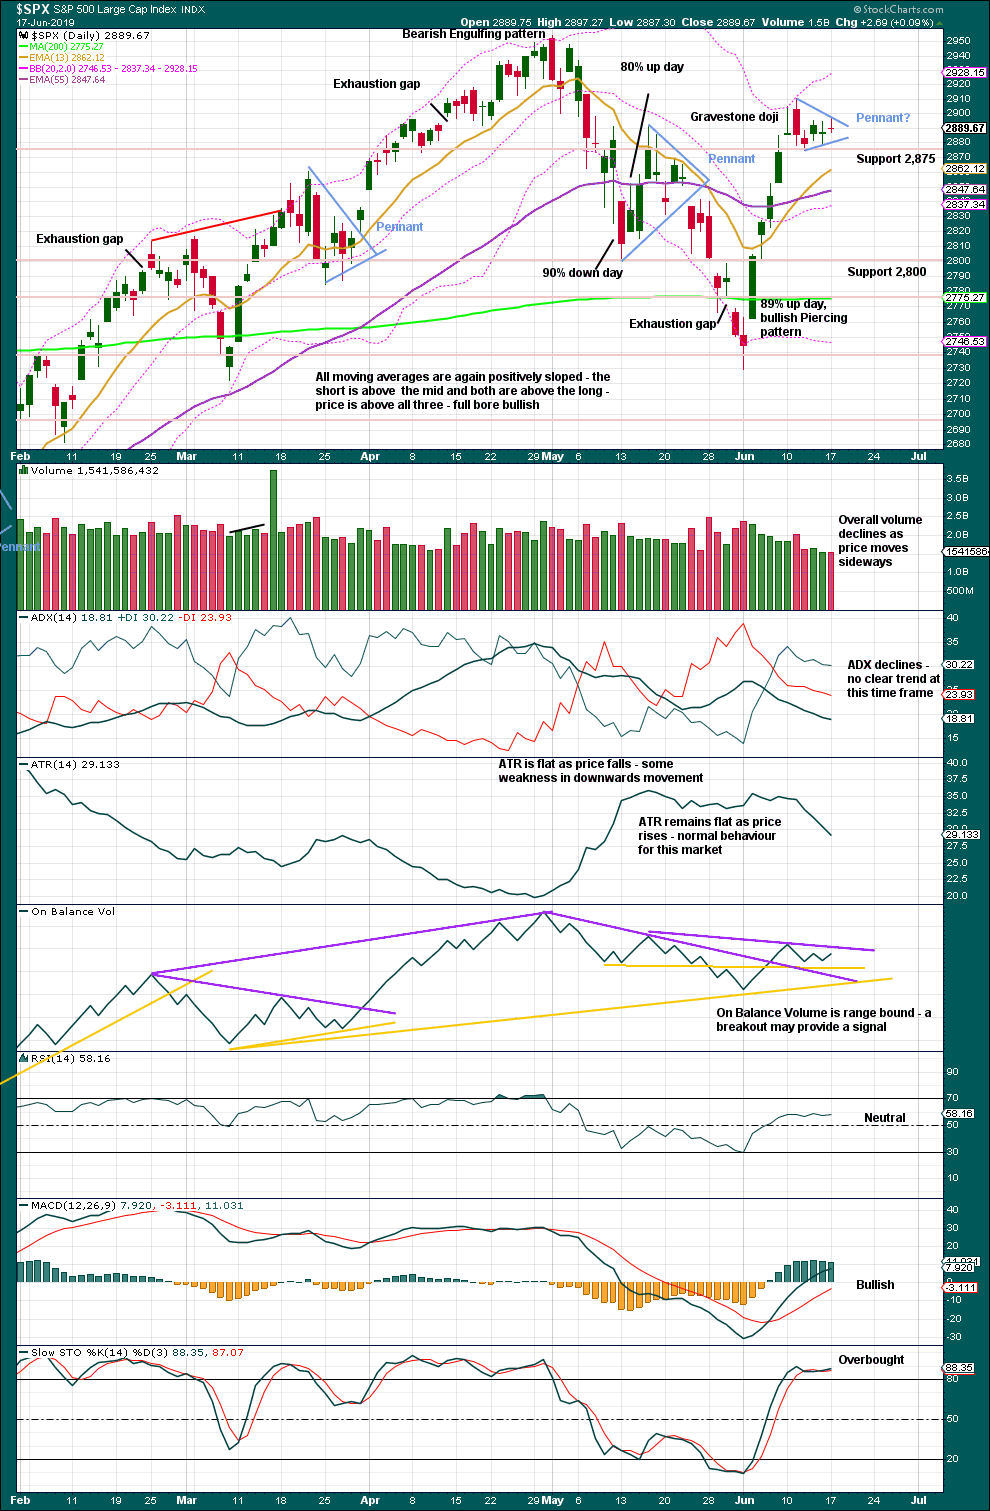
A small pennant may be forming. The trend lines are today slightly adjusted. Pennants are reliable continuation patterns. A target from the flag pole is about 3,072.
BREADTH – AD LINE
WEEKLY CHART
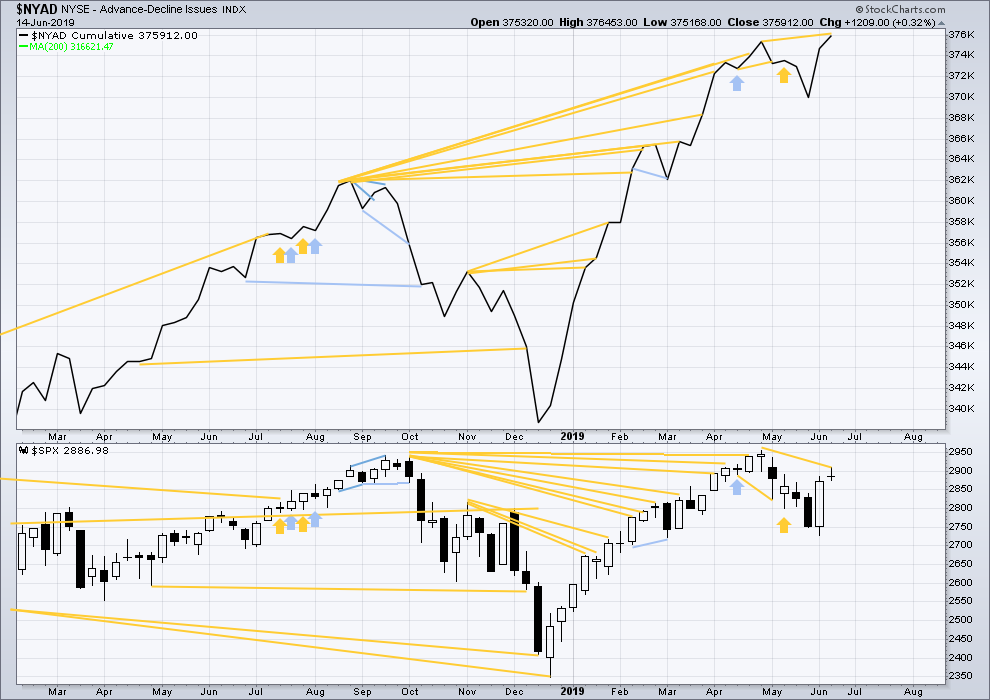
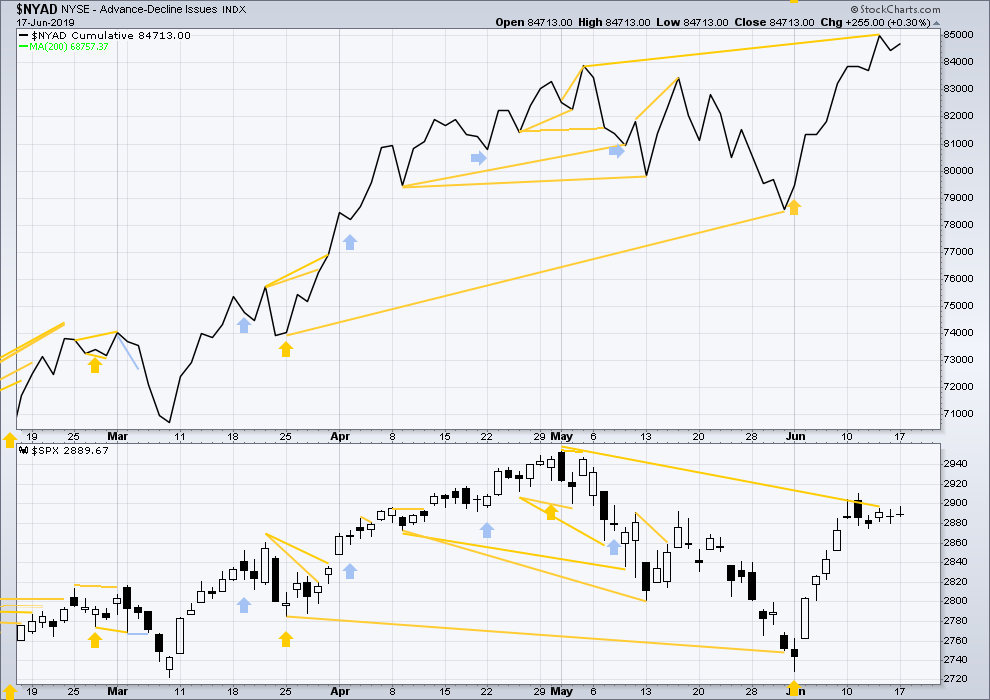
Click chart to enlarge. Chart courtesy of StockCharts.com. So that colour blind members are included, bearish signals
will be noted with blue and bullish signals with yellow.
Bear markets from the Great Depression and onwards have been preceded by an average minimum of 4 months divergence between price and the AD line with only two exceptions in 1946 and 1976. With the AD line making a new all time high last week, the end of this bull market and the start of a new bear market is very likely a minimum of 4 months away, which is mid October 2019.
In all bear markets in the last 90 years there is some positive correlation (0.6022) between the length of bearish divergence and the depth of the following bear market. No to little divergence is correlated with more shallow bear markets. Longer divergence is correlated with deeper bear markets.
If a bear market does develop here, it comes after no bearish divergence. It would therefore more likely be shallow.
Last week the AD line makes a new all time high, but price has failed to make a corresponding new high. Breadth normally precedes price, so a new all time high from price in coming weeks looks most likely.
DAILY CHART
Click chart to enlarge. Chart courtesy of StockCharts.com. So that colour blind members are included, bearish signals
will be noted with blue and bullish signals with yellow.
Breadth should be read as a leading indicator.
Both price and the AD line moved a little higher today. There is no new short-term divergence. Mid-term divergence remains bullish.
VOLATILITY – INVERTED VIX CHART
WEEKLY CHART
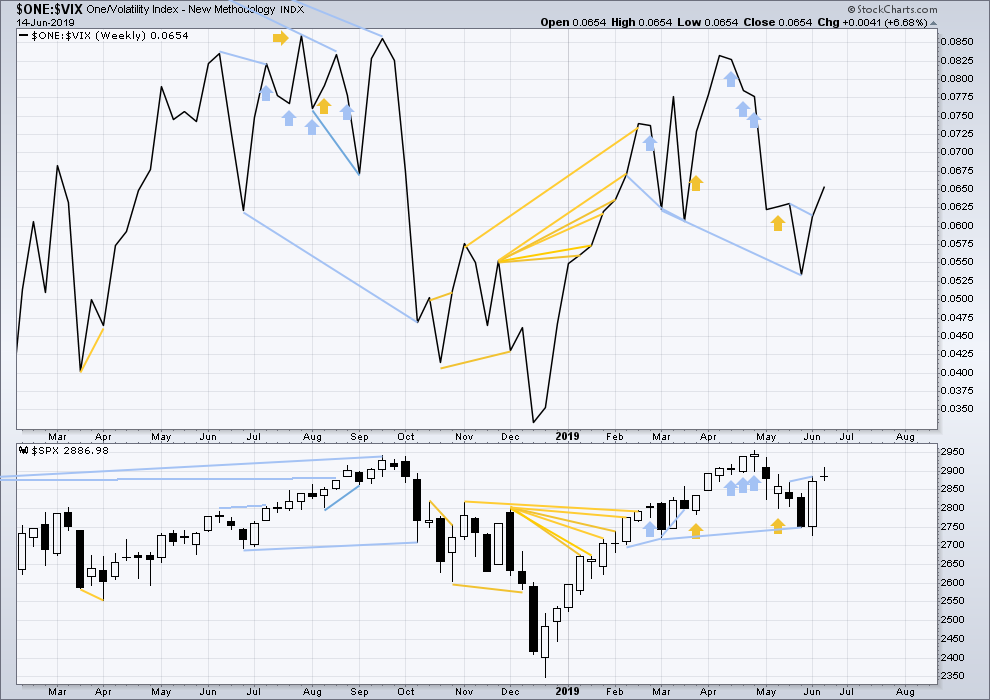
Click chart to enlarge. Chart courtesy of StockCharts.com. So that colour blind members are included, bearish signals
will be noted with blue and bullish signals with yellow.
Bearish divergence noted two weeks ago has not been followed by any downwards movement.
Last week both price and inverted VIX have moved higher. There is no new short-term divergence.
Long-term bearish divergence remains.
DAILY CHART
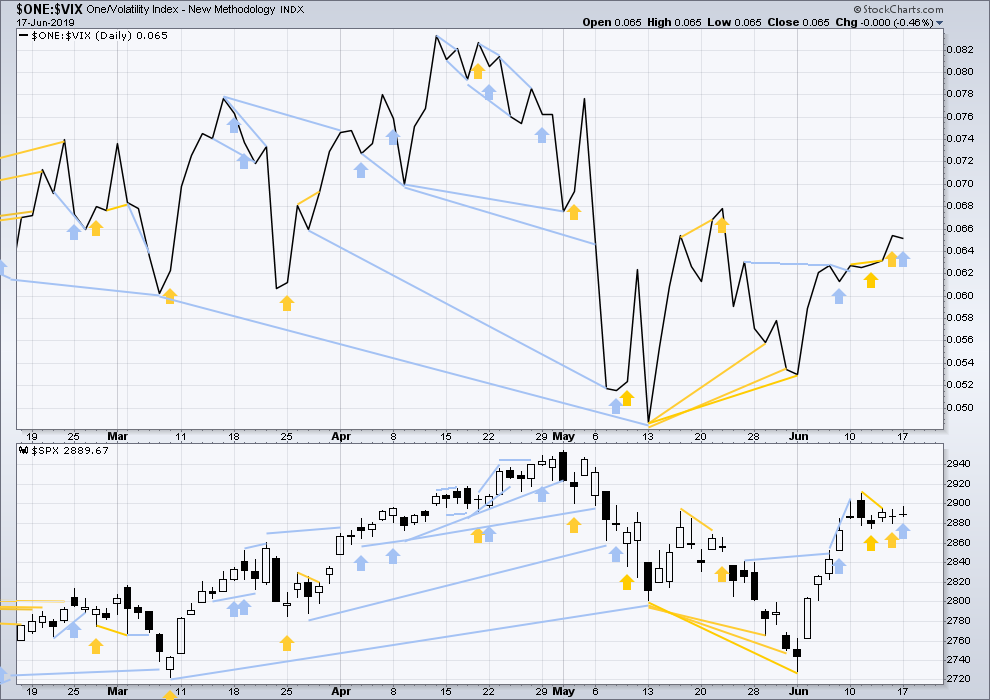
Click chart to enlarge. Chart courtesy of StockCharts.com. So that colour blind members are included, bearish signals
will be noted with blue and bullish signals with yellow.
Price has moved slightly higher on Monday although the candlestick has closed as a small red Doji. Inverted VIX has moved slightly lower. Upwards movement today in price does not come with a normal corresponding decline in VIX. VIX has increased. This divergence is bearish, but it is weak and only one day, so it shall be given no weight in this analysis.
DOW THEORY
Dow Theory confirmed a bear market in December 2018. This does not necessarily mean a bear market at Grand Super Cycle degree though; Dow Theory makes no comment on Elliott wave counts. On the 25th of August 2015 Dow Theory also confirmed a bear market. The Elliott wave count sees that as part of cycle wave II. After Dow Theory confirmation of a bear market in August 2015, price went on to make new all time highs and the bull market continued.
DJIA: 23,344.52 – a close on the 19th of December at 23,284.97 confirms a bear market.
DJT: 9,806.79 – price has closed below this point on the 13th of December.
S&P500: 2,532.69 – a close on the 19th of December at 2,506.96 provides support to a bear market conclusion.
Nasdaq: 6,630.67 – a close on the 19th of December at 6,618.86 provides support to a bear market conclusion.
With all the indices having moved higher following a Dow Theory bear market confirmation, Dow Theory would confirm a bull market if the following highs are made:
DJIA: 26,951.81
DJT: 11,623.58
S&P500: 2,940.91 – a new all time high has been made on the 29th of April 2019.
Nasdaq: 8,133.30 – a new high has been made on 24th of April 2019.
Published @ 06:10 p.m. EST.
—
Careful risk management protects your trading account(s).
Follow my two Golden Rules:
1. Always trade with stops.
2. Risk only 1-5% of equity on any one trade.
—
New updates to this analysis are in bold.
My weekly view of SPX. Trend is back to neutral at this time frame, after reaching “down” for 2 weeks through the pivot of primary 2->primary 3. Price is above the 78.6% of the Mar-May up swing, and thus extremely likely to reach 100% (the ATH). Once through that, the 127% of the entire Dec low to May high is up there overlapped with several smaller swing 162% extensions. That zone is from 3098 to 3122. The lower 127% levels show are very likely significant stall and consolidate (start of ii’s and iv’s) price levels.
I’ve got a cheap cost/high reward butterfly at the area of the lower gray ellipse. Elliot wave provides to ability to turn these very low probability (and hence really low cost) bets into +EV plays, for certain.
Not shown but the SPX monthly is now in a squeeze (a low volatility period where bollinger bands move inside keltner channels at particular settings), with June being month 4. That happened (2 months worth) in July of 2012. And also (17 months worth) Aug 2015 to Nov 2016. Both were followed by incredible high momentum up moves on the monthly chart: 3 years of solid monthly “up” in the 2012 set up, and one year of solid monthly “up” following the late 2016 set up.
Me thinks it’s time to be and stay aggressive to the long side. Play ball!!!
I added a butterfly to my holdings at the price level of the higher gray box, but out a month where it should be positioned based on recent price momentum behavior. Aug 15 expiry, 3090/3065/3115, only $120 per fly, pays a max of $2300. Max loss what I paid but should things go amiss, I should have an opportunity to cut even that loss.
I’d estimate my odds of exiting with a profit at only 30-40%. However, I believe the overall EV is very positive, due to the edge provided by the EW count, the squeeze, the fibonacci structure, and info about recent price swing “rates”. It’s all about getting edge overall.
Thanks for sharing Kevin!
The main hourly will be discarded, the alternate hourly becomes the sole remaining hourly wave count today.
Next target, 3,068 for a shallow consolidation.
The short term invalidation point is moved up. A short term channel is drawn about minor 1.
Within this first five up, minute iv may not move into minute i price territory.
Checking in from Chicago. A nice breakout upwards for the bulls. The pennant formation looks complete and we are on our way above 3000 SPX. I am doing my morning happy dance! Have a great day everyone.
Yea, my aggressive positioning during that 2 down is paying off here, and hopefully more for the next week or two or three. “All in”, across about 22 positions, and I popped about five winners today and shoved back into to new positions. Tomorrow should be Very Interesting. Apparently only about a 20% chance of a rate decrease tomorrow, but given we know it’s 3 of 3 time…and given that shorter term T bill rates are falling and Ciovacco has educated us that the fed’s just follow the T bill market…maybe they do cut and the market goes nuts to the upside? We’ll see.
Shorts closed at the open. There is a gap to fill above …. almost there !
bingo bango bongo!
DJT leading the way down?