
Some consolidation or pullback was expected to have begun at the end of last week. An outside day, which closes red overall, fits this expectation as at the close price was little changed from the end of last week.
Summary: The low of December 2018 is expected to most likely remain intact.
The target for a third wave up to end remains at 3,104. Along the way up, two consolidations or pullbacks are expected and the first looks likely to have just begun today. The first preferred area of support is about 2,863.
With the next wave up expected to be a third wave at intermediate degree within a third wave at primary degree, look out for any surprises to be to the upside. Today there is a little underlying strength within the market supporting the view that the consolidation may be reasonably shallow.
The biggest picture, Grand Super Cycle analysis, is here.
Monthly charts were last published here, with video here. There are two further alternate monthly charts here, with video here.
ELLIOTT WAVE COUNTS
The first two Elliott wave counts below will be labelled First and Second. They may be about of even probability. When the fifth wave currently unfolding on weekly charts may be complete, then these two wave counts will diverge on the severity of the expected following bear market. To see an illustration of this future divergence monthly charts should be viewed.
FIRST WAVE COUNT
WEEKLY CHART
Click chart to enlarge.
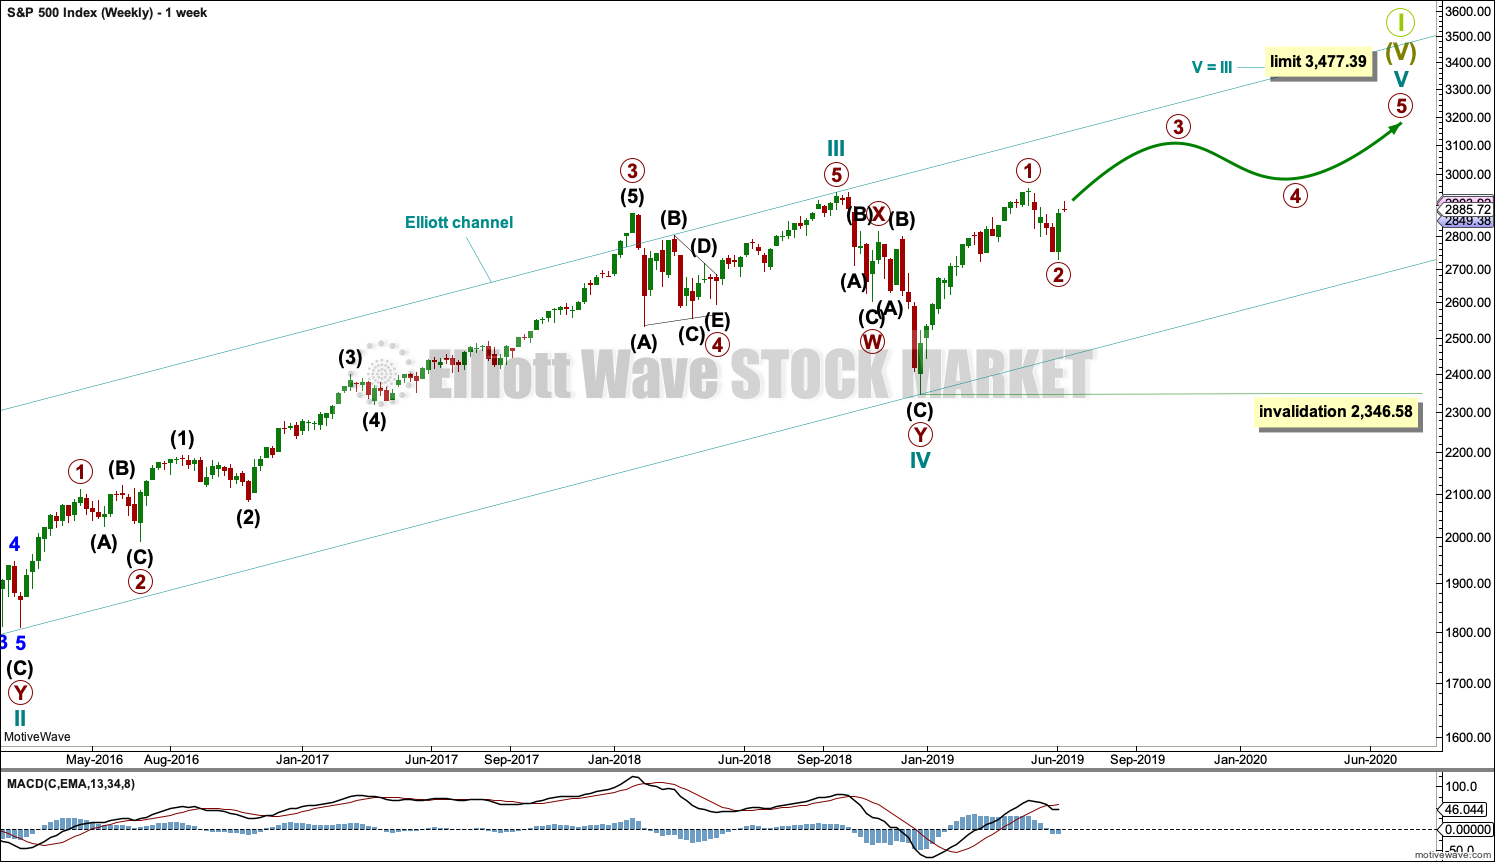
The basic Elliott wave structure consists of a five wave structure up followed by a three wave structure down (for a bull market). This wave count sees the bull market beginning in March 2009 as an incomplete five wave impulse and now within the last fifth wave, which is labelled cycle wave V. This impulse is best viewed on monthly charts. The weekly chart focusses on the end of it.
Elliott wave is fractal. This fifth wave labelled cycle wave V may end a larger fifth wave labelled Super Cycle wave (V), which may end a larger first wave labelled Grand Super Cycle wave I.
The teal Elliott channel is drawn using Elliott’s first technique about the impulse of Super Cycle wave (V). Draw the first trend line from the end of cycle wave I (off to the left of the chart, the weekly candlestick beginning 30th November 2014) to the end of cycle wave III, then place a parallel copy on the end of cycle wave II. This channel perfectly shows where cycle wave IV ended at support. The strongest portion of cycle wave III, the end of primary wave 3, overshoots the upper edge of the channel. This is a typical look for a third wave and suggests the channel is drawn correctly and the way the impulse is counted is correct.
Within Super Cycle wave (V), cycle wave III is shorter than cycle wave I. A core Elliott wave rule states that a third wave may never be the shortest. For this rule to be met in this instance, cycle wave V may not be longer in length than cycle wave III. This limit is at 3,477.39.
The structure of cycle wave V is focussed on at the daily chart level below.
Within cycle wave V, primary wave 2 may not move beyond the start of primary wave 1 below 2,346.58.
In historic analysis, two further monthly charts have been published that do not have a limit to upwards movement and are more bullish than this wave count. Members are encouraged to consider those possibilities (links below summary) alongside the wave counts presented on a daily and weekly basis.
DAILY CHART
Click chart to enlarge.
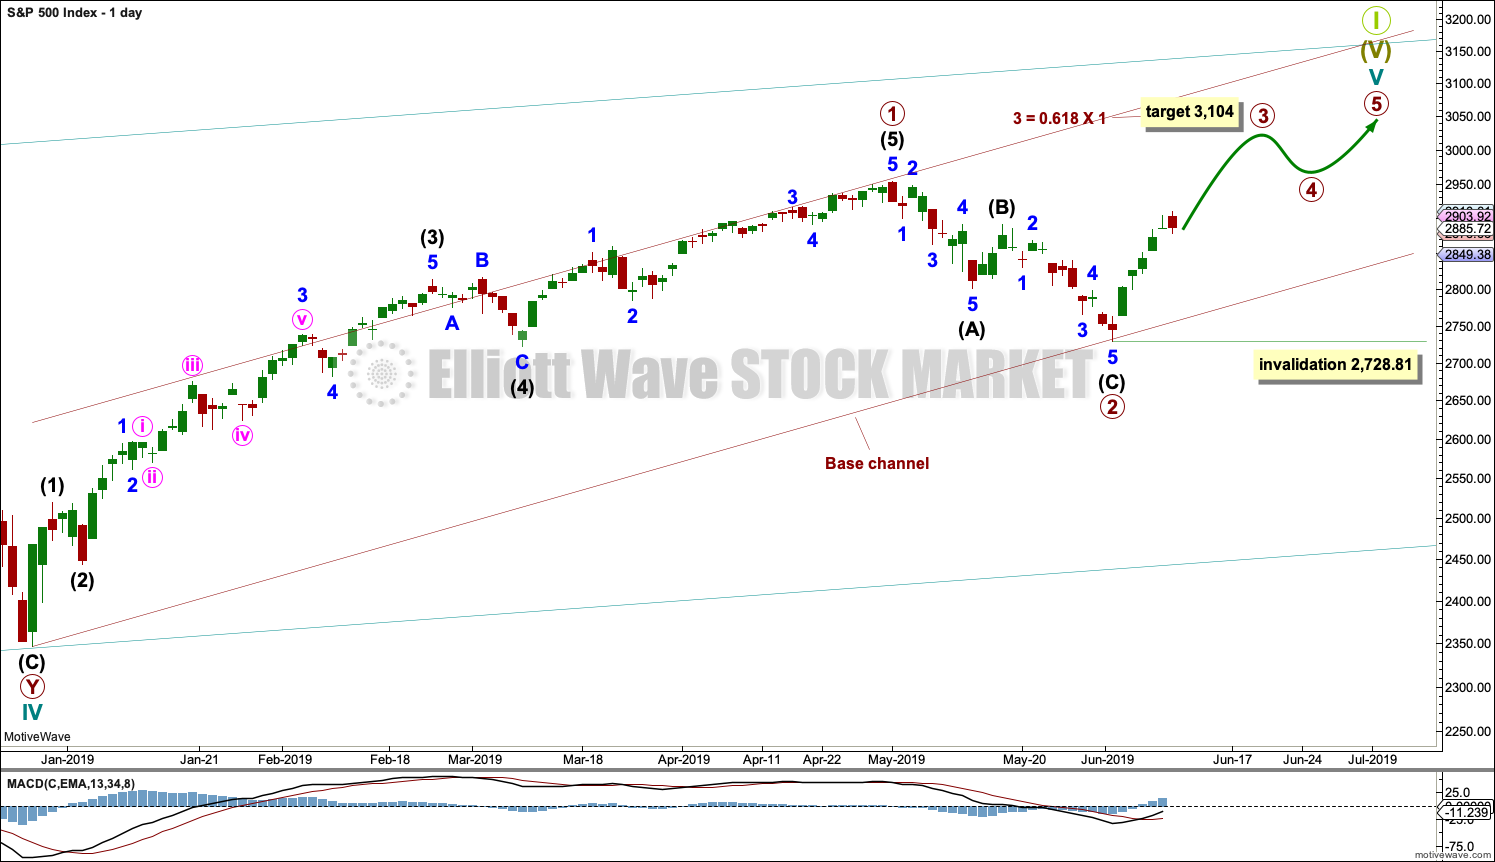
Cycle wave V must subdivide as a five wave motive structure. Within that five wave structure, primary waves 1 and 2 may be complete.
Primary wave 3 must move above the end of primary wave 1. Primary wave 3 may only subdivide as an impulse. Within the impulse, no second wave correction may move beyond the start of its first wave below 2,728.81.
When primary wave 3 is over, then primary wave 4 may be a shallow sideways consolidation that may not move into primary wave 1 price territory below 2,954.13.
Thereafter, primary wave 5 should move above the end of primary wave 3 to avoid a truncation.
A base channel is drawn about primary waves 1 and 2. The lower edge is drawn from the start of primary wave 1 to the end of primary wave 2, then a parallel copy is placed upon the high of primary wave 1. Along the way up, corrections within primary wave 3 may find support about the lower edge of the base channel. Primary wave 3 may have the power to break above the upper edge of the channel.
Primary wave 1 lasted 86 sessions, 3 short of a Fibonacci 89. Primary wave 2 lasted 22 sessions, 1 longer than a Fibonacci 21. Primary wave 3 may end about a Fibonacci 55 sessions, give or take two or three sessions either side. This is a rough guideline only.
So far primary wave 3 has lasted 6 sessions.
HOURLY CHART
Click chart to enlarge.
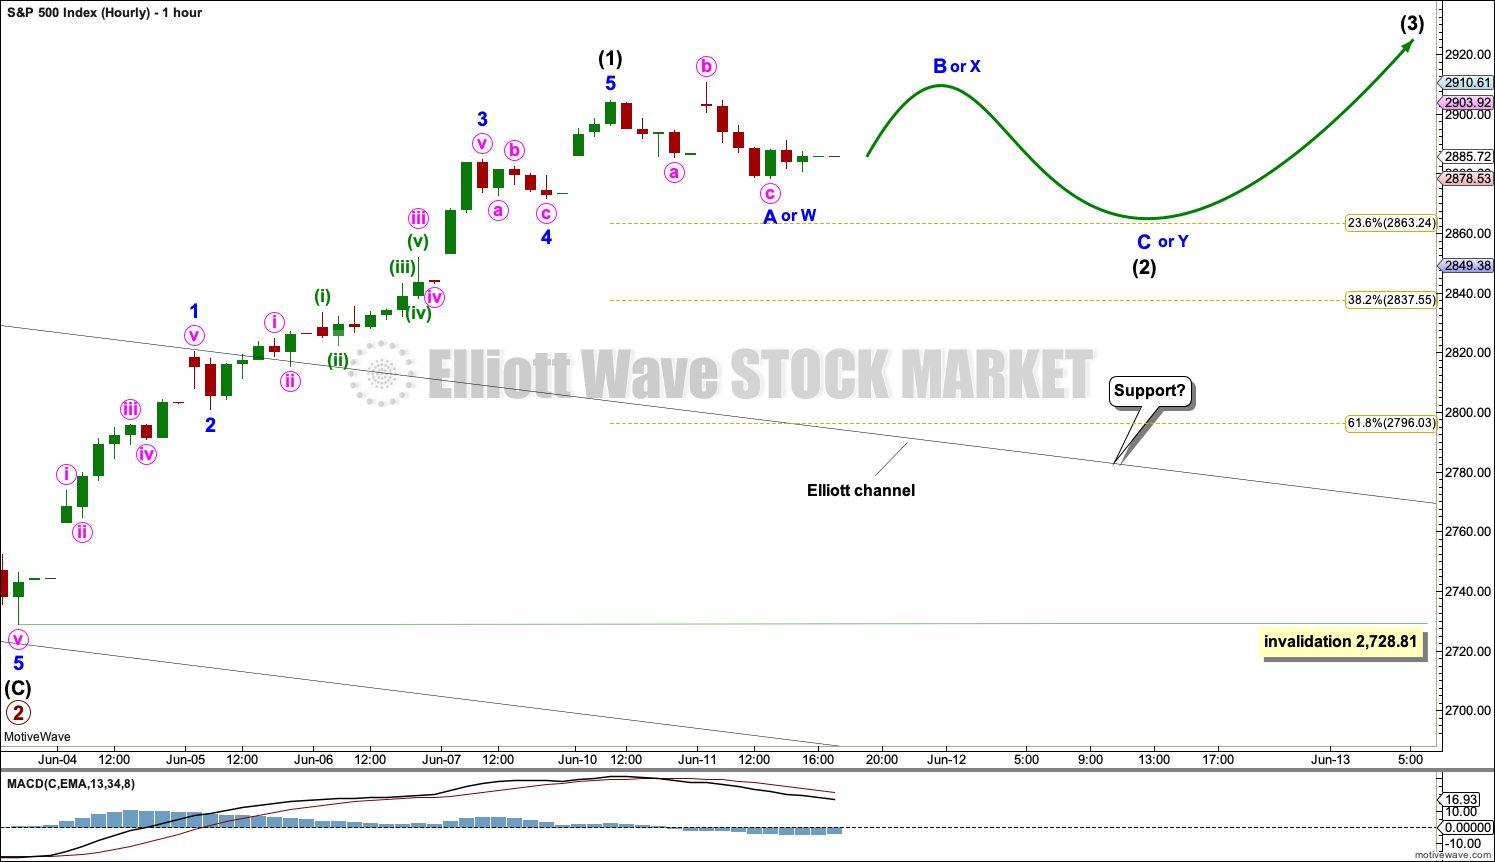
Following a five up, a three back should develop. This will be labelled intermediate wave (2).
Intermediate wave (2) may unfold as any corrective Elliott wave structure except a triangle. It may have begun with an expanded flat, which will be labelled minor wave A or W. This may be wave A within a larger flat correction, or wave W within a larger double combination or double flat.
Within all of a flat, combination or double flat, the next wave up would be labelled minor wave X and it may make a new high above the start of minor wave A or W at 2,954.13. X or B waves are characterised by weakness. If price moves higher tomorrow and exhibit weakness, that would fit this wave count. But if price moves higher and exhibits some reasonable strength, then it could be possible that intermediate wave (2) could be over at today’s low.
Due to the strong upwards pull of intermediate wave (3) within primary wave 3 just ahead, intermediate wave (2) may be forced to be relatively shallow. The 0.236 and 0.382 Fibonacci Ratios will be favoured targets. If intermediate wave (2) is deeper than this, then the lower edge of the black Elliott channel may provide final support for a back test.
While intermediate wave (2) is expected to be relatively brief and shallow, it would look too brief and shallow to label as complete at today’s low.
Intermediate wave (2) may not move beyond the start of intermediate wave (1) below 2,728.81.
SECOND WAVE COUNT
WEEKLY CHART
Click chart to enlarge.
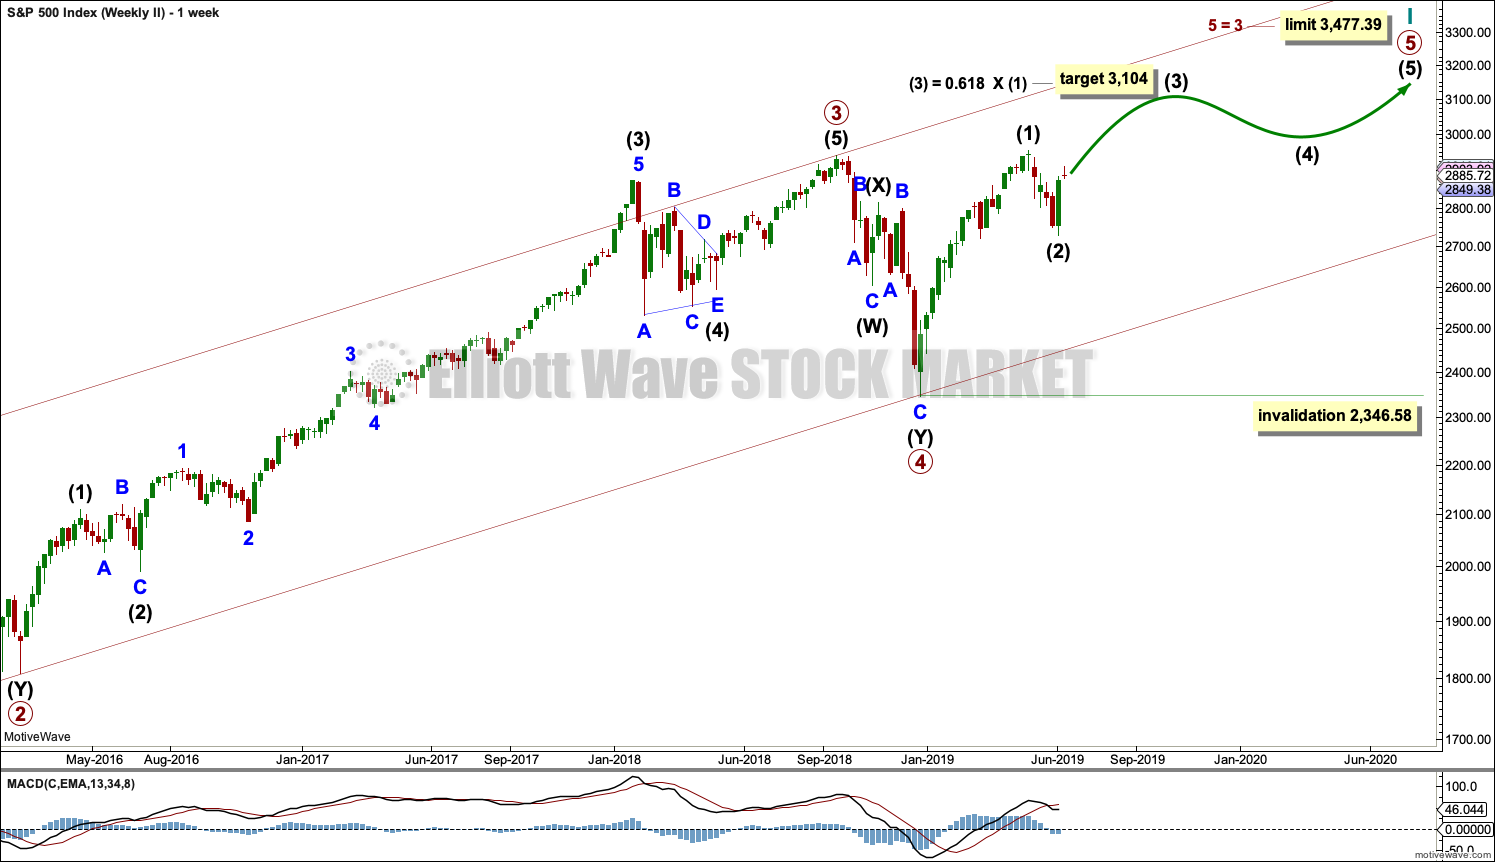
This weekly chart is almost identical to the first weekly chart, with the sole exception being the degree of labelling.
This weekly chart moves the degree of labelling for the impulse beginning in March 2009 all down one degree. This difference is best viewed on monthly charts.
The impulse is still viewed as nearing an end; a fifth wave is still seen as needing to complete higher. This wave count labels it primary wave 5.
TECHNICAL ANALYSIS
WEEKLY CHART
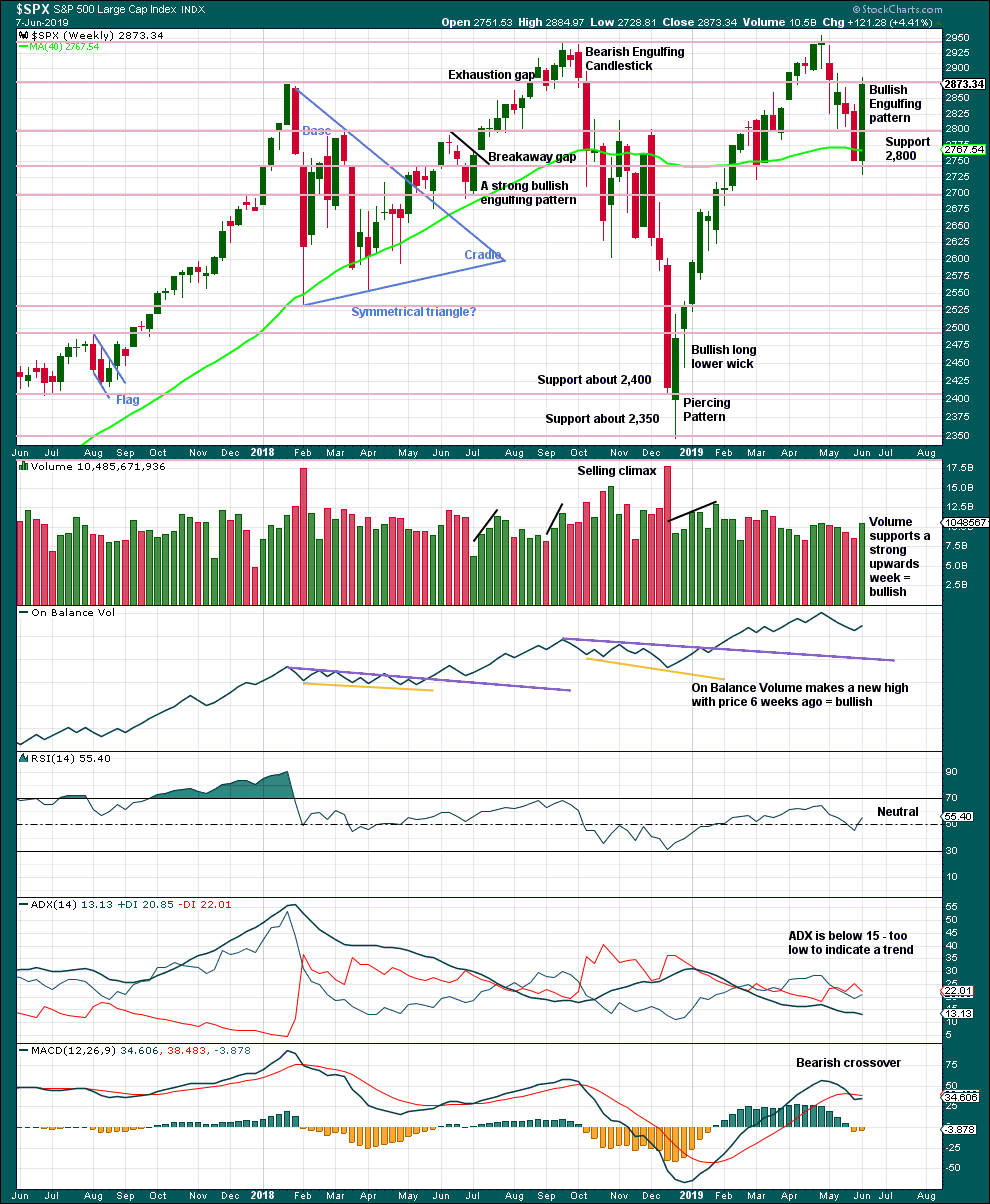
Click chart to enlarge. Chart courtesy of et=”_blank”>StockCharts.com.
Weight will be given in this analysis to the strong bullish reversal pattern, which has support from volume. This supports the main Elliott wave counts.
DAILY CHART
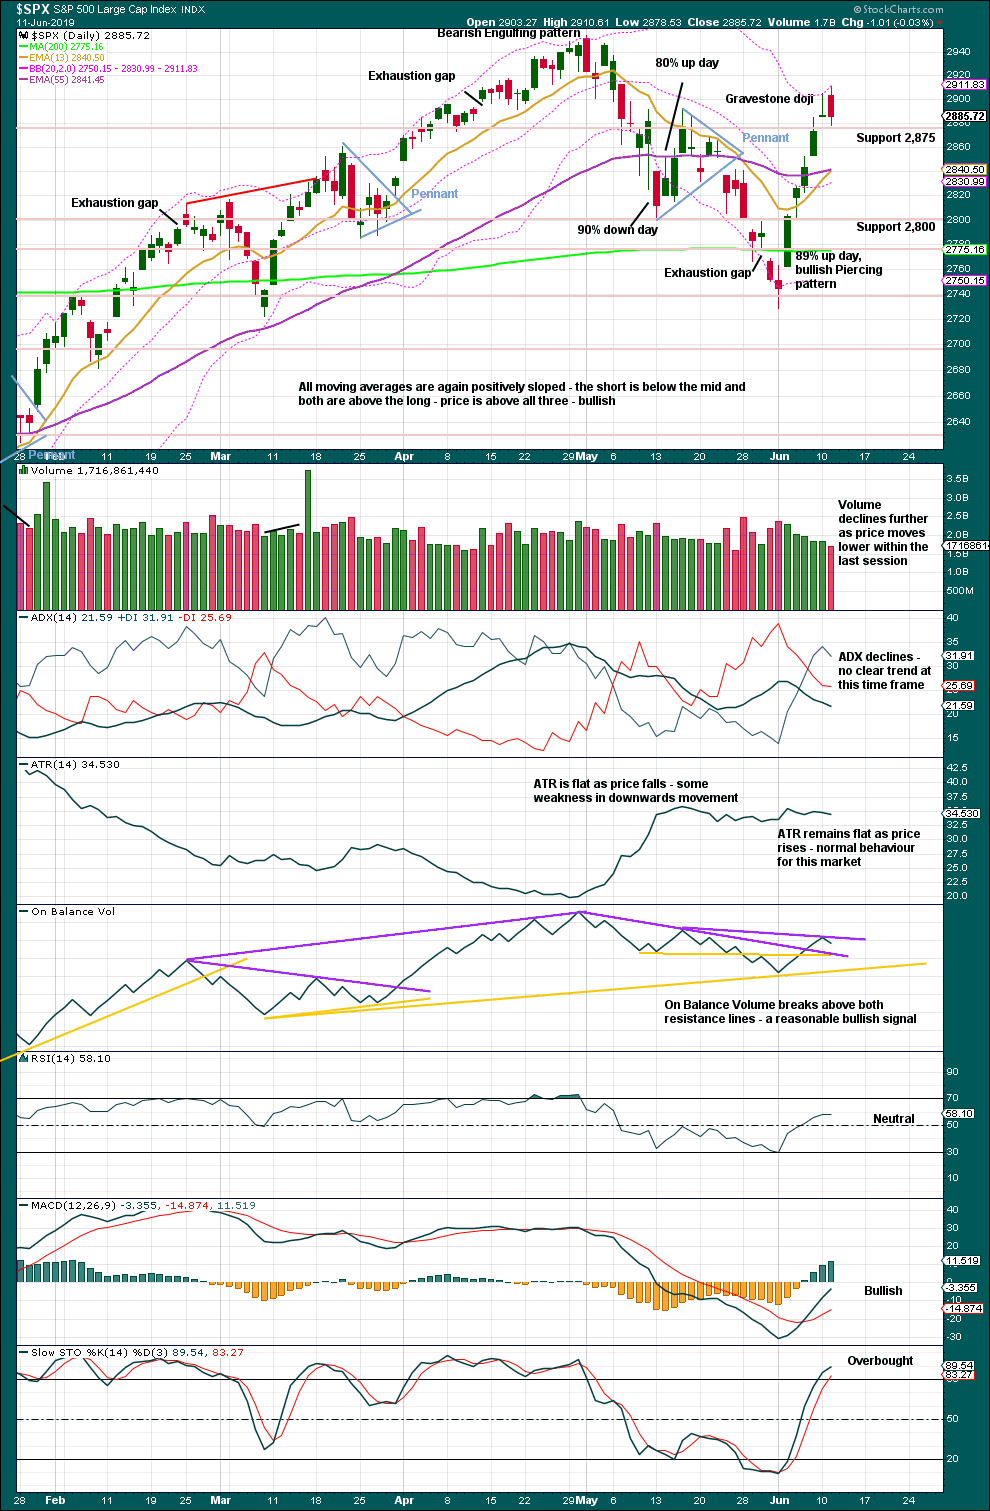
Click chart to enlarge. Chart courtesy of StockCharts.com.
Candlestick reversal patterns indicate an end to one trend and a change to a new trend. But there are three different directions for price: up, down or sideways. Candlestick reversal patterns make no comment on the direction of the next trend (full reversal or sideways) nor for how long the next trend may run. The Gravestone doji may be followed by a full 180 degree reversal and a new downwards trend, or it may be followed by some sideways consolidation.
Overall, this chart remains fairly bullish. While the larger trend is up, it would be wisest to assume that downwards movement at this time frame is most likely a counter trend movement and presents an opportunity.
Today there was some underlying strength with Lowry’s Buying Power rising 2 points.
BREADTH – AD LINE
WEEKLY CHART
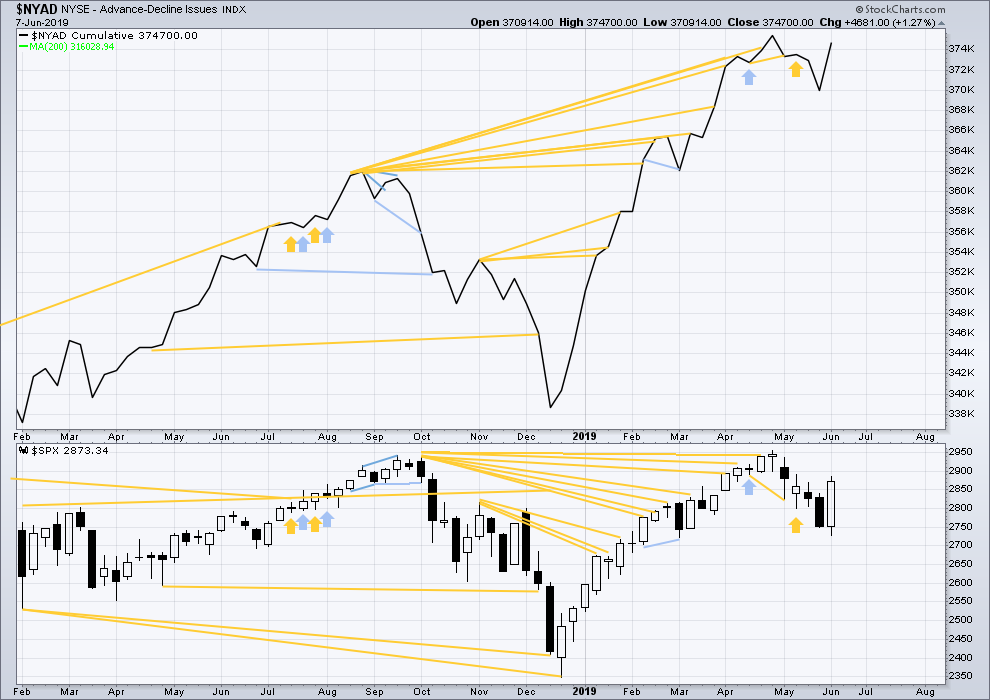
Click chart to enlarge. Chart courtesy of StockCharts.com. So that colour blind members are included, bearish signals
will be noted with blue and bullish signals with yellow.
Bear markets from the Great Depression and onwards have been preceded by an average minimum of 4 months divergence between price and the AD line with only two exceptions in 1946 and 1976. With the AD line making a new all time high on the 3rd of May, the end of this bull market and the start of a new bear market is very likely a minimum of 4 months away, which is the beginning of September 2019.
In all bear markets in the last 90 years there is some positive correlation (0.6022) between the length of bearish divergence and the depth of the following bear market. No to little divergence is correlated with more shallow bear markets. Longer divergence is correlated with deeper bear markets.
If a bear market does develop here, it comes after no bearish divergence. It would therefore more likely be shallow. The alternate Elliott wave count outlines this potential scenario.
Price has moved higher last week. Upwards movement has normal support from rising breadth. There is no divergence.
All of small mid and large caps are moving higher. Large caps are strongest; this is normal for the later stages of a bull market.
DAILY CHART
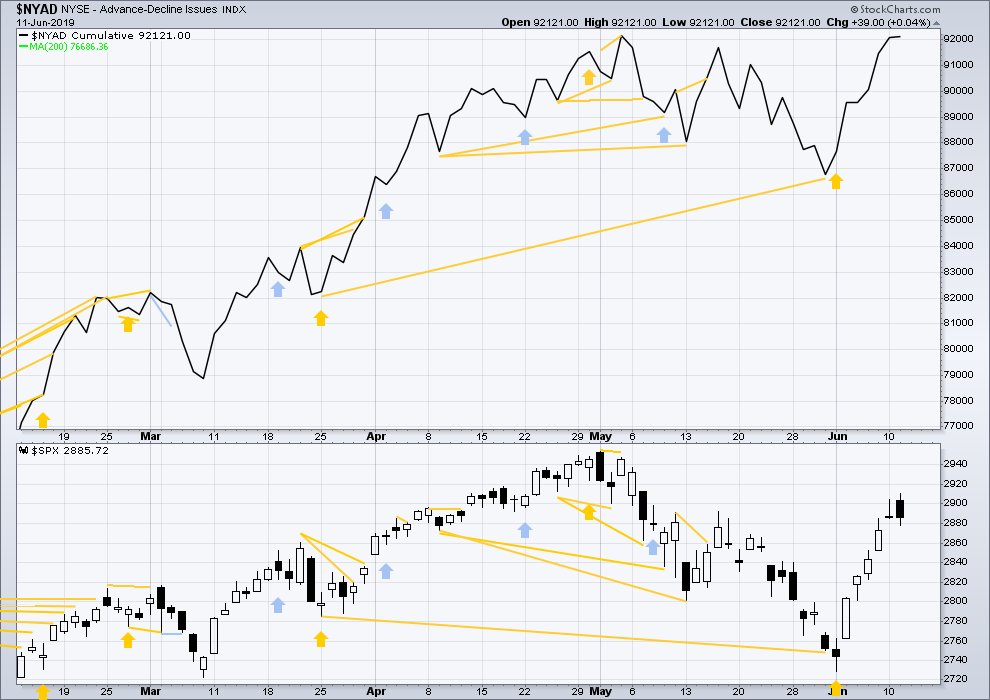
Click chart to enlarge. Chart courtesy of StockCharts.com. So that colour blind members are included, bearish signals
will be noted with blue and bullish signals with yellow.
Breadth should be read as a leading indicator.
Today both price and the AD line moved mostly sideways. There is no new divergence, but the AD line is extremely close here to a new all time high while price has a greater distance to go. Breadth is rising faster than price, which is bullish.
VOLATILITY – INVERTED VIX CHART
WEEKLY CHART
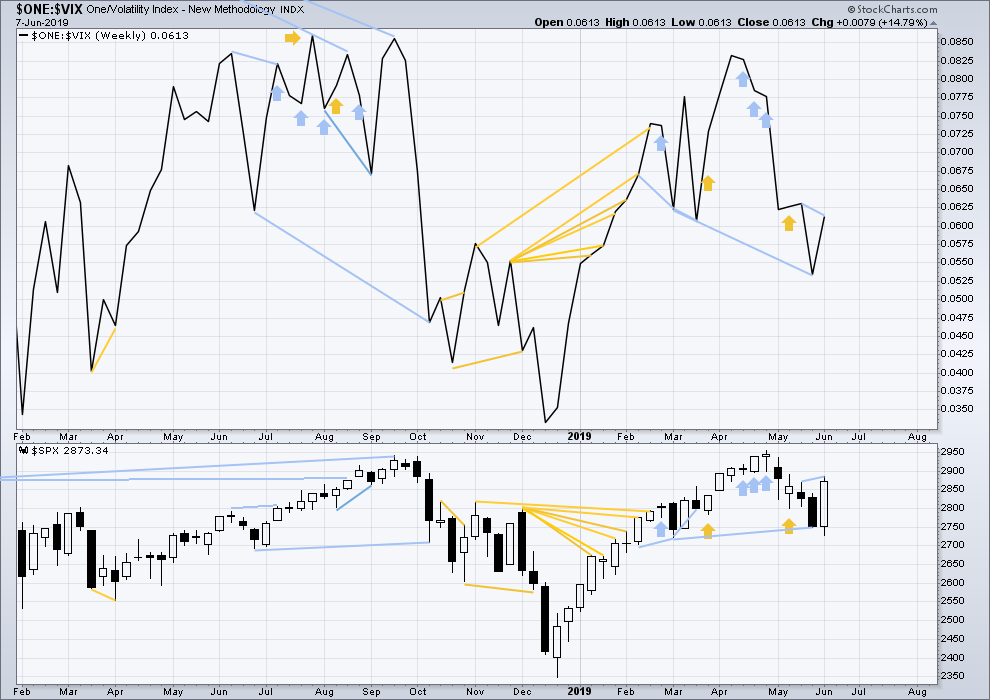
Click chart to enlarge. Chart courtesy of StockCharts.com. So that colour blind members are included, bearish signals
will be noted with blue and bullish signals with yellow.
Inverted VIX has made a new low below the low of the 4th of March, but price has not. Downwards movement comes with a strong increase in VIX, which is increasing faster than price. This divergence is bearish, but will not be given much weight in this analysis at this time.
Last week price has made a new high above the high of two weeks ago, but inverted VIX has not. Price is rising faster than VIX is falling. This divergence is bearish for the short term.
DAILY CHART
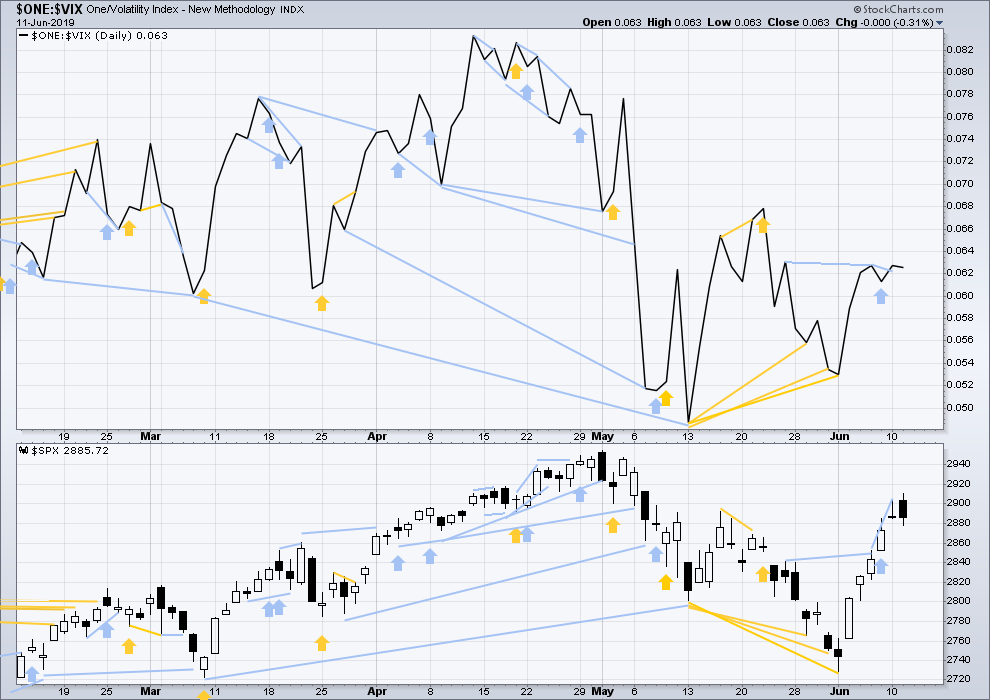
Click chart to enlarge. Chart courtesy of StockCharts.com. So that colour blind members are included, bearish signals
will be noted with blue and bullish signals with yellow.
Price has moved higher for Friday, but inverted VIX has moved lower. Upwards movement in price does not come with a normal corresponding decline in VIX. VIX has increased for the session. This divergence is bearish.
Bearish divergence noted in last analysis remains and may still be followed by some downwards movement.
Today both price and inverted VIX have essentially moved sideways. There is no new divergence today.
DOW THEORY
Dow Theory confirmed a bear market in December 2018. This does not necessarily mean a bear market at Grand Super Cycle degree though; Dow Theory makes no comment on Elliott wave counts. On the 25th of August 2015 Dow Theory also confirmed a bear market. The Elliott wave count sees that as part of cycle wave II. After Dow Theory confirmation of a bear market in August 2015, price went on to make new all time highs and the bull market continued.
DJIA: 23,344.52 – a close on the 19th of December at 23,284.97 confirms a bear market.
DJT: 9,806.79 – price has closed below this point on the 13th of December.
S&P500: 2,532.69 – a close on the 19th of December at 2,506.96 provides support to a bear market conclusion.
Nasdaq: 6,630.67 – a close on the 19th of December at 6,618.86 provides support to a bear market conclusion.
With all the indices having moved higher following a Dow Theory bear market confirmation, Dow Theory would confirm a bull market if the following highs are made:
DJIA: 26,951.81
DJT: 11,623.58
S&P500: 2,940.91 – a new all time high has been made on the 29th of April 2019.
Nasdaq: 8,133.30 – a new high has been made on 24th of April 2019.
Published @ 07:31 p.m. EST.
—
Careful risk management protects your trading account(s).
Follow my two Golden Rules:
1. Always trade with stops.
2. Risk only 1-5% of equity on any one trade.
—
New updates to this analysis are in bold.
Sorry everybody that I wasn’t here today in time for a just before session close update, but of all the days to miss this was a good one.
A very quiet session indeed!
Is it possible that Primary 1 is not finished yet & this move down is just minor 4 & minor 5 takes us to 2923 before a Primary 2??
Proportionality is off with that but perhaps it’s possible?
I wouldn’t publish such a wave count. It has all the wrong look.
Thanks Kevin & Lara
Transports are up. Gonna take a bite north with some spy calls. Using last hours Doji low as an hourly stop.
Next stop Boise ….. and hopefully spy 290
Are you cutting across the state from Bend to Boise? Or, are you going north the Columbia River and taking I-84?
Bend to Boise mostly all desert and lonely land.
Columbia River Gorge is a National Scenic section. Then you pass by my house just a few miles away and turn SW to Boise, all on Interstate. You’ll have several mountain ranges to cross and plenty of desert too.
Have Fun. It already sounds like you are doing so.
The gorge route is beautiful- especially in spring
Anybody watching the fireworks in BYND? Wowza zowza. From 186 high Monday to yesterday’s ow of 126 and now back up to 143 and rising. Weekly volatility on finviz reads 16% (roughly the ATR %). But as I read it the rise here is a B wave and we all know what to do with those. Watching for a C down perhaps to just above 100 where it took off from a few days ago. And maybe I’ll consider trading it (appropriately sized DOWN!).
Interesting that the RUT is the least weak of the 4 primary US avgs (SPX, NDX, DJX, RUT). Some have been calling for a much deeper sell off here in the RUT. I can see why (the daily is cycling down), but the overall “weakness in the weakness” in both RUT and SPX gives me reason to ponder. The strength of the buying pressure at the higher time frames seems to be giving this correction “support”, just as Lara suggested might be the case. So far.
Now if only twitter could stay silent for a few weeks to allow the tide to come in and lift some boats…(sigh).
Quite astute Kevin. Lara wrote in last evening’s analysis:
—————————————————————
Today there was some underlying strength with Lowry’s Buying Power rising 2 points.
————————————————————–
Lowry’s deals with relatively longer time frames. I think they begin at daily and work up. But what you called “weakness in the weakness” is indicative of the buying power support. We have seen a big change in the psychological atmosphere of the US equity markets starting in January and still evident today. institutions, pensions etc. and individual accounts especially of baby boomers are in no mind to sell. In addition, the Baby Boomers I know are still net investing in their IRA’s etc. Money flow is inwards. That is what OBV attempts to indicate.
All in all, expect surprises to be bullish. Unfortunately, Twitter is here to stay, relentlessly.
BTW – The doc says I am fit as a fiddle and good to go! Good health is a blessing. Once I get my second shoulder replaced, I’ll be good for another 100 thousand miles.
Nice. Now go chase away the bears, Rodney!
AXSM is just about breaking it’s down trend line at the 5 minute time frame, a down trend line that shows up at the daily and weekly tf’s. I actually just took profit, I bought yesterday. But I will reload on the first pullback on the hourly. And if you want to position trade…might be a good time, depending on your preferred entry rules. This stock went from 5 to 26 Dec-May, and is now at 21.7. And very likely going up.
I finally got #1 as I sit here at home early drinking my colonoscopy prep drink. Hey, think happy thoughts Rodney. It all works out in the end.
Like a mighty river…
My short reign is over. Long live King Rodney!
Good luck with Mr. Golightly!