
The week has ended strongly. A low was called tentatively on the 3rd of June, and the first confidence point at 2,799 was passed on the next day. Thereafter, price has continued higher this week as expected.
Summary: The low of December 2018 is expected to most likely remain intact.
The pullback may have ended. A new target for a third wave up is at 3,104.
The alternate wave count considers the possibility that a relatively short lived bear market may have begun. The target is at 2,080. This wave count has a fairly low probability, but it is a possibility that must be acknowledged. This possibility may now be discarded with a new high above 2,892.15.
The biggest picture, Grand Super Cycle analysis, is here.
Monthly charts were last published here, with video here. There are two further alternate monthly charts here, with video here.
ELLIOTT WAVE COUNTS
The first two Elliott wave counts below will be labelled First and Second. They may be about of even probability. When the fifth wave currently unfolding on weekly charts may be complete, then these two wave counts will diverge on the severity of the expected following bear market. To see an illustration of this future divergence monthly charts should be viewed.
The alternate Elliott wave count has a very low probability.
FIRST WAVE COUNT
WEEKLY CHART
Click chart to enlarge.
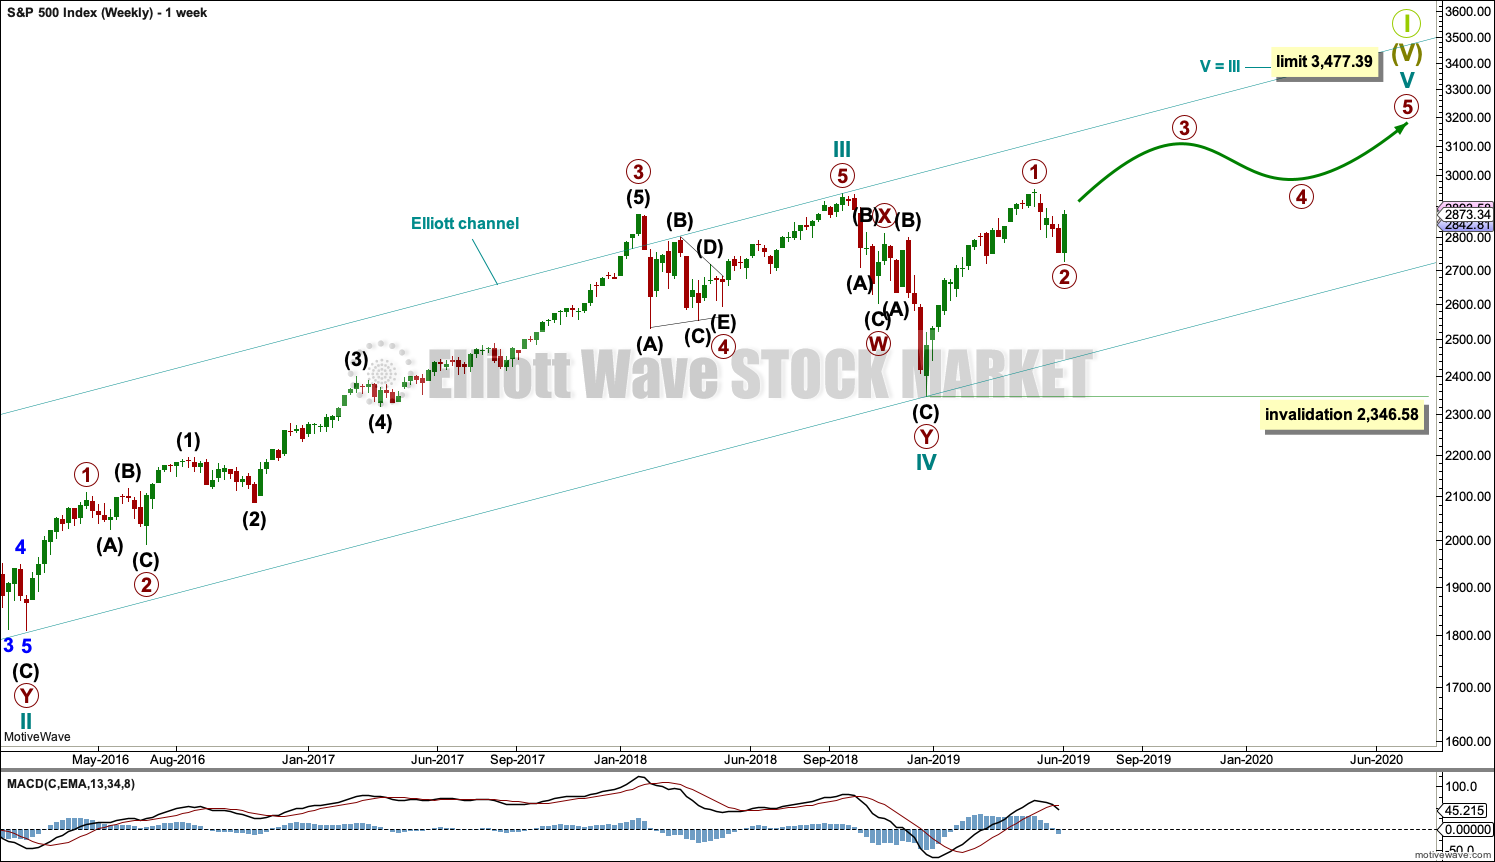
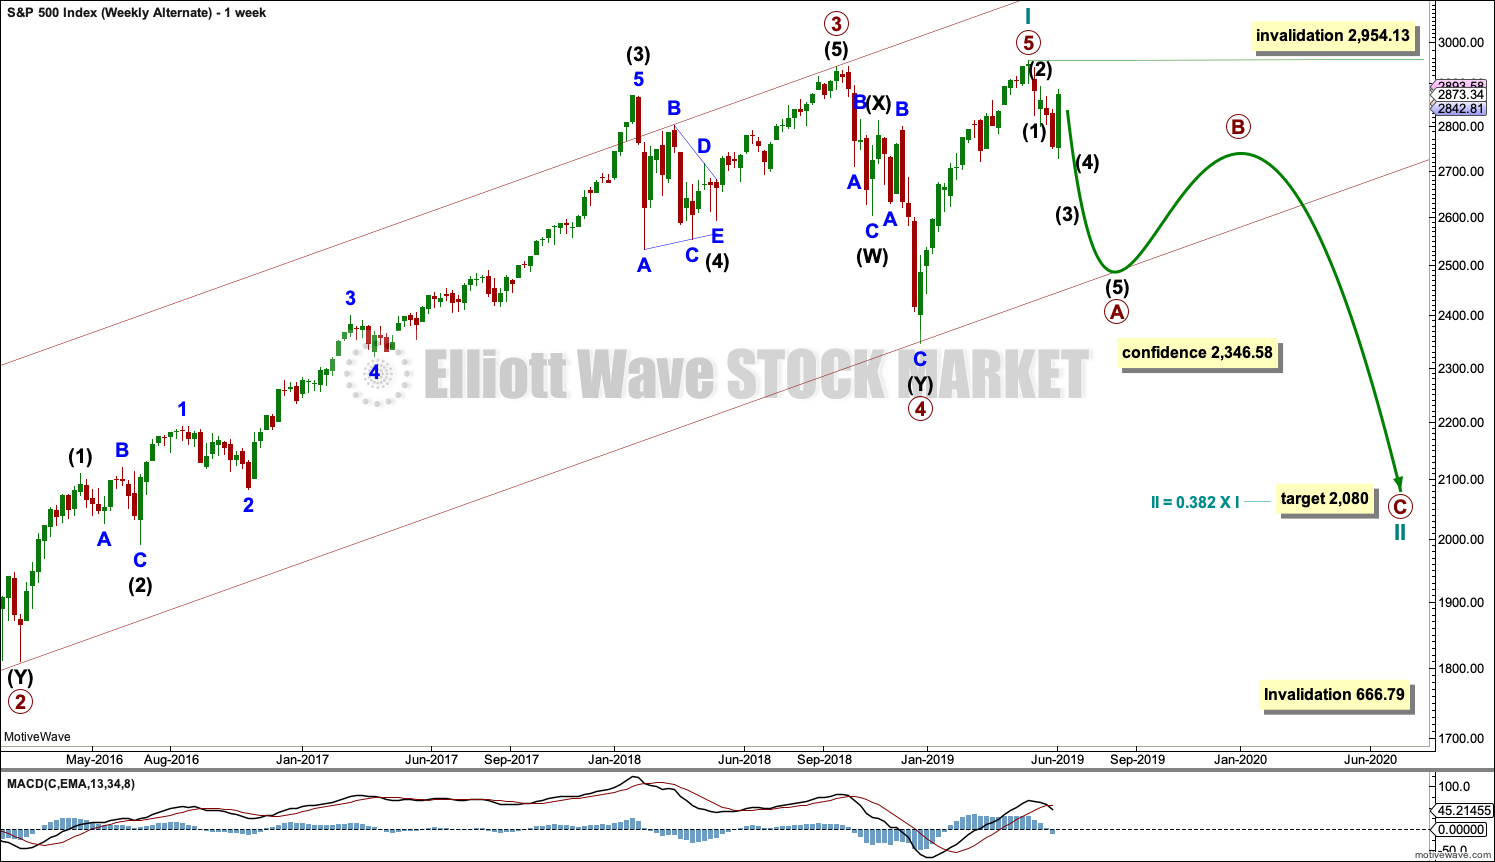
The basic Elliott wave structure consists of a five wave structure up followed by a three wave structure down (for a bull market). This wave count sees the bull market beginning in March 2009 as an incomplete five wave impulse and now within the last fifth wave, which is labelled cycle wave V. This impulse is best viewed on monthly charts. The weekly chart focusses on the end of it.
Elliott wave is fractal. This fifth wave labelled cycle wave V may end a larger fifth wave labelled Super Cycle wave (V), which may end a larger first wave labelled Grand Super Cycle wave I.
The teal Elliott channel is drawn using Elliott’s first technique about the impulse of Super Cycle wave (V). Draw the first trend line from the end of cycle wave I (off to the left of the chart, the weekly candlestick beginning 30th November 2014) to the end of cycle wave III, then place a parallel copy on the end of cycle wave II. This channel perfectly shows where cycle wave IV ended at support. The strongest portion of cycle wave III, the end of primary wave 3, overshoots the upper edge of the channel. This is a typical look for a third wave and suggests the channel is drawn correctly and the way the impulse is counted is correct.
Within Super Cycle wave (V), cycle wave III is shorter than cycle wave I. A core Elliott wave rule states that a third wave may never be the shortest. For this rule to be met in this instance, cycle wave V may not be longer in length than cycle wave III. This limit is at 3,477.39.
The structure of cycle wave V is focussed on at the daily chart level below.
Within cycle wave V, primary wave 2 may not move beyond the start of primary wave 1 below 2,346.58.
In historic analysis, two further monthly charts have been published that do not have a limit to upwards movement and are more bullish than this wave count. Members are encouraged to consider those possibilities (links below summary) alongside the wave counts presented on a daily and weekly basis.
DAILY CHART
Click chart to enlarge.
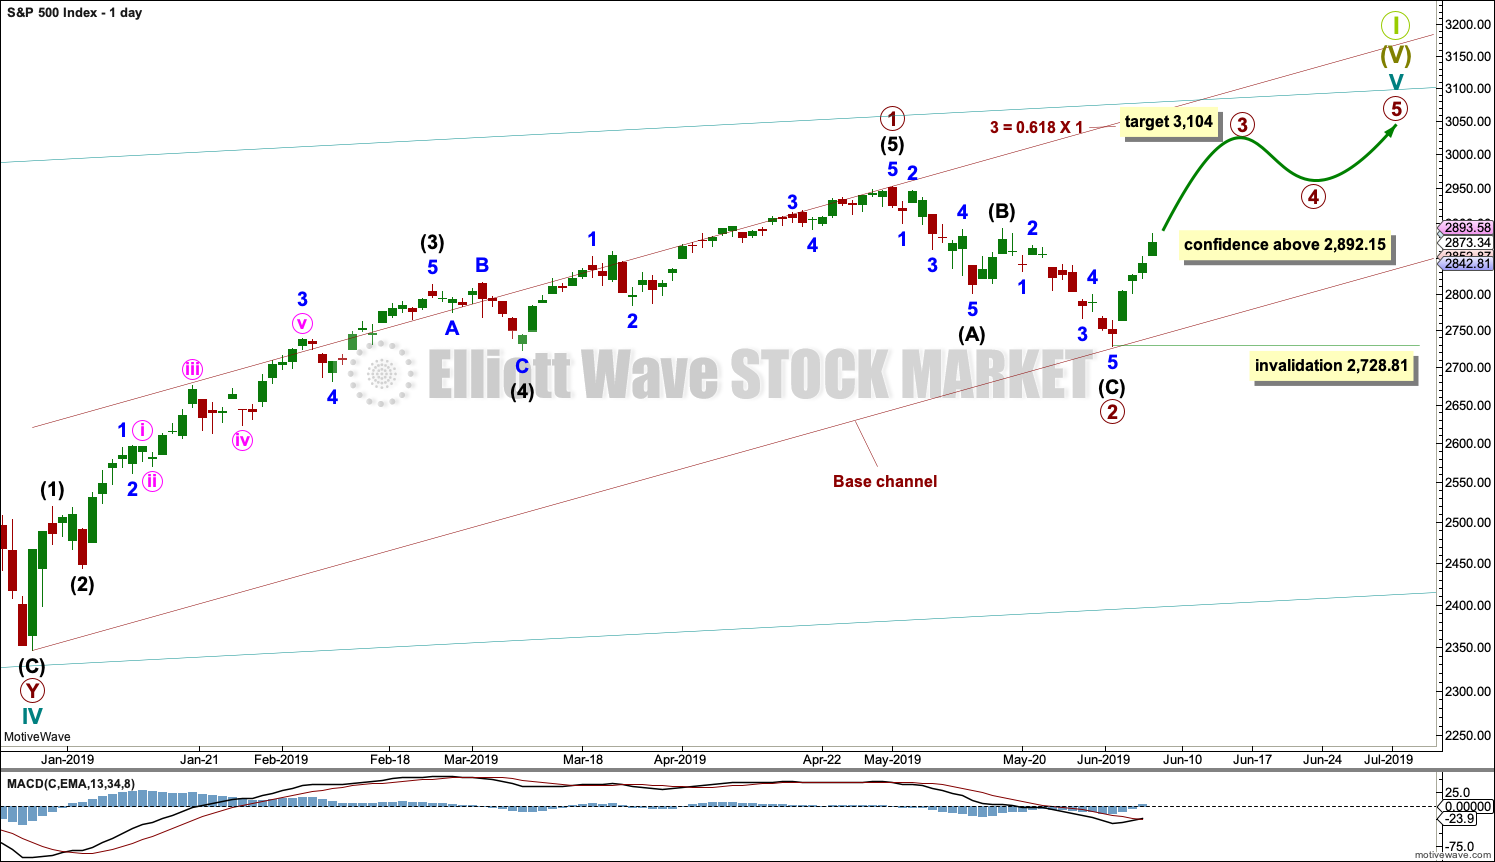
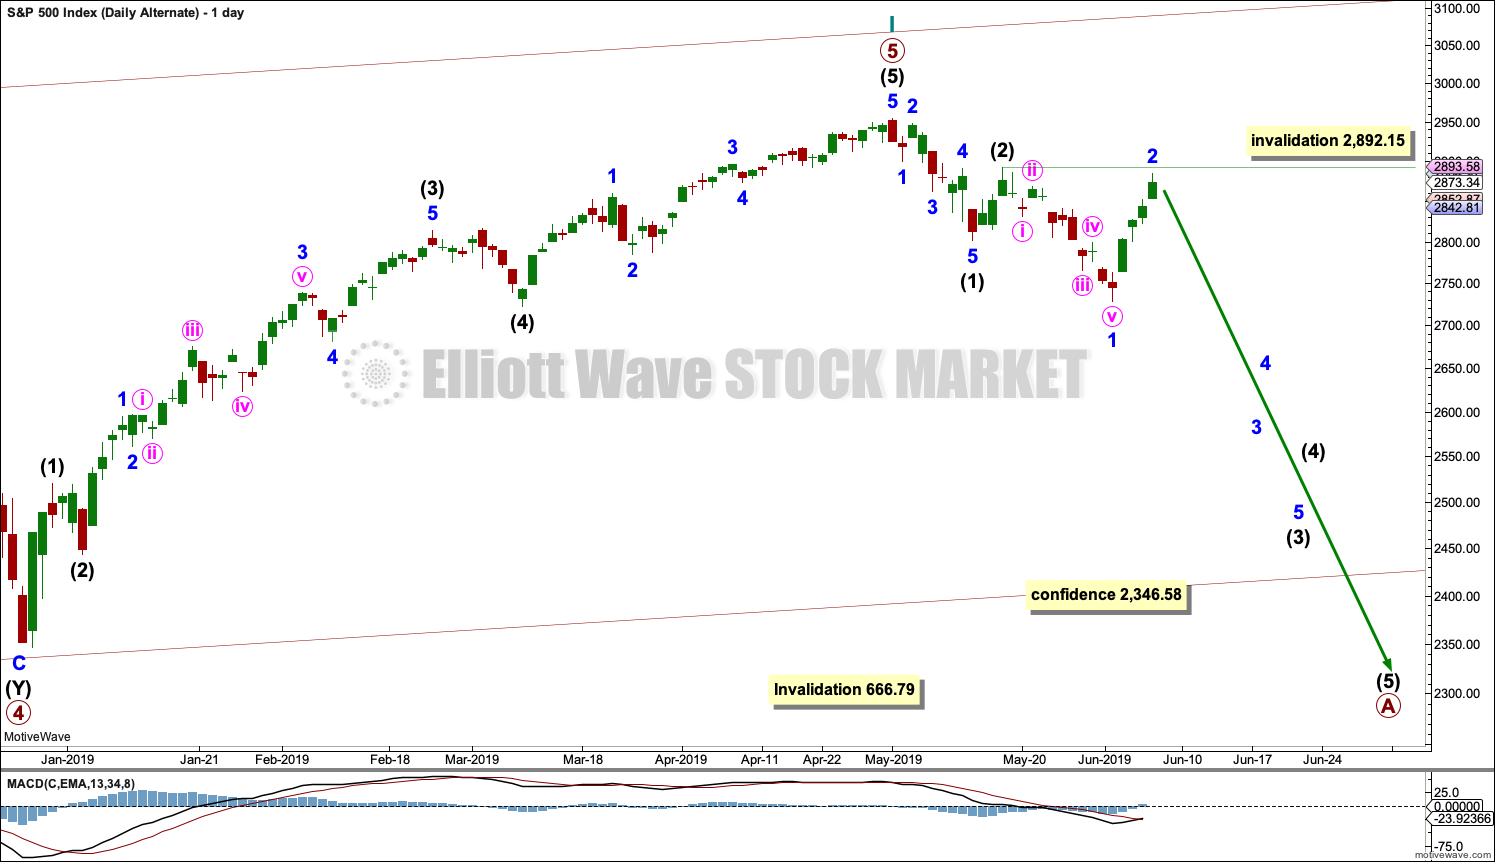
Cycle wave V must subdivide as a five wave motive structure. Within that five wave structure, primary waves 1 and 2 may be complete.
Primary wave 3 must move above the end of primary wave 1. Primary wave 3 may only subdivide as an impulse. Within the impulse, no second wave correction may move beyond the start of its first wave below 2,728.81.
When primary wave 3 is over, then primary wave 4 may be a shallow sideways consolidation that may not move into primary wave 1 price territory below 2,954.13.
Thereafter, primary wave 5 should move above the end of primary wave 3 to avoid a truncation.
A base channel is drawn about primary waves 1 and 2. The lower edge is drawn from the start of primary wave 1 to the end of primary wave 2, then a parallel copy is placed upon the high of primary wave 1. Along the way up, corrections within primary wave 3 may find support about the lower edge of the base channel. Primary wave 3 may have the power to break above the upper edge of the channel.
At this stage, a new high above 2,892.15 would invalidate the alternate wave count below and offer some confidence to this wave count.
HOURLY CHART
Click chart to enlarge.
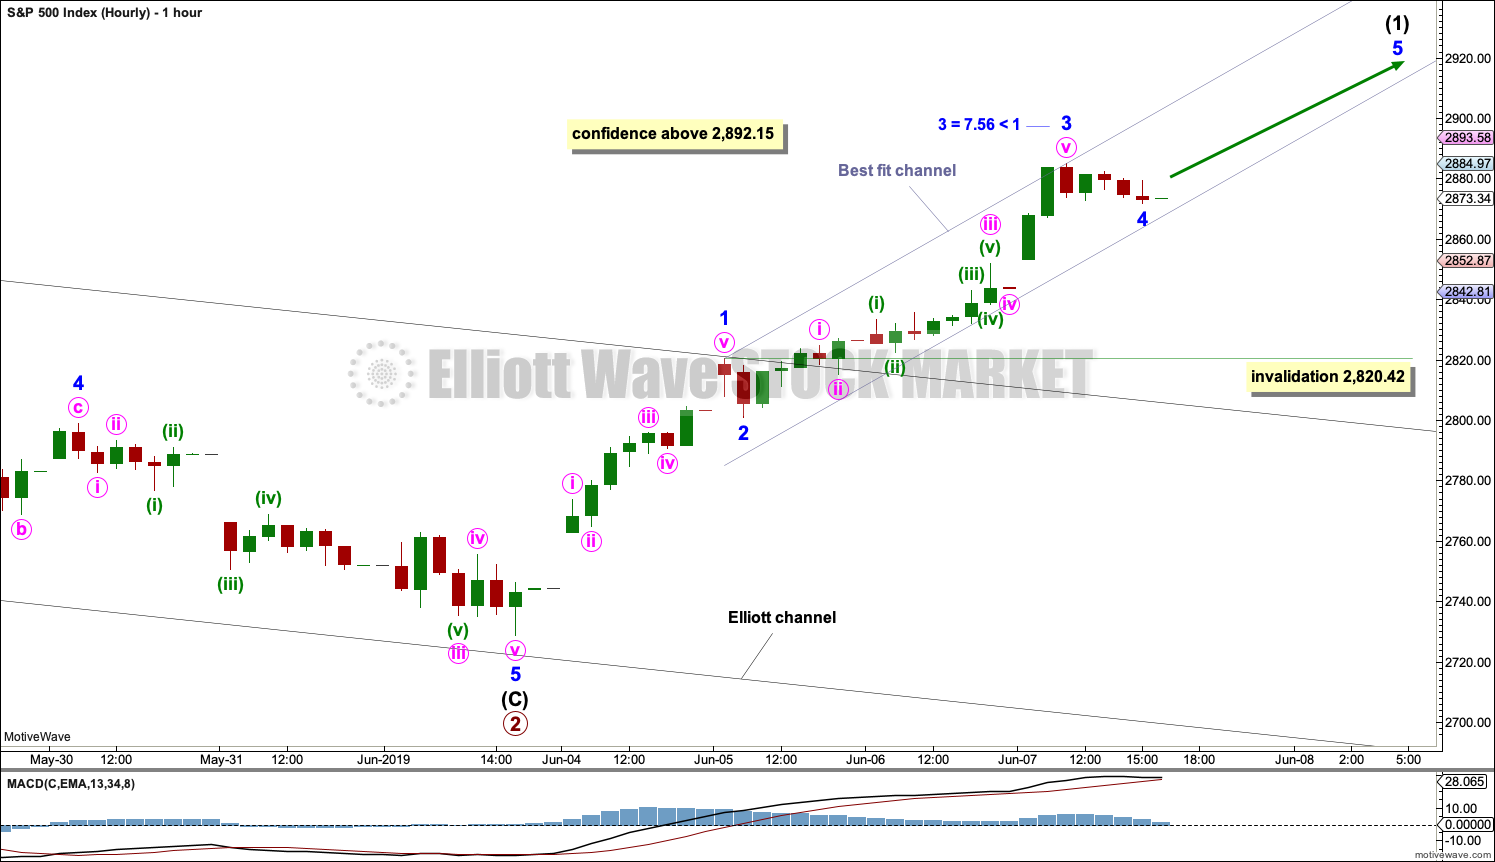
Further confidence that a low is in place would come with a new high above 2,892.15 and invalidation of the bearish alternate Elliott wave count below.
Primary wave 3 is expected to be shorter in length and time to primary wave 1. Primary wave 1 lasted 86 sessions, 3 short of a Fibonacci 89. Primary wave 3 may be 0.382 this duration at about a Fibonacci 34 sessions; so far, it has lasted 4. This is a very rough guideline only.
Primary wave 3 may appear to be condensed because it is expected to be shorter in length and time than primary wave 1. Corrections within primary wave 3 may also be quicker, and for this reason minor waves 1 and 2 are labelled complete. The first reasonable sized pullback within primary wave 3 may not appear until intermediate wave (1) is complete and intermediate wave (2) arrives.
Intermediate wave (1) may be close to completion. Within intermediate wave (1), minor waves 1 through to 3 may be complete; with this labelling, minor wave 3 is shorter than minor wave 1. This limits minor wave 5 to no longer than equality with minor wave 3 at 84.05 points, so that minor wave 3 is not the shortest actionary wave and the core Elliott wave rule is met.
This labelling of minor wave 3 as over at today’s high fits with MACD. Minor wave 3 exhibits strongest momentum.
A best fit channel is drawn about more recent upwards movement. This channel may show where smaller pullbacks find support.
SECOND WAVE COUNT
WEEKLY CHART
Click chart to enlarge.
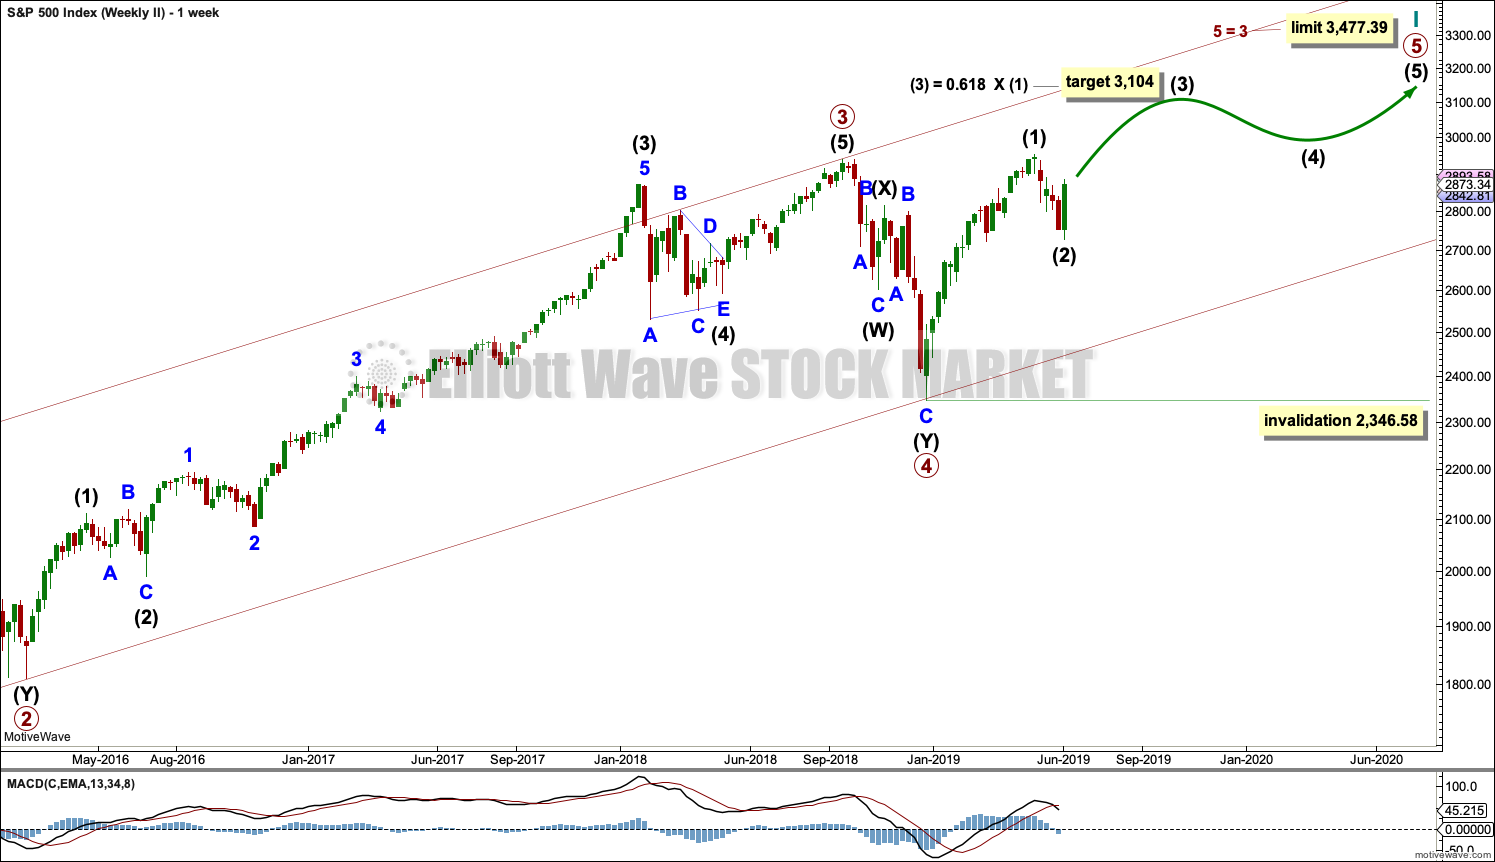
This weekly chart is almost identical to the first weekly chart, with the sole exception being the degree of labelling.
This weekly chart moves the degree of labelling for the impulse beginning in March 2009 all down one degree. This difference is best viewed on monthly charts.
The impulse is still viewed as nearing an end; a fifth wave is still seen as needing to complete higher. This wave count labels it primary wave 5.
ALTERNATE WAVE COUNT
WEEKLY CHART
Click chart to enlarge.
It is possible that for the second wave count cycle wave I could be complete. Primary wave 5 may be seen as a complete five wave impulse on the daily chart.
If cycle wave I is complete, then cycle wave II may meet the definition of a bear market with a 20% drop in price at its end.
Within cycle wave I, primary wave 1 was a very long extension and primary wave 3 was shorter than primary wave 1 and primary wave 5 was shorter than primary wave 3. Because primary wave 1 was a long extension cycle wave II may end within the price range of primary wave 2, which was from 2,132 to 1,810. The 0.382 retracement of cycle wave I is within this range.
Cycle wave II may not move beyond the start of cycle wave I below 666.79.
This wave count does not have support at this time from classic technical analysis.
DAILY CHART
Click chart to enlarge.
The most likely structure for cycle wave II would be a zigzag. Within a zigzag, primary wave A would subdivide as a five wave structure, most likely an impulse. Within the impulse of primary wave A, so far intermediate waves (1) and (2) may be complete and intermediate wave (3) has moved below the end of intermediate wave (1) and may be incomplete.
Intermediate wave (3) would reach 1.618 the length of intermediate wave (1) at 2,645.
Intermediate wave (3) may only subdivide as an impulse. Within the impulse, minor wave 1 may be complete. Minor wave 2 may not move beyond the start of minor wave 1 above 2,892.15. At this stage, a new high above this point would see this alternate wave count discarded. This week the size of minor wave 2 gives this wave count the wrong look.
Within the zigzag, primary wave B may not move beyond the start of primary wave A.
TECHNICAL ANALYSIS
WEEKLY CHART
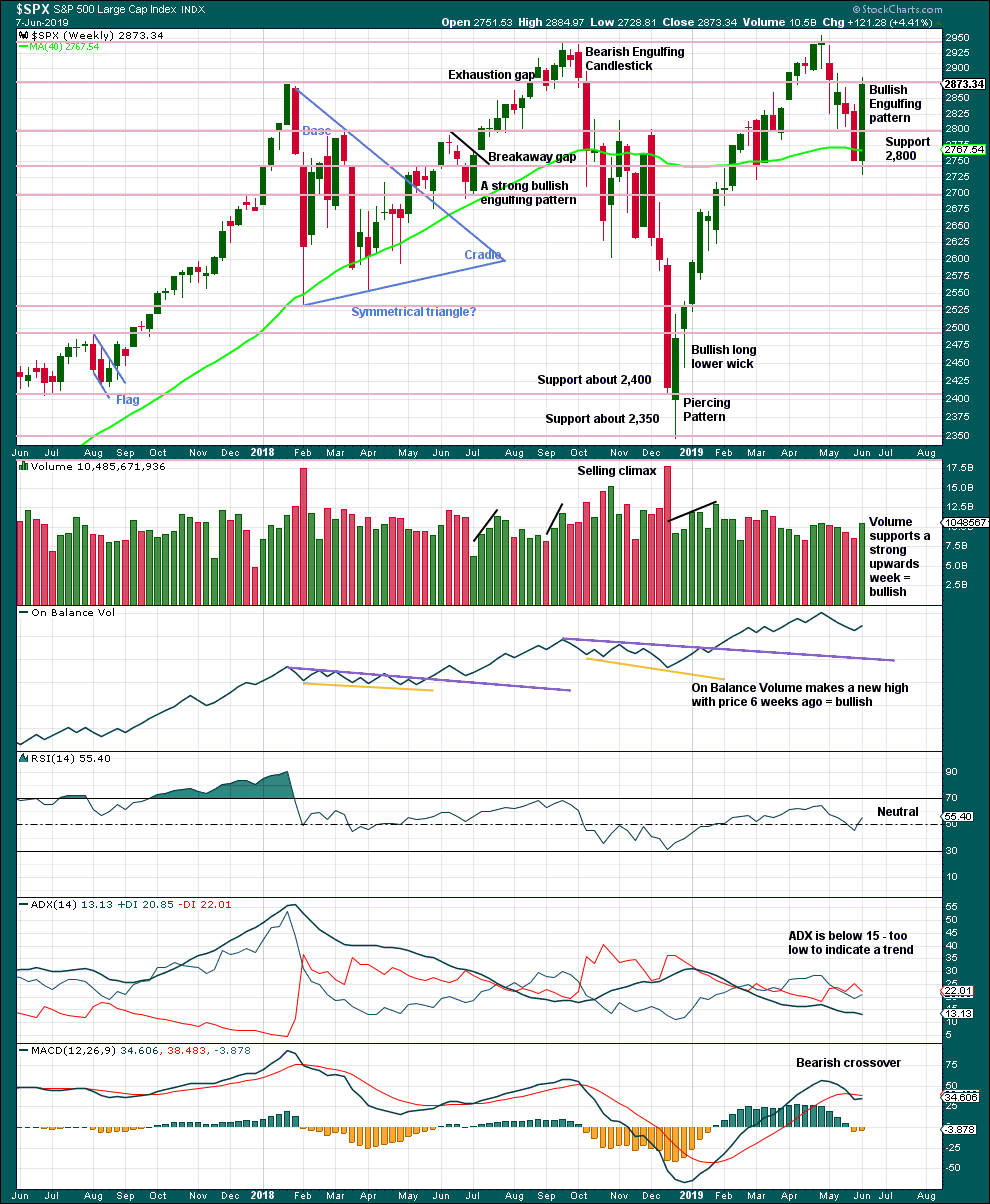
Click chart to enlarge. Chart courtesy of et=”_blank”>StockCharts.com.
Weight will be given in this analysis to the strong bullish reversal pattern, which has support from volume. This supports the main Elliott wave counts.
DAILY CHART
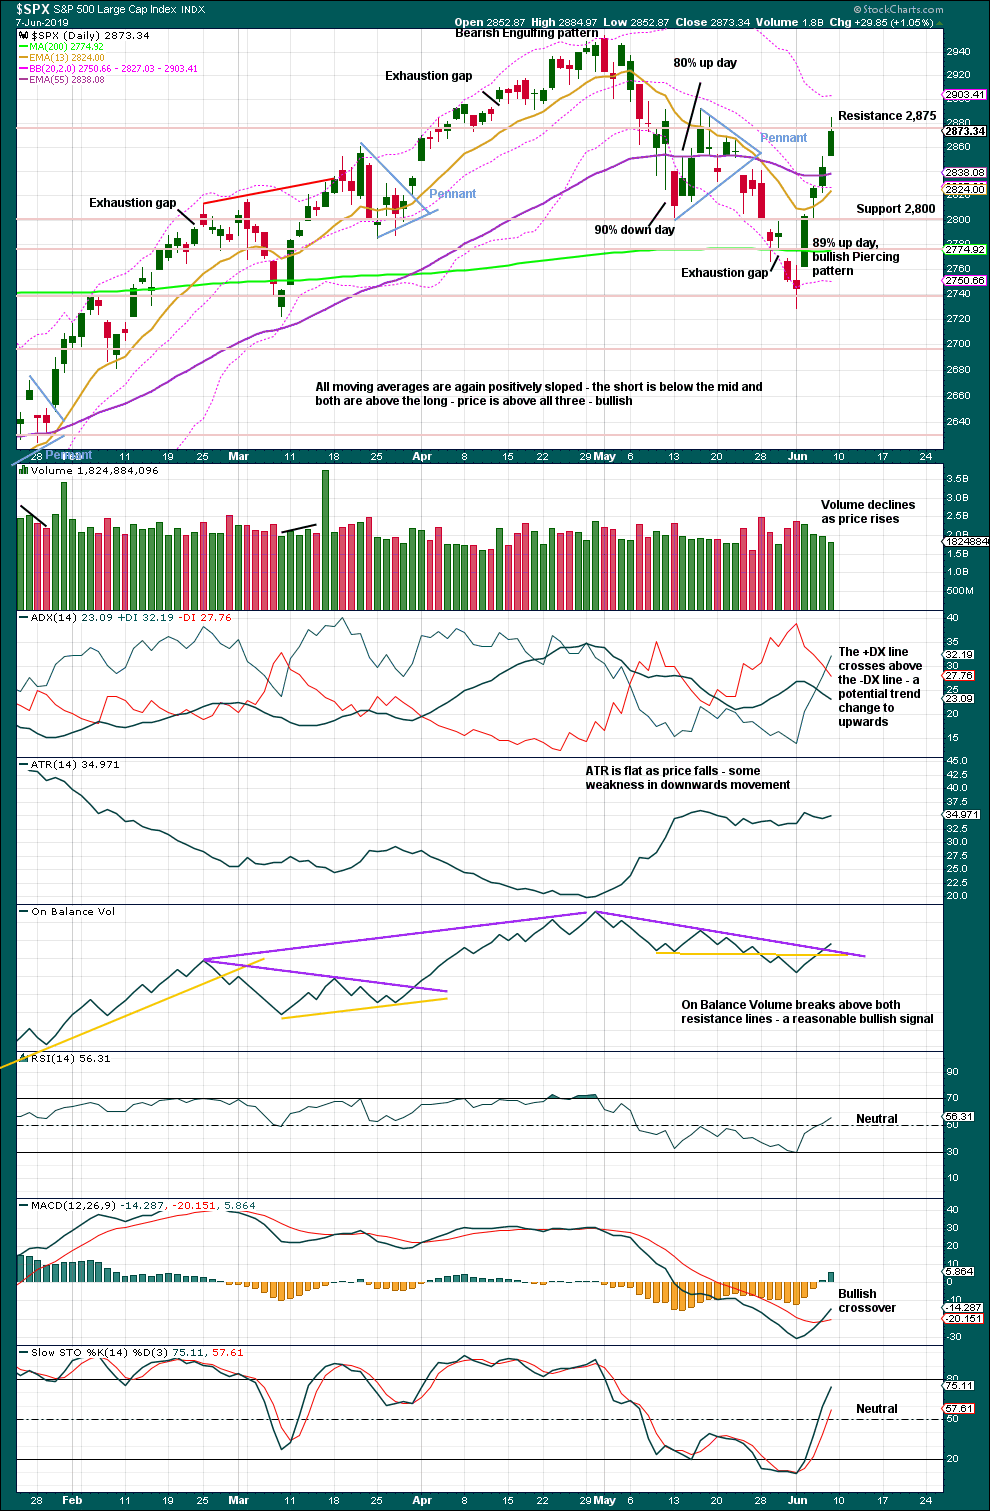
Click chart to enlarge. Chart courtesy of StockCharts.com.
Declining to flat ATR as price falls supports the first two Elliott wave counts and indicates the alternate looks less likely.
The bullish signal from On Balance Volume supports the main Elliott wave count.
Little weight will be given to some decline in volume at the daily chart level as this has been a feature of this market for some time yet price continues higher.
BREADTH – AD LINE
WEEKLY CHART
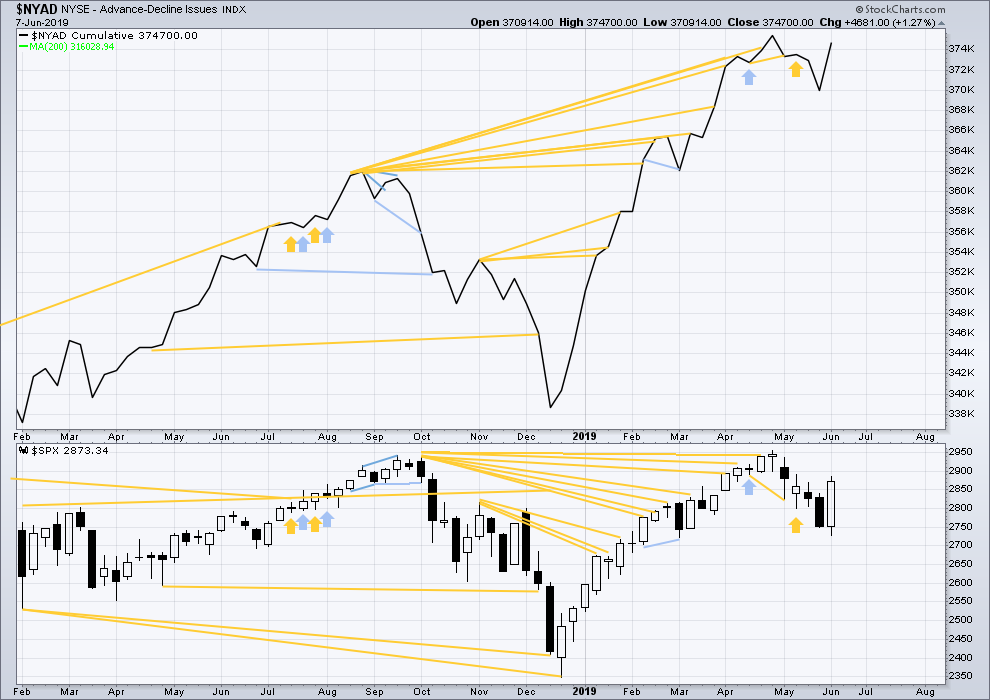
Click chart to enlarge. Chart courtesy of StockCharts.com. So that colour blind members are included, bearish signals
will be noted with blue and bullish signals with yellow.
Bear markets from the Great Depression and onwards have been preceded by an average minimum of 4 months divergence between price and the AD line with only two exceptions in 1946 and 1976. With the AD line making a new all time high on the 3rd of May, the end of this bull market and the start of a new bear market is very likely a minimum of 4 months away, which is the beginning of September 2019.
In all bear markets in the last 90 years there is some positive correlation (0.6022) between the length of bearish divergence and the depth of the following bear market. No to little divergence is correlated with more shallow bear markets. Longer divergence is correlated with deeper bear markets.
If a bear market does develop here, it comes after no bearish divergence. It would therefore more likely be shallow. The alternate Elliott wave count outlines this potential scenario.
Price has moved higher this week. Upwards movement has normal support from rising breadth. There is no divergence.
All of small mid and large caps are moving higher. Large caps are strongest; this is normal for the later stages of a bull market.
DAILY CHART
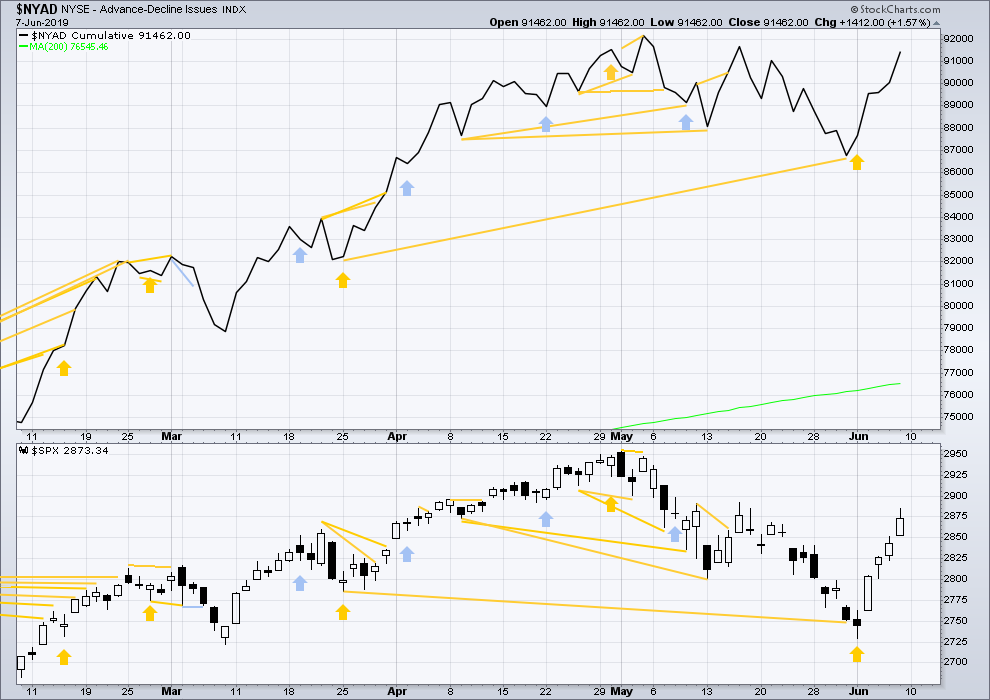
Click chart to enlarge. Chart courtesy of StockCharts.com. So that colour blind members are included, bearish signals
will be noted with blue and bullish signals with yellow.
Breadth should be read as a leading indicator.
Both price and the AD line are again moving higher. The AD line is not moving faster or slower than price. Upwards movement has support from rising market breadth. There is no new divergence.
VOLATILITY – INVERTED VIX CHART
WEEKLY CHART
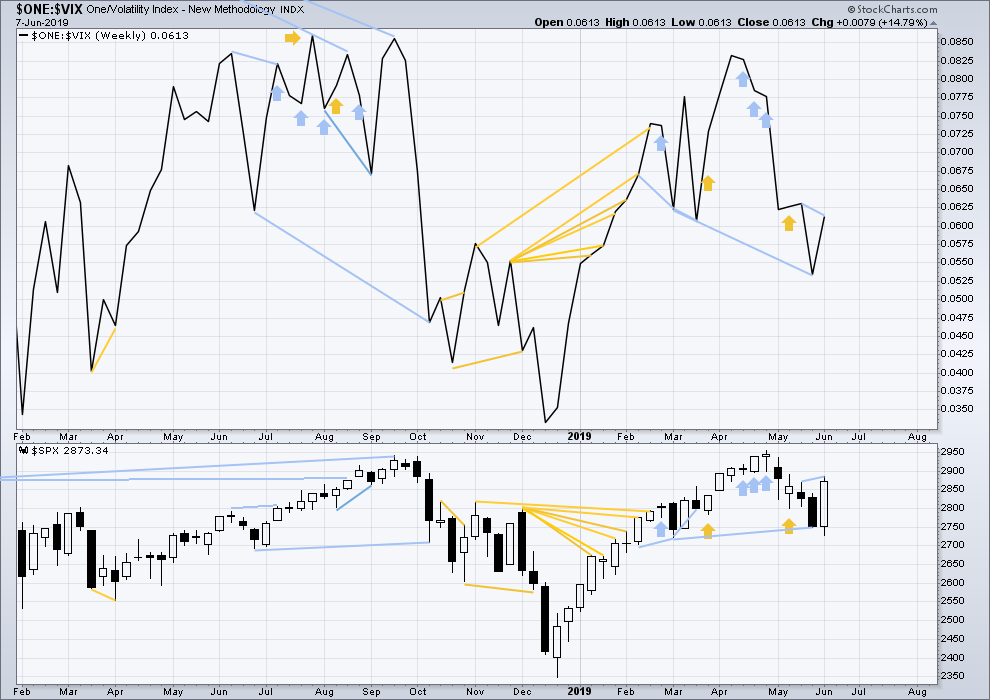
Click chart to enlarge. Chart courtesy of StockCharts.com. So that colour blind members are included, bearish signals
will be noted with blue and bullish signals with yellow.
Inverted VIX has made a new low below the low of the 4th of March, but price has not. Downwards movement comes with a strong increase in VIX, which is increasing faster than price. This divergence is bearish, but will not be given much weight in this analysis at this time.
This week price has made a new high above the high of two weeks ago, but inverted VIX has not. Price is rising faster than VIX is falling. This divergence is bearish for the short term.
DAILY CHART
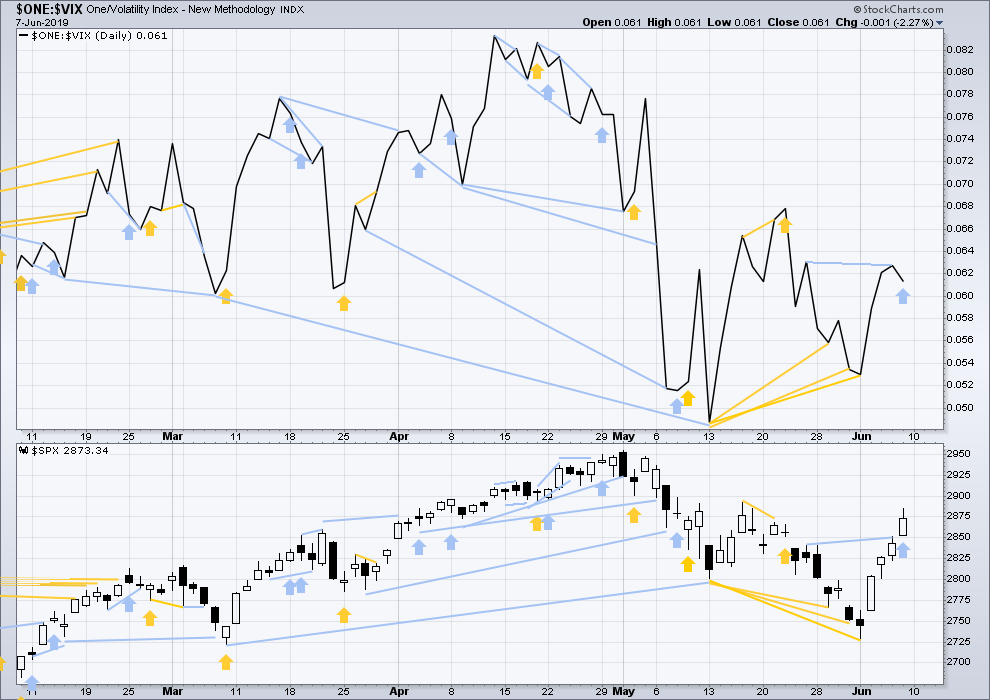
Click chart to enlarge. Chart courtesy of StockCharts.com. So that colour blind members are included, bearish signals
will be noted with blue and bullish signals with yellow.
Price has moved higher for Friday, but inverted VIX has moved lower. Upwards movement in price does not come with a normal corresponding decline in VIX. VIX has increased for the session. This divergence is bearish.
Bearish divergence between price and VIX has now developed to the point where it may be given some weight. It may be indicating a deeper pullback to begin soon, which may be intermediate wave (2) approaching.
DOW THEORY
Dow Theory confirmed a bear market in December 2018. This does not necessarily mean a bear market at Grand Super Cycle degree though; Dow Theory makes no comment on Elliott wave counts. On the 25th of August 2015 Dow Theory also confirmed a bear market. The Elliott wave count sees that as part of cycle wave II. After Dow Theory confirmation of a bear market in August 2015, price went on to make new all time highs and the bull market continued.
DJIA: 23,344.52 – a close on the 19th of December at 23,284.97 confirms a bear market.
DJT: 9,806.79 – price has closed below this point on the 13th of December.
S&P500: 2,532.69 – a close on the 19th of December at 2,506.96 provides support to a bear market conclusion.
Nasdaq: 6,630.67 – a close on the 19th of December at 6,618.86 provides support to a bear market conclusion.
With all the indices having moved higher following a Dow Theory bear market confirmation, Dow Theory would confirm a bull market if the following highs are made:
DJIA: 26,951.81
DJT: 11,623.58
S&P500: 2,940.91 – a new all time high has been made on the 29th of April 2019.
Nasdaq: 8,133.30 – a new high has been made on 24th of April 2019.
Published @ 09:31 p.m. EST.
—
Careful risk management protects your trading account(s).
Follow my two Golden Rules:
1. Always trade with stops.
2. Risk only 1-5% of equity on any one trade.
—
New updates to this analysis are in bold.
Taken a very small speculative short, and will add if it goes my way over the next day or two. Meanwhile I’ve lots of longs with deep stops that will have to wait out any intermediate 2 down.
Peter you short here?
You know it. I was long RTY overnight sold for profit, and went short with puts at SPY 290.50. Stop at an hourly close above today high. Like Rod building my non leveraged long position. On my way to Bend OR. Good luck to all!
Bend is about 5 or 6 hours from me! Have a great time in the upper class city inudated by Californian implants. They drive real estate prices sky high.
Lol. Looking to a retirement community for my mom and then 2 days with the fam in Sun River! We will continue to drive the prices up for you. I hope you have many properties ….
I stayed in Sun River and skied Bachelor just last year. Nice area, fantastic mountain.
Early afternoon update for the hourly chart:
It is now possible that intermediate (1) could be over. BUT please take this chart as outlining just that possibility, not that I think this is what is going to happen next. I would want to see end of session technicals before I make a call either way.
Within intermediate (1), minor 4 may have been over as labelled. The limit for minor 5 is given on the chart.
Bottom line: despite my labelling of intermediate (1) as potentially over, assume the upwards trend remains the same while price remains within the best fit channel.
If the channel is breached then assume intermediate (2) has arrived.
The strong upwards pull of intermediate (3) of primary 3 may force intermediate (2) to be fairly shallow. The 0.236 Fibonacci ratio would be my first preferred target, with the 0.382 Fibonacci ratio after that. Final support at the upper edge of the old black Elliott channel if it turns out to be deep.
I have had a spectacular time at Rio Frio with family this weekend. We are travelling back to Austin today, and so depending upon traffic and when we leave (we have teenagers in the party, they tend to slow everything down) I do not know exactly when I’ll be able to start end of session analysis.
It may be a little later than usual today. If so, my apologies folks.
Thanks for the early update, appreciated!
78.6% level at 2907 high potential to turn this market for a bit, and maybe even start the intermediate 2 down. The length of this intermediate 1 is now highly symmetric with multiple other moves up during the overall primary 1 up.
2904.8, boom!! more than close enough to count.
Thomas Grimes at tradinglife dot com shows the results of a statistical study of pullback depth (before turning back up). The curve for equities show NO HUMPS at/around fibo levels. Furthermore, it clearly shows that we get EDGE via deeper pullbacks, that is, the net probability of a turn just keeps rising up until about the 95% pullback level. So arguably, the deeper a pullback goes before initiating a turn and flashing enter signals the other way…the higher probability “it’s good”. That’s valuable data (and maybe intuitively obvious but I haven’t grokked it before). He argues that the lack of “humps” at fibo levels is compelling data the fibo levels are complete bunk. Hmmm. As precise measures…yea, maybe. But clearly we want to MEASURE, and I’ve just seen too much price behavior that shows some kind of “respect” over periods for those fibo levels to switch to a simple 20%/40%/60%/80% kind of yardstick. Also, many times fibo levels don’t turn the market…but operate as “stall points”, of significance. I’m not giving up on my fibos anytime soon, despite Grimes’ data and argument.
If anyone wants to see that retracement study (for equities, futures, forex, and “random”) go to adamhgrimes dot com slash testing-fibonaccis-12 and you’ll find an article, the graph is towards the bottom.
The McClellan Oscillator ($NYMO) has moved up from -60 past the zero point and past the +20 mark to +30. This is the classic confirmation of the new upward bullish move in SPX. This helps us to know the current move to 2875 is not an X wave or some other B wave. As Lara indicates in her video, the move will not be straight up. There will be corrections along the way. But $NYMO is telling us this is the real deal bullish rally and surprises will be to the upside.
Looks like another strong open this morning. I have made the decision to go to a 100% long SPX position in my long term account. Short term account is still 100% cash and waiting for completion of Intermediate 1 and 2 in SPX. In addition, short term account is looking for another gold position.
I am starting my summer vacations next week and don’t want to be constantly watching the markets. I will hold my long SPX position at least until we approach 3100. As many may recall, I am still looking for SPX to go much higher as Lara’s monthly alternates demonstrate.
As the SPX is approaching a new ATH, I am pleased to announce that my long term account has already achieved a new ATH. Thank you Lara and all those who post here trying to assist one another in such endeavors. I look forward to 2 or 3 more years of active investment and occasional short term trading. Afterwards, I will most likely hand it over to someone else to manage to free my time and mind as I head into full retirement.
BTW, I mentioned with a large laugh last week that I was only 32 years of age. Double that and add 1 as of September 2019.
Have a great day everyone!
While I’m day trading SPX and RUT (using UPRO and UWM), I’m also position trading a relatively large # of stocks in these strong bull market conditions. I’m using my favorite algorithm, which some laugh at but my studies show it has great properties. Assuming a stock has volatility around 3% (ATR/price = 3%, though I just look at the volatility shown on finviz dot com and it shows me that percentage, close enough), once bought I put in one cancels another orders for a stop at -15% and a limit at +3%. And sit back. I do this only for stocks that are generally in a strong high time frame (weekly/monthly) uptrend…or that have pulled back significantly at the weekly level in a quarterly time frame strong up trend. An example of the latter would be SPLK, which turned today off double bottom action on a 61.8% after a symmetric big move down over the last few weeks. An example of a taking a smallish pullback in a consistent up trending stock would be my buy of NOW a few days ago, already sold with my 3% profit. Why not “let them run”? Because often they don’t. The theory here is “take quick profit on a high momentum move”, then go find another such with the original money + profit (compounding is key!). The stop logic is simply to get the stop out of the high and even moderate probability range of random price fluctuation. Usually the stop price is below hourly and sometimes daily volatility bands (keltner/bollinger). This overall algorithm I’ve texted extensively, and it’s excellent in bull markets.
I have a short book on this trading approach (“The Spec-K Trading System”) on amazon for $3, or send me email if you want a copy and I’m happy to send a PDF. zinc1024, at the google email place. What the book is clearly missing is now to modulate your overall positioning based on Elliott wave position of the overall market. Maybe my 3rd edition…lol!!
Yet another look at this week. This is the ES Heikin-Ashi 4 hour candles chart. The fib levels are the same ones that I put out on Tuesday. The retracement opportunity to enter this trend is marked by point “R” on the chart. The ES broke above 2800, wnet to 2825, then retested down to 2801 which is the point “R”.
“Primary wave 3 is expected to be shorter in length and time to primary wave 1 ”
Why do you say that Lara?
Lara has mentioned that she is looking at this Cycle V wave to be a fractal of the entire SuperCycle Wave (V) in which Cycle III is shorter in price movement than Cycle I. Thus she is now expecting Primary 3 to be shorter than Primary 1 and Primary 5 to be the shortest. As a result, this main wave count has a maximum price of 3477.39.
At the top of this page you can access two alternate monthly charts. One has a target of 3050+ and the other 4100+ which is my favorite.
I hope that helps.
Thanks Rodney. That’s exactly it.
Also, if P3 is longer than P1, because P1 is quite long already (extended) the structure of cycle V would be too long and would have to move beyond the limit of 3,477.39.
The value of this knowledge is rather staggering, actually. I realize it’s only a probability, but we know it’s a high probability. Edge is everything, and the leverage of THAT pivot high when it comes is astronomical. I kind of get the chills thinking about this turning point looming out there.
Thanks to you both
First! May it bring me good trading fortune next week.
You are just too fast for me Ron U. The early bird gets the worm.