Yesterday’s main Elliott wave count expected more upwards movement, which is exactly what has happened so far.
Summary: The low of December 2018 is expected to most likely remain intact.
The pullback may have ended. A new target for a third wave up is at 3,104.
The alternate wave count considers the possibility that a relatively short lived bear market may have begun. The target is at 2,080. This wave count has a fairly low probability, but it is a possibility that must be acknowledged. This possibility may now be discarded with a new high above 2,892.15.
The biggest picture, Grand Super Cycle analysis, is here.
Monthly charts were last published here, with video here. There are two further alternate monthly charts here, with video here.
ELLIOTT WAVE COUNTS
The first two Elliott wave counts below will be labelled First and Second. They may be about of even probability. When the fifth wave currently unfolding on weekly charts may be complete, then these two wave counts will diverge on the severity of the expected following bear market. To see an illustration of this future divergence monthly charts should be viewed.
The alternate Elliott wave count has a very low probability.
FIRST WAVE COUNT
WEEKLY CHART
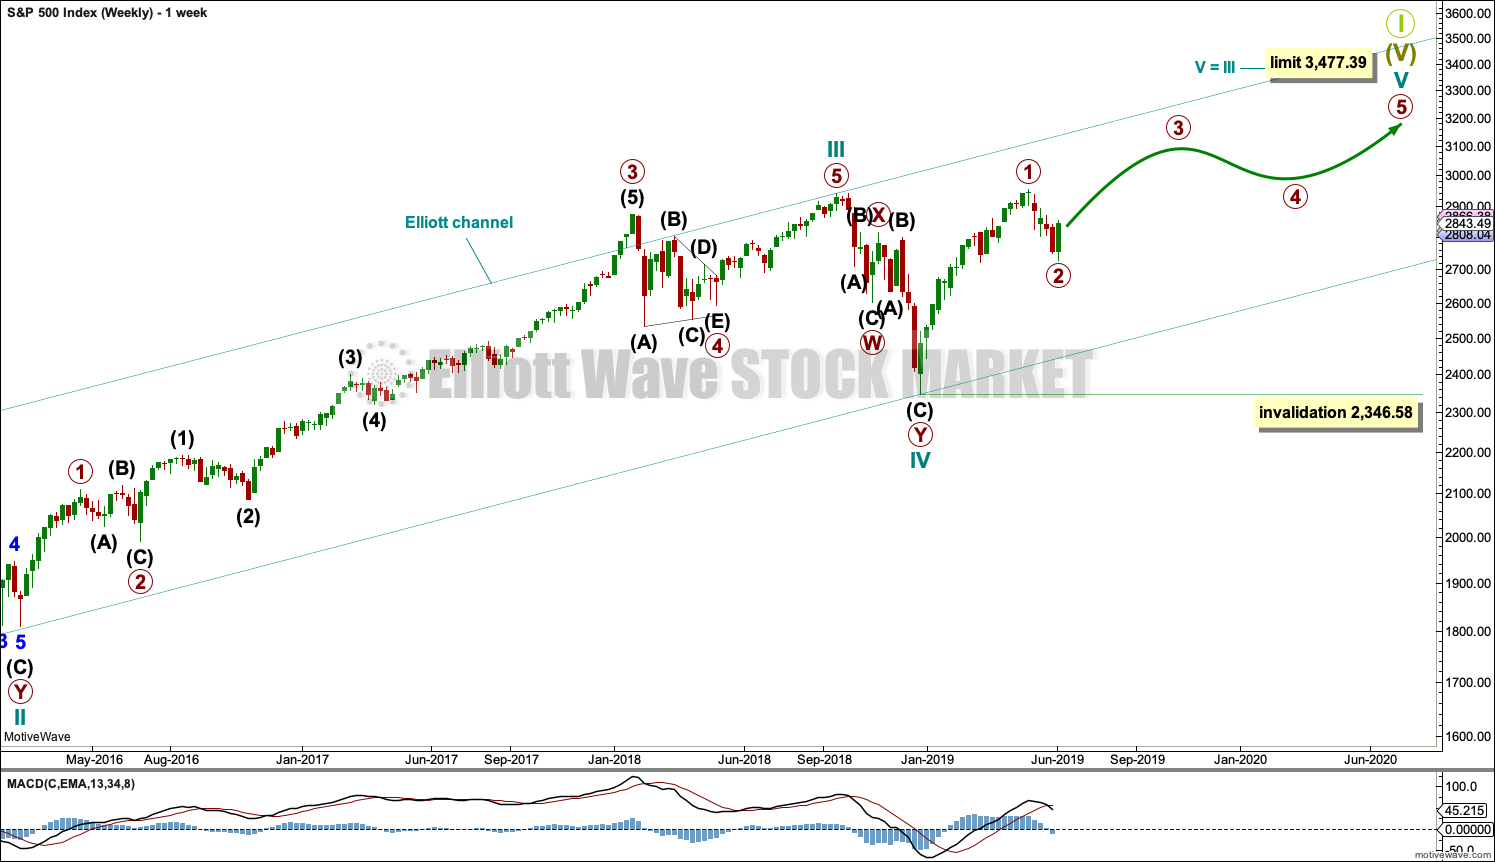
The basic Elliott wave structure consists of a five wave structure up followed by a three wave structure down (for a bull market). This wave count sees the bull market beginning in March 2009 as an incomplete five wave impulse and now within the last fifth wave, which is labelled cycle wave V. This impulse is best viewed on monthly charts. The weekly chart focusses on the end of it.
Elliott wave is fractal. This fifth wave labelled cycle wave V may end a larger fifth wave labelled Super Cycle wave (V), which may end a larger first wave labelled Grand Super Cycle wave I.
The teal Elliott channel is drawn using Elliott’s first technique about the impulse of Super Cycle wave (V). Draw the first trend line from the end of cycle wave I (off to the left of the chart, the weekly candlestick beginning 30th November 2014) to the end of cycle wave III, then place a parallel copy on the end of cycle wave II. This channel perfectly shows where cycle wave IV ended at support. The strongest portion of cycle wave III, the end of primary wave 3, overshoots the upper edge of the channel. This is a typical look for a third wave and suggests the channel is drawn correctly and the way the impulse is counted is correct.
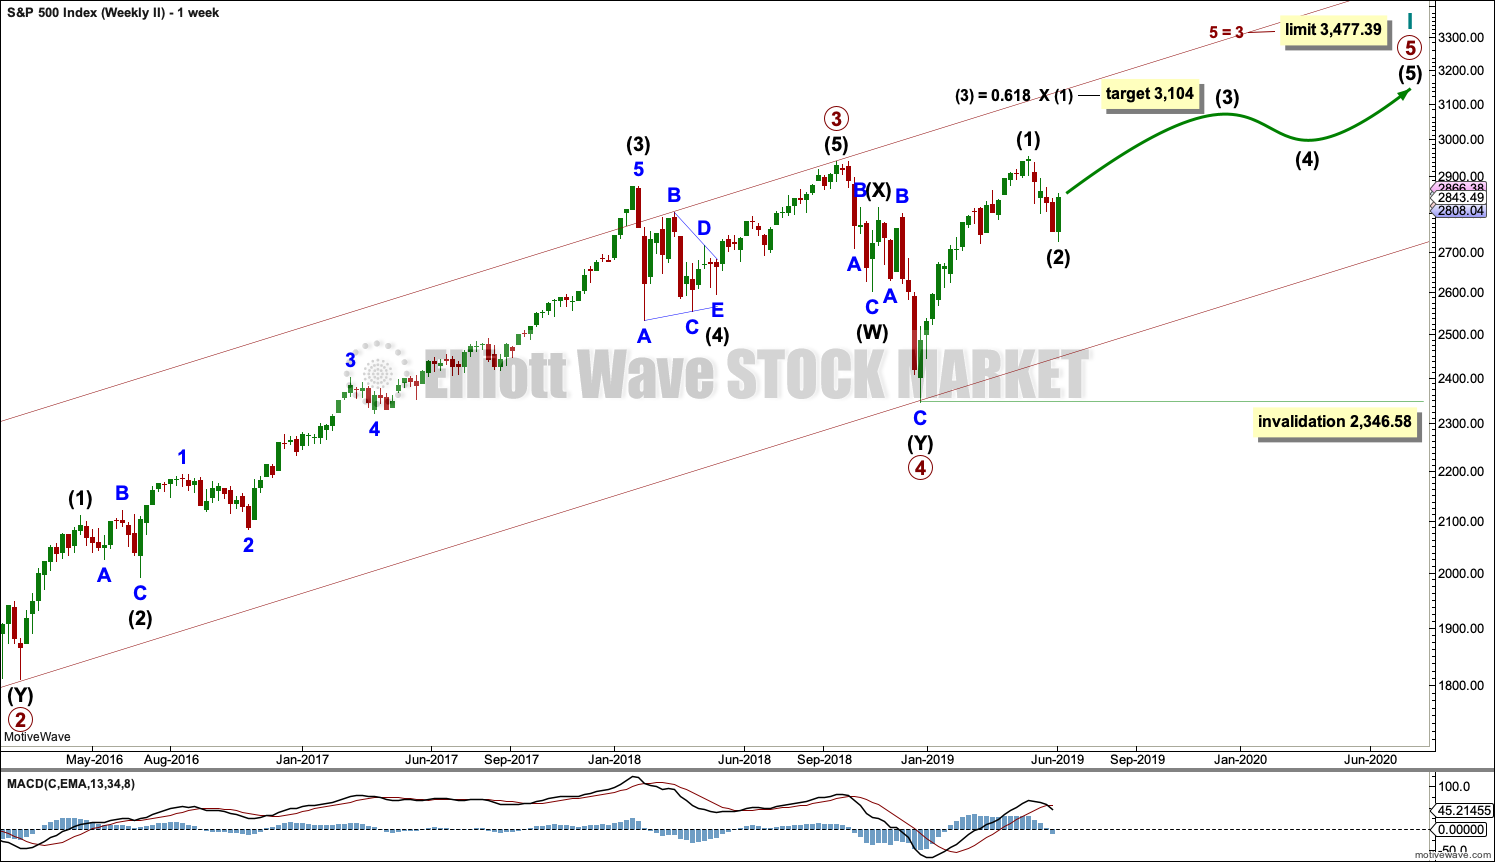
Within Super Cycle wave (V), cycle wave III is shorter than cycle wave I. A core Elliott wave rule states that a third wave may never be the shortest. For this rule to be met in this instance, cycle wave V may not be longer in length than cycle wave III. This limit is at 3,477.39.
The structure of cycle wave V is focussed on at the daily chart level below.
Within cycle wave V, primary wave 2 may not move beyond the start of primary wave 1 below 2,346.58.
In historic analysis, two further monthly charts have been published that do not have a limit to upwards movement and are more bullish than this wave count. Members are encouraged to consider those possibilities (links below summary) alongside the wave counts presented on a daily and weekly basis.
DAILY CHART
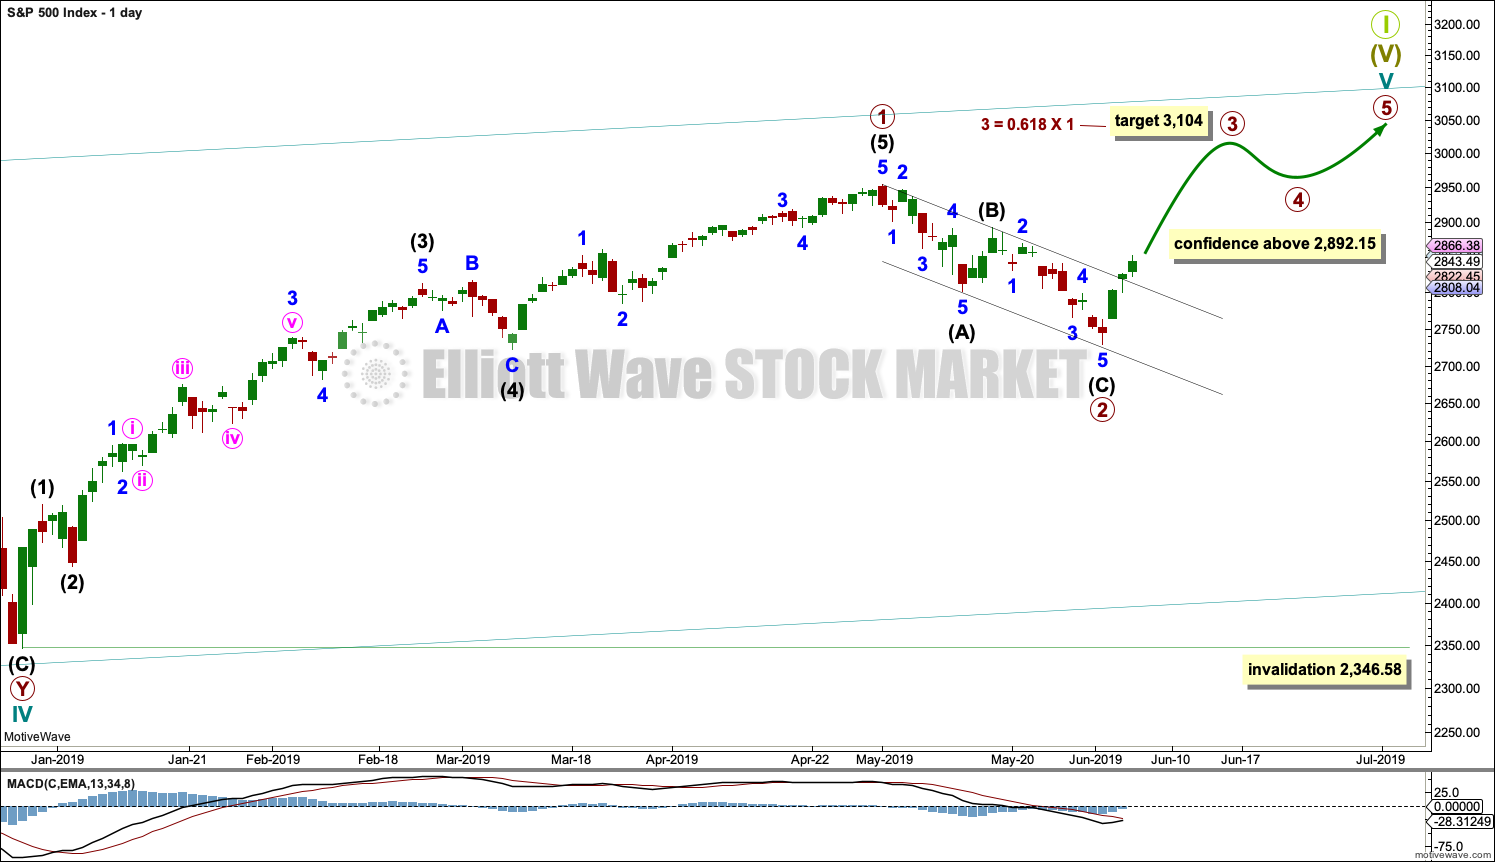
Cycle wave V must subdivide as a five wave motive structure. Within that five wave structure, primary wave 1 may be complete. Primary wave 2 may now be complete.
Primary wave 3 must move above the end of primary wave 1.
When primary wave 3 is over, then primary wave 4 may be a shallow sideways consolidation that may not move into primary wave 1 price territory below 2,954.13.
Thereafter, primary wave 5 should move above the end of primary wave 3 to avoid a truncation.
If it continues further, then primary wave 2 may not move beyond the start of primary wave 1 below 2,346.58.
Draw a channel about primary wave 2 using Elliott’s technique. Draw the first trend line from the start of intermediate wave (A) to the end of intermediate wave (B), then place a parallel copy on the end of intermediate wave (A). Intermediate wave (C) may have ended almost perfectly at support at the lower edge of this channel.
The channel is now breached by upwards movement. This provides confidence that the pullback for primary wave 2 is over and primary wave 3 should underway.
At this stage, a new high above 2,892.15 would invalidate the alternate wave count below and offer some confidence to this wave count.
HOURLY CHART
Price has broken above the upper edge of the black Elliott channel. This adds confidence that primary wave 2 may be over.
Further confidence would come with a new high above 2,892.15 and invalidation of the bearish alternate Elliott wave count below.
Primary wave 3 is expected to be shorter in length and time to primary wave 1. Primary wave 1 lasted 86 sessions, 3 short of a Fibonacci 89. Primary wave 3 may be 0.382 this duration at about a Fibonacci 34 sessions; so far, it has lasted 3. This is a very rough guideline only.
Primary wave 3 may appear to be condensed because it is expected to be shorter in length and time than primary wave 1. Corrections within primary wave 3 may also be quicker, and for this reason minor waves 1 and 2 are labelled complete. The first reasonable sized pullback within primary wave 3 may not appear until intermediate wave (1) is complete and intermediate wave (2) arrives.
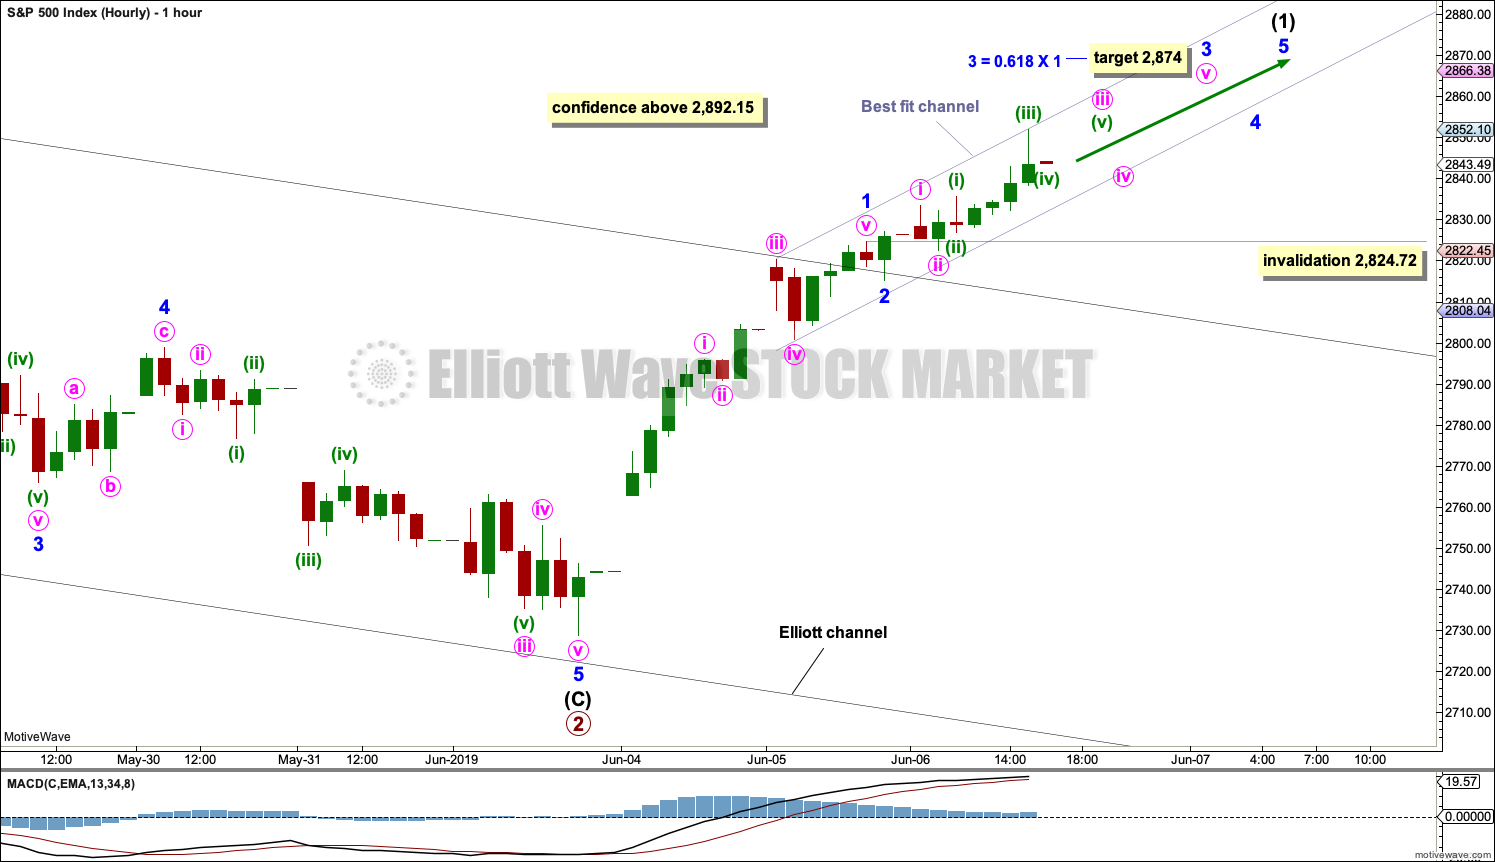
Minor wave 3 may only subdivide as an impulse. Within the impulse, minute wave iv may not move into minute wave i price territory below 2,824.72.
A best fit channel is drawn about more recent upwards movement. This channel may show where smaller pullbacks find support.
A target is calculated for minor wave 3, which fits with the higher target on the daily chart.
SECOND WAVE COUNT
WEEKLY CHART
This weekly chart is almost identical to the first weekly chart, with the sole exception being the degree of labelling.
This weekly chart moves the degree of labelling for the impulse beginning in March 2009 all down one degree. This difference is best viewed on monthly charts.
The impulse is still viewed as nearing an end; a fifth wave is still seen as needing to complete higher. This wave count labels it primary wave 5.
ALTERNATE WAVE COUNT
WEEKLY CHART
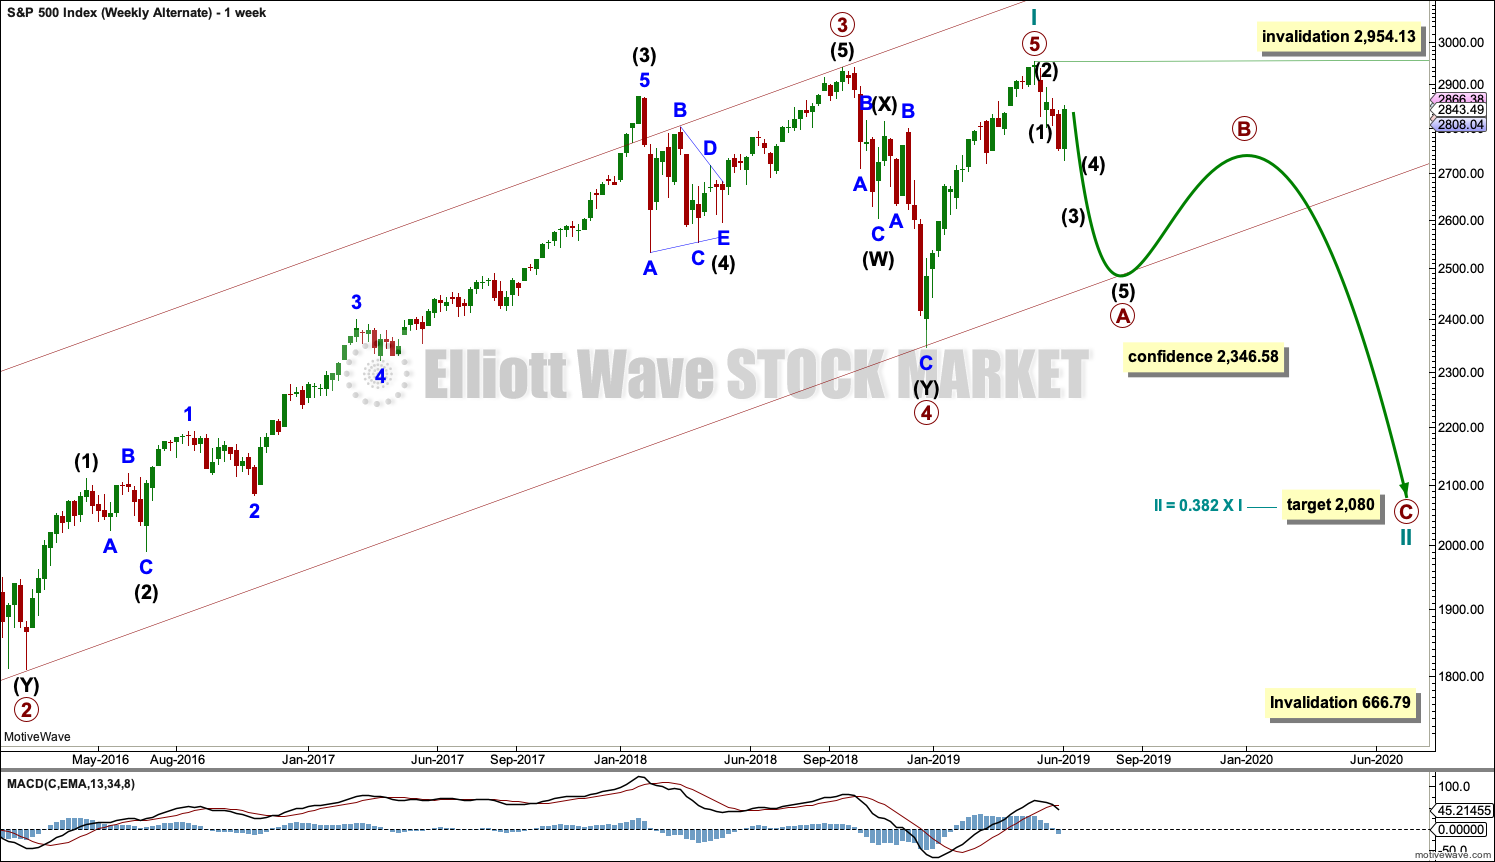
It is possible that for the second wave count cycle wave I could be complete. Primary wave 5 may be seen as a complete five wave impulse on the daily chart.
If cycle wave I is complete, then cycle wave II may meet the definition of a bear market with a 20% drop in price at its end.
Within cycle wave I, primary wave 1 was a very long extension and primary wave 3 was shorter than primary wave 1 and primary wave 5 was shorter than primary wave 3. Because primary wave 1 was a long extension cycle wave II may end within the price range of primary wave 2, which was from 2,132 to 1,810. The 0.382 retracement of cycle wave I is within this range.
Cycle wave II may not move beyond the start of cycle wave I below 666.79.
This wave count does not have support at this time from classic technical analysis.
DAILY CHART
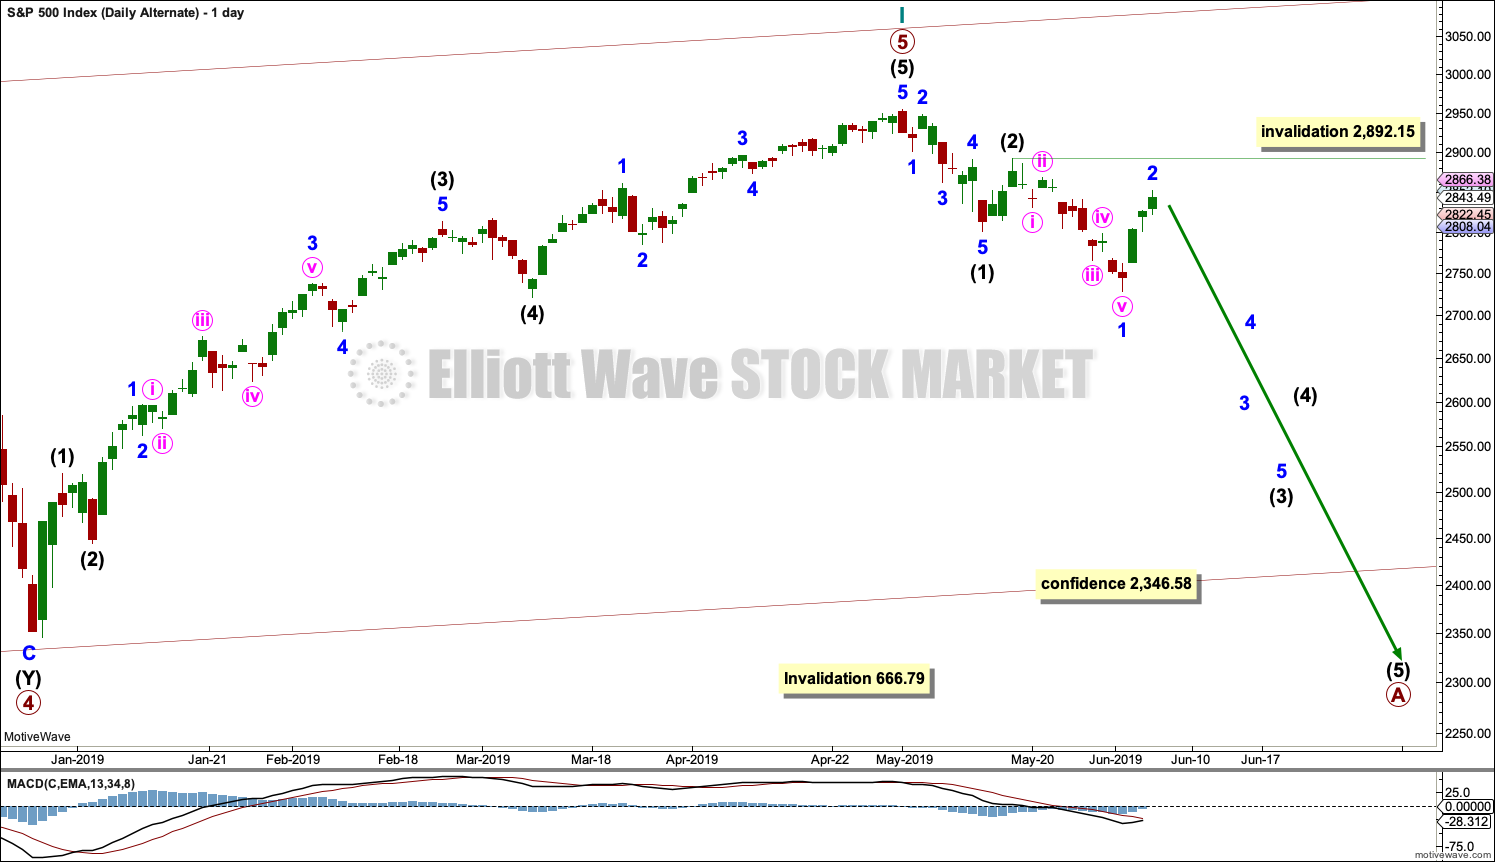
The most likely structure for cycle wave II would be a zigzag. Within a zigzag, primary wave A would subdivide as a five wave structure, most likely an impulse. Within the impulse of primary wave A, so far intermediate waves (1) and (2) may be complete and intermediate wave (3) has moved below the end of intermediate wave (1) and may be incomplete.
Intermediate wave (3) would reach 1.618 the length of intermediate wave (1) at 2,645.
Intermediate wave (3) may only subdivide as an impulse. Within the impulse, minor wave 1 may be complete. Minor wave 2 may not move beyond the start of minor wave 1 above 2,892.15. At this stage, a new high above this point would see this alternate wave count discarded.
Within the zigzag, primary wave B may not move beyond the start of primary wave A.
TECHNICAL ANALYSIS
WEEKLY CHART
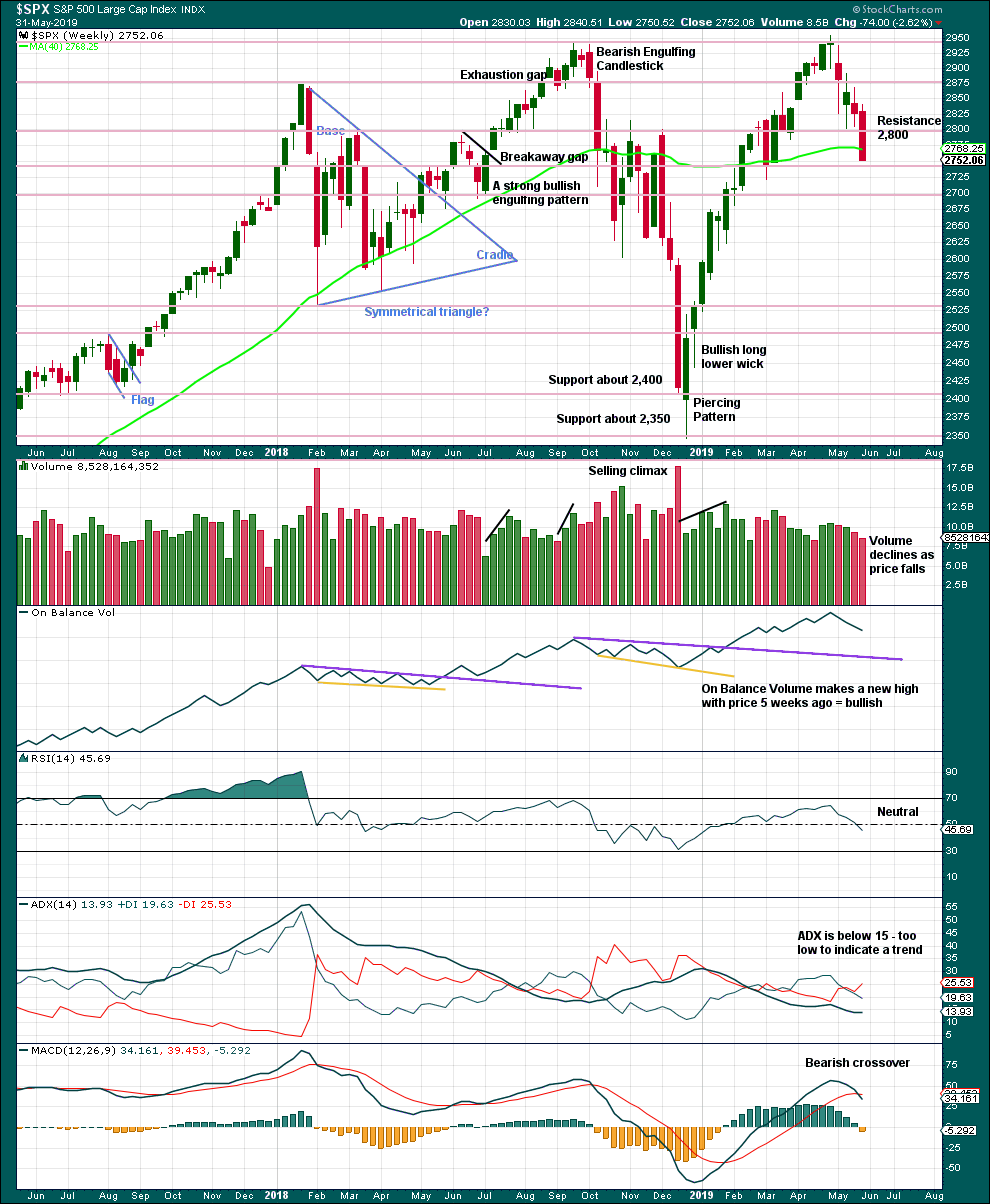
Click chart to enlarge. Chart courtesy of et=”_blank”>StockCharts.com.
There is an upwards trend from the low in December 2018, a series of higher highs and higher lows with a new all time high on the 30th of April 2019. The last swing low at 2,785.02 on the 25th of March has now been breached, so a trend change is now possible.
Last weekly candlestick closes with strong downwards movement and almost no lower wick. The lack of a lower wick strongly suggests more downwards movement this week. It is possible that downwards movement to begin the week for Monday has fulfilled this expectation, but it is also possible that it may continue.
DAILY CHART
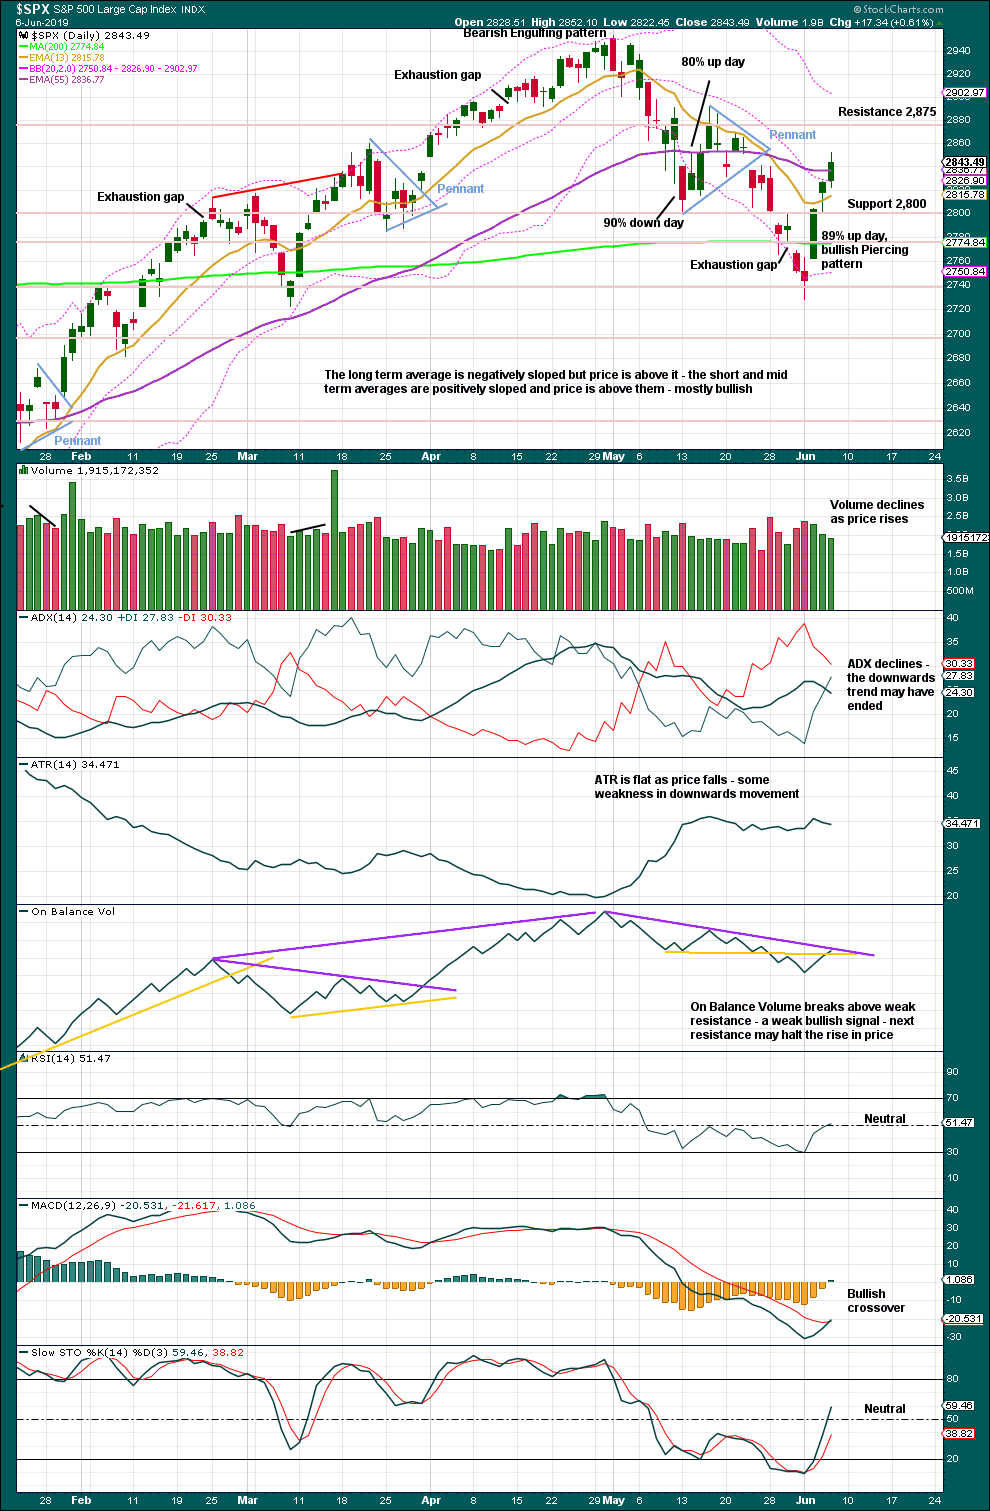
Click chart to enlarge. Chart courtesy of StockCharts.com.
Declining to flat ATR as price falls supports the first two Elliott wave counts and indicates the alternate looks less likely.
Resistance at On Balance Volume offers some technical significance; the purple trend line is reasonably long held, tested four times, and does not have a steep slope. A breach would be a reasonable bullish signal, but it may halt the rise in price here and force a pullback.
BREADTH – AD LINE
WEEKLY CHART
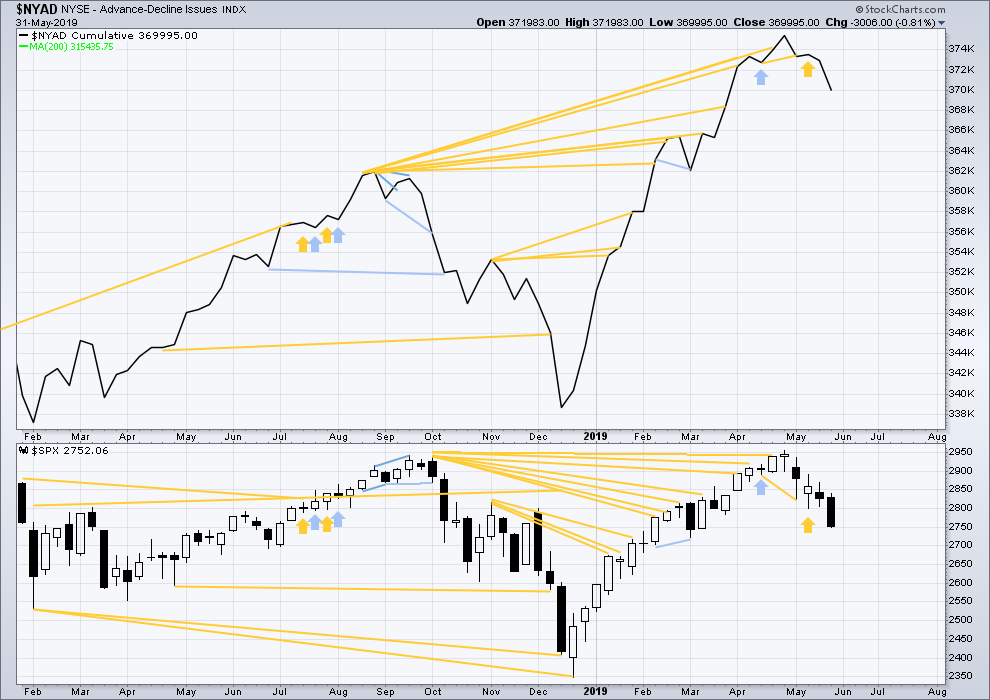
Click chart to enlarge. Chart courtesy of StockCharts.com. So that colour blind members are included, bearish signals
will be noted with blue and bullish signals with yellow.
Bear markets from the Great Depression and onwards have been preceded by an average minimum of 4 months divergence between price and the AD line with only two exceptions in 1946 and 1976. With the AD line making a new all time high on the 3rd of May, the end of this bull market and the start of a new bear market is very likely a minimum of 4 months away, which is the beginning of September 2019.
In all bear markets in the last 90 years there is some positive correlation (0.6022) between the length of bearish divergence and the depth of the following bear market. No to little divergence is correlated with more shallow bear markets. Longer divergence is correlated with deeper bear markets.
If a bear market does develop here, it comes after no bearish divergence. It would therefore more likely be shallow. The alternate Elliott wave count outlines this potential scenario.
Price has moved lower last week. Neither price nor the AD line have made new lows below the prior swing low of the week of the 4th of March. There is no new mid-term divergence.
DAILY CHART
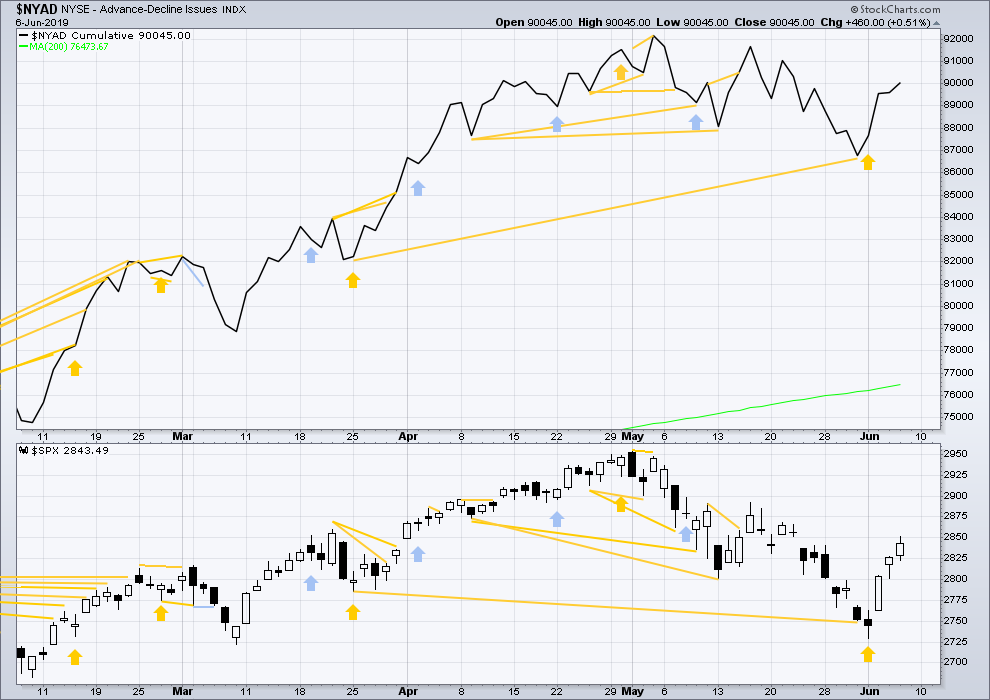
Click chart to enlarge. Chart courtesy of StockCharts.com. So that colour blind members are included, bearish signals
will be noted with blue and bullish signals with yellow.
Breadth should be read as a leading indicator.
Both price and the AD line are moving higher today. The AD line is not moving faster or slower than price. Upwards movement has support from rising market breadth. There is no new divergence.
VOLATILITY – INVERTED VIX CHART
WEEKLY CHART
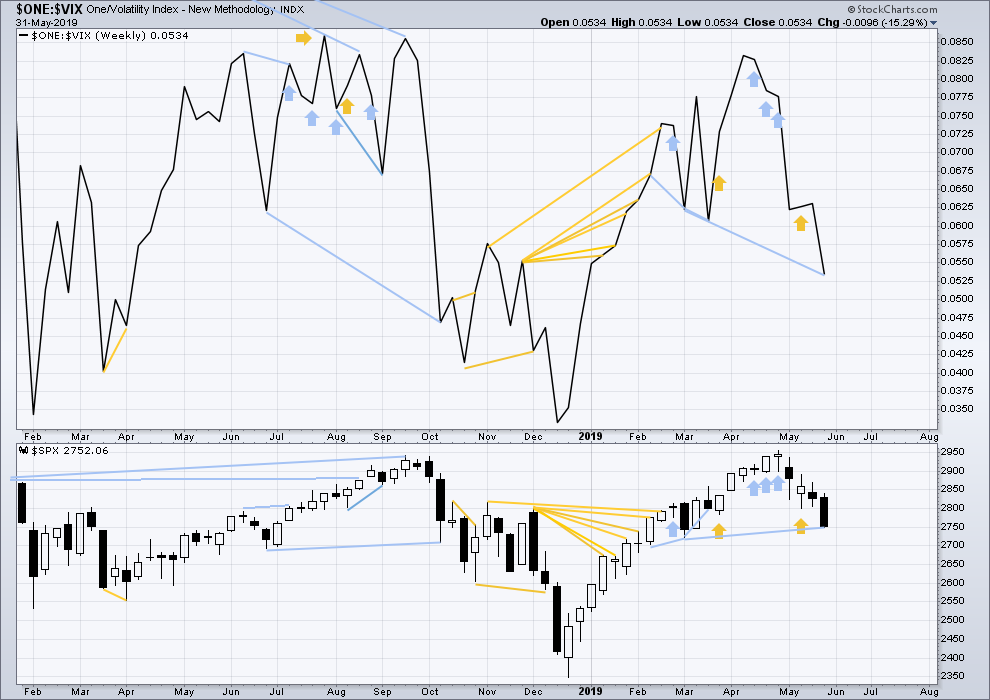
Click chart to enlarge. Chart courtesy of StockCharts.com. So that colour blind members are included, bearish signals
will be noted with blue and bullish signals with yellow.
Inverted VIX has made a new low below the low of the 4th of March, but price has not. Downwards movement comes with a strong increase in VIX, which is increasing faster than price. This divergence is bearish, but will not be given much weight in this analysis at this time.
If bearish divergence develops further, then it may be given some weight.
DAILY CHART
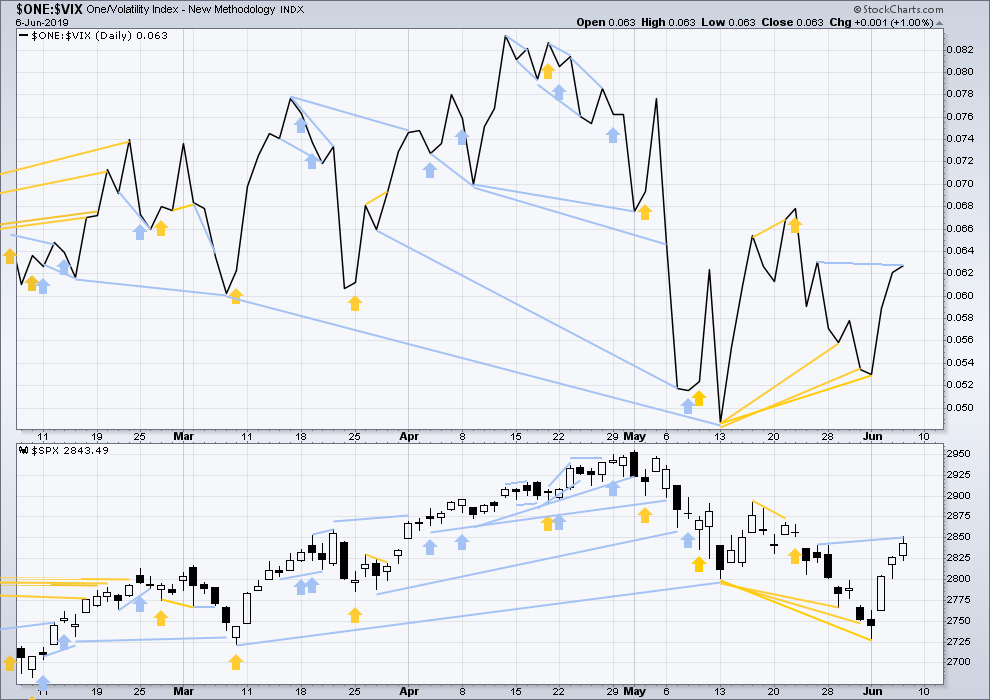
Click chart to enlarge. Chart courtesy of StockCharts.com. So that colour blind members are included, bearish signals
will be noted with blue and bullish signals with yellow.
Today price has made a slight new high above the prior swing high of the 24th of May, but inverted VIX has not. Upwards movement has not come with a normal corresponding decline in VIX. This divergence is bearish. However, the divergence is very weak and is only single, so it shall not be given weight in this analysis.
DOW THEORY
Dow Theory confirmed a bear market in December 2018. This does not necessarily mean a bear market at Grand Super Cycle degree though; Dow Theory makes no comment on Elliott wave counts. On the 25th of August 2015 Dow Theory also confirmed a bear market. The Elliott wave count sees that as part of cycle wave II. After Dow Theory confirmation of a bear market in August 2015, price went on to make new all time highs and the bull market continued.
DJIA: 23,344.52 – a close on the 19th of December at 23,284.97 confirms a bear market.
DJT: 9,806.79 – price has closed below this point on the 13th of December.
S&P500: 2,532.69 – a close on the 19th of December at 2,506.96 provides support to a bear market conclusion.
Nasdaq: 6,630.67 – a close on the 19th of December at 6,618.86 provides support to a bear market conclusion.
With all the indices having moved higher following a Dow Theory bear market confirmation, Dow Theory would confirm a bull market if the following highs are made:
DJIA: 26,951.81
DJT: 11,623.58
S&P500: 2,940.91 – a new all time high has been made on the 29th of April 2019.
Nasdaq: 8,133.30 – a new high has been made on 24th of April 2019.
Published @ 05:58 p.m. EST.
—
Careful risk management protects your trading account(s).
Follow my two Golden Rules:
1. Always trade with stops.
2. Risk only 1-5% of equity on any one trade.
—
New updates to this analysis are in bold.

Hi everybody, I thought you may find this amusing. When we travel I sometimes get work done en route. I am lucky, I almost never suffer car sickness.
We’re off to spend the weekend at the Rio Frio in Lakey TX.
Ha ha!!! I love it. Hourly bar chart elliott wave car nav. Yes, just follow the arrow!
Good trading this week! See ya in Oregon next !
You are headed my way Peter S. Oregon is a large and ecologically diverse state. Lots to see and lots to do. Have fun.
Hourly chart updated:
I’ve reanalysed the structure unfolding of intermediate (1). I’m moving minor 1 down, this has a slightly better look. Minor 3 may be over, minor 4 may be also over quickly now. Minor 5 would be limited to no longer than equality in length with 3 because 3 is shorter than 1.
The best fit channel is adjusted, it’s close to an Elliott channel.
The invalidation point moves down.
What you’re seeing on VIX Verne may possibly be advance warning of intermediate (2).
Yes indeed. This has a really good look now, and helps clarify where we may potentially be. Thank you!
And I’m glad to know you’re enjoying your US visit. (We have guests from Romania coming to visit us here in MN a couple weeks from now.)
Wow, it’s been incredible rally, well with 2872 low of minor 4, so with even 0.618 of minor 3 will get us to 2923…. bigger rally than i had anticipated
The VIX is bothering me today as well, also 3 almost = 1, could also be counted as ABC…
Is there anyway Lara to differentiate??
I cannot differentiate the two ideas for certain, but I will use classic TA. If this is a bounce for either a B or X wave then it should exhibit weakness.
This weekly candlestick is very strong with good support from volume, I really would not want to publish a chart labelling it wave B or X.
VIX up over 2.5% on a day when SPX is up 1.3%!!!
Things that make you say “Hmmmm…”
Great point. VIX is still below the middle of its BB range though. That being said, I have not gone 100% long. I am now at 50% and will wait to see what next week brings.
The hourly view is less concerning. Barely a blip compared to last week’s VIX action, and it’s tagged the 21 ema and turned back down now. Only 1% up overall for the day at this moment. And/or it could be reflecting the fact that some consolidation of this rather sharp multi-day move should coming fast.
Sold my long position that I opened Monday. Going short…
yea i’ll try a small bite of that…
2869 (ish) is the 61.8% of the entire 2 down and could turn this market for some ii wave consolidation.
This move up has slightly exceeded the swing up after the last substantial correction in the primary 1, and done it with more momentum (white up line is a projection of that historic move). So symmetry also suggests also some corrective action here may be due.
Boom, up and through the 61.8%! “The force is strong with this one.” B wave high just ahead (100% line) then a 78.6%.
Seems like recession probabilities are ticking up based on fundamentals I’m reading about. To support this bullish count, I think we need some “good news” coming down the pipe, maybe something positive re: China and/or new Mexico trade war craziness. Some fundamental focused folks are calling for a 10-20% correction “soon” based on recession indicating data. We’ll see!
Daily SPX. The white lines are projections of the upswings throughout the course of the primary 1 up. They strongly indicate, along with the overhead 78.6% and swing high (100%) and additionally the upper volatility band, that some consolidation should start, somewhere in the range of here to 2907.
I’ve changed my macd to a non-standard 3,9,16 and simple ma to give it more sensitivity on this chart.
I am not even close to being 1st to post. I will fondly look back to the old days when I was 1st often. I kind of feel like all those US veterans from D-Day. It was so long ago and is only in my mind today. (Won’t you all be surprised when I reveal I am really 32 years old)
It looks to me like Lara is right on track again with the count. The Minor 2 correction was quite minor. We are now on our way much higher and will not see the top of the gap at 2763 closed until we are on our way much, much lower when this bull market is finally over. So today I will watch the open and take on the rest of my long positions as warranted. You all know, don’t you, once I do that, we will see the correction for which I have been waiting! But the longer term count has us going over the 3100 mark and I will ride through any correction.
Have a great day all.
———————————————————————————————
By the way, last week when I went for an overnight trip into the mountains of the US Pacific Northwest, within 50 yards of leaving the trail head, I saw a big pile of bear scat. It was somewhat fresh. So I was on the lookout for a bear. But just like the US equities market, I failed to see a real bear. I also ended up crossing two avalanche areas and walking on top of 8 feet of snow. It was a very challenging and vigorous trip.
This overnighter was in preparation for a two week trip to NE Washington State by the Canadian border in Grizzly Bear territory. I leave on July 1st. I will have my long position established and think I will be able to comfortably let it ride while I am gone.
You are intentionally heading on foot to encounter GRIZZLY BEARS? Black bears, okay. But Grizzly’s…well, as I see it, that would be like intentionally going out swimming in the ocean after you’ve definitely seen a great white fin cruising just offshore!
I’m sure you know what you are doing, but be safe!
In such territory one must:
1) Have good bear awareness skills = make lots of noise and have the wind at one’s back
2) Carry for quick deployment and know how to use bear spray
3) Hang food at night at least 100 yards from sleeping spot
4) Never eat where you sleep and keep your clothes clean from food
5) Don’t hike at dawn or dusk
6) Carry and know how to use a Search & Rescue emergency call device
7) Never hike alone in Grizzly Bear territory (This one I violate as I hike without another person. However, I have a four footed friend.)
And for me, I let my trusted yellow lab, Hunter, go about 50 yards ahead of me. He will alert me to any animals like he did last week with an elk and two deer. He stops on the trail and turns around to catch my eye. Then he looks forward and waits. Furthermore, Hunter alerts me during the night if something or someone is approaching.
32??? And all those surgeries? Ouch. That’s rough Rodney. Now I’m feeling old and gray at 60…but not really, I’m fit (maybe the most fit I’ve been my entire life), still on the make every day and haven’t been under the knife since I was 23. Knock on wood. Hell, light some of that wood up! “Isn’t it good Norwegian wood?” I don’t chase bears in the mountains but I did do a little class III rafting a week ago. Year ago I did class V (Cherry Creek/Upper Toulumne) in a paddle boat a couple of times, swam a class V rapid (“the Skeleton”), hard core fun! Though swimming a class V rapid isn’t much more violent than going over the falls on a 6 footer. The only difference being in a rapid you might get stuck in a strainer or against a rock and die…it happens.
“Primary wave 3 is expected to be shorter in length and time to primary wave 1 ”
Why do you say that Lara?
Maybe answering my own question here..because of the V having to be shorter than III limit in one scenario ?
Wow… she’s fast today! (Sorry Rodney!)
2 red candles of the IWM now… just saying
You need to charge that battery, Peter!
In Sonoma on a road trip…. see you on the next stop.
I like RUT to the long side here, though I’ll like it more when it breaks through the blue 21 ema. This is daily bars. Daily trend still showing “down” but it’s a clear pivot low and swing headed higher and all lower TF’s are strong up.
If SPX is going to new ATH’s, RUT is going to generally be moving up in concert is how I see it.