
The first target at 2,739 to 2,738 was passed. The next target at 2,722 has not quite been met.
Today the AD line and Lowry’s data is used to indicate the most likely next direction for tomorrow.
Summary: The low of December 2018 is expected to most likely remain intact, and this pullback is expected to be followed by a strong third wave up to new all time highs.
The pullback may have ended today, 6.81 points short of the target. A new target now for a third wave up is at 3,104.
If price keeps falling, then the next target is still at 2,722, and thereafter 2,690 (which still looks too low).
The alternate wave count considers the possibility that a relatively short lived bear market may have begun. The target is at 2,080. This wave count has a fairly low probability, but it is a possibility that must be acknowledged. This possibility may now be discarded with a new high above 2,892.15.
The biggest picture, Grand Super Cycle analysis, is here.
Monthly charts were last published here, with video here. There are two further alternate monthly charts here, with video here.
ELLIOTT WAVE COUNTS
The first two Elliott wave counts below will be labelled First and Second. They may be about of even probability. When the fifth wave currently unfolding on weekly charts may be complete, then these two wave counts will diverge on the severity of the expected following bear market. To see an illustration of this future divergence monthly charts should be viewed.
The alternate Elliott wave count has a very low probability.
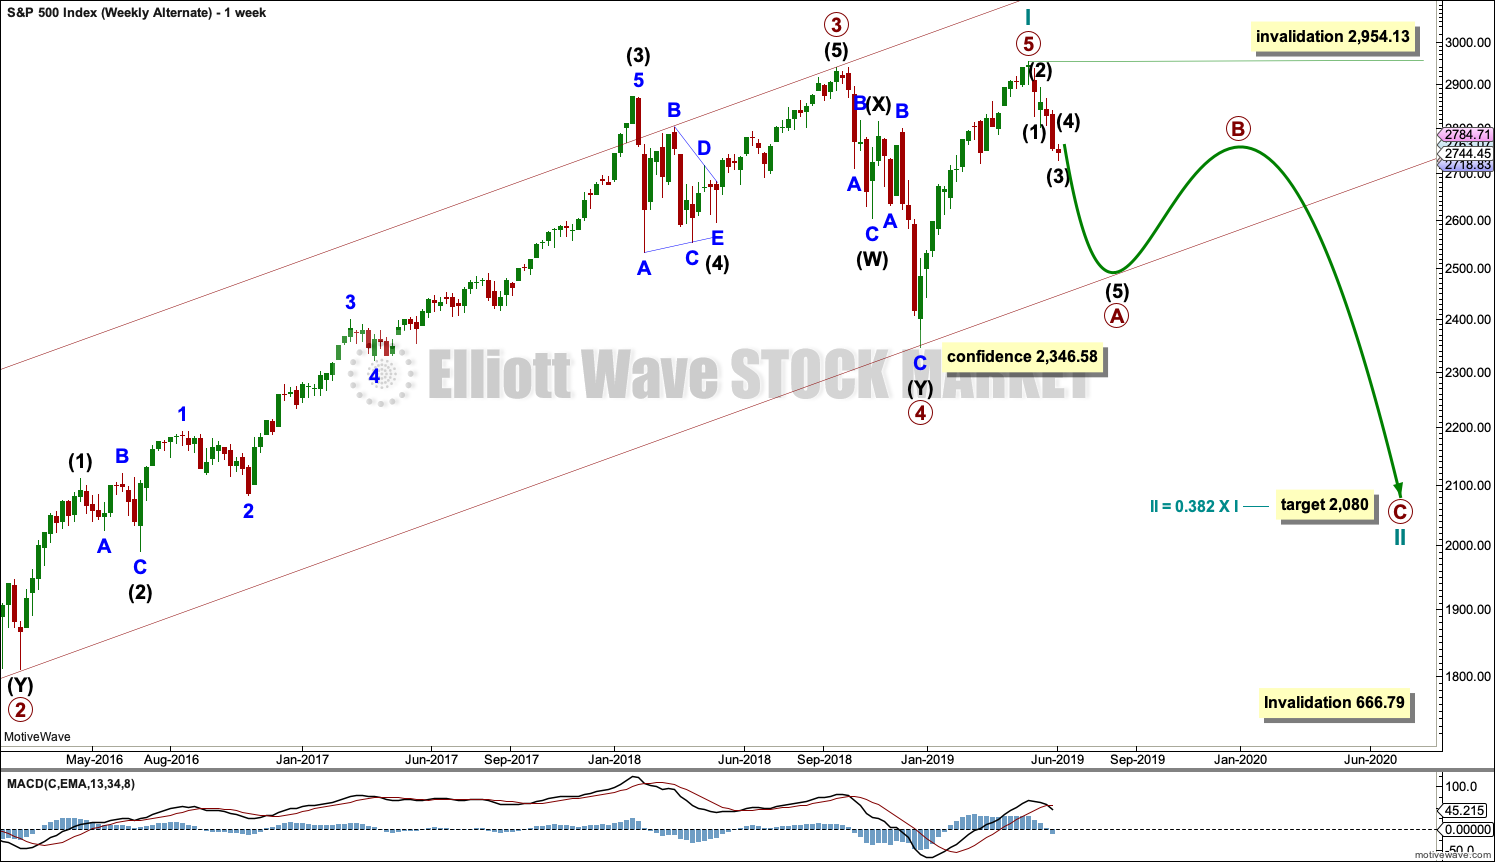
FIRST WAVE COUNT
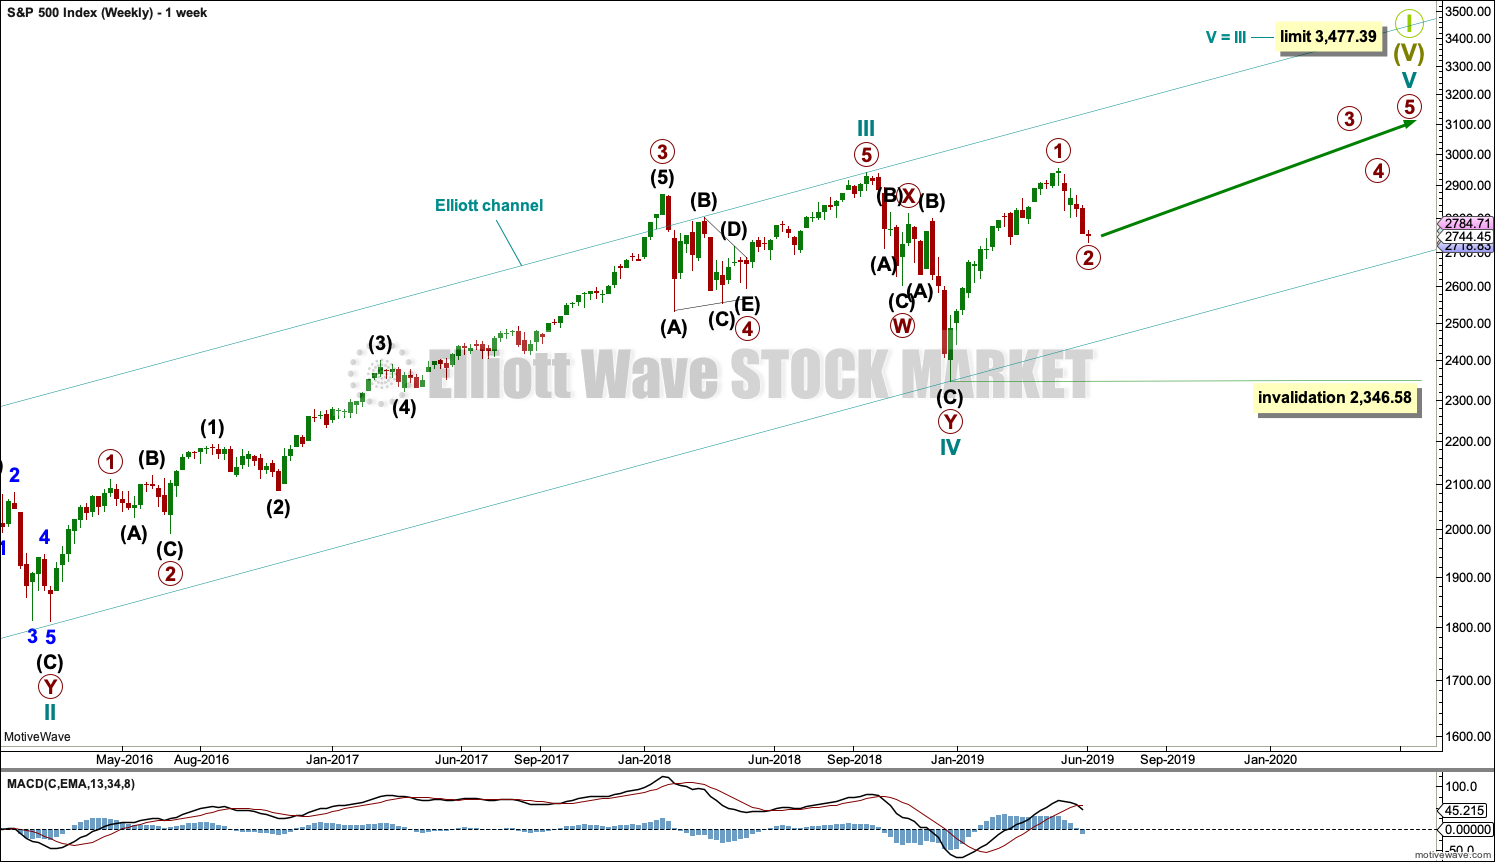
WEEKLY CHART
Click chart to enlarge.
The basic Elliott wave structure consists of a five wave structure up followed by a three wave structure down (for a bull market). This wave count sees the bull market beginning in March 2009 as an incomplete five wave impulse and now within the last fifth wave, which is labelled cycle wave V. This impulse is best viewed on monthly charts. The weekly chart focusses on the end of it.
Elliott wave is fractal. This fifth wave labelled cycle wave V may end a larger fifth wave labelled Super Cycle wave (V), which may end a larger first wave labelled Grand Super Cycle wave I.
The teal Elliott channel is drawn using Elliott’s first technique about the impulse of Super Cycle wave (V). Draw the first trend line from the end of cycle wave I (off to the left of the chart, the weekly candlestick beginning 30th November 2014) to the end of cycle wave III, then place a parallel copy on the end of cycle wave II. This channel perfectly shows where cycle wave IV ended at support. The strongest portion of cycle wave III, the end of primary wave 3, overshoots the upper edge of the channel. This is a typical look for a third wave and suggests the channel is drawn correctly and the way the impulse is counted is correct.
Within Super Cycle wave (V), cycle wave III is shorter than cycle wave I. A core Elliott wave rule states that a third wave may never be the shortest. For this rule to be met in this instance, cycle wave V may not be longer in length than cycle wave III. This limit is at 3,477.39.
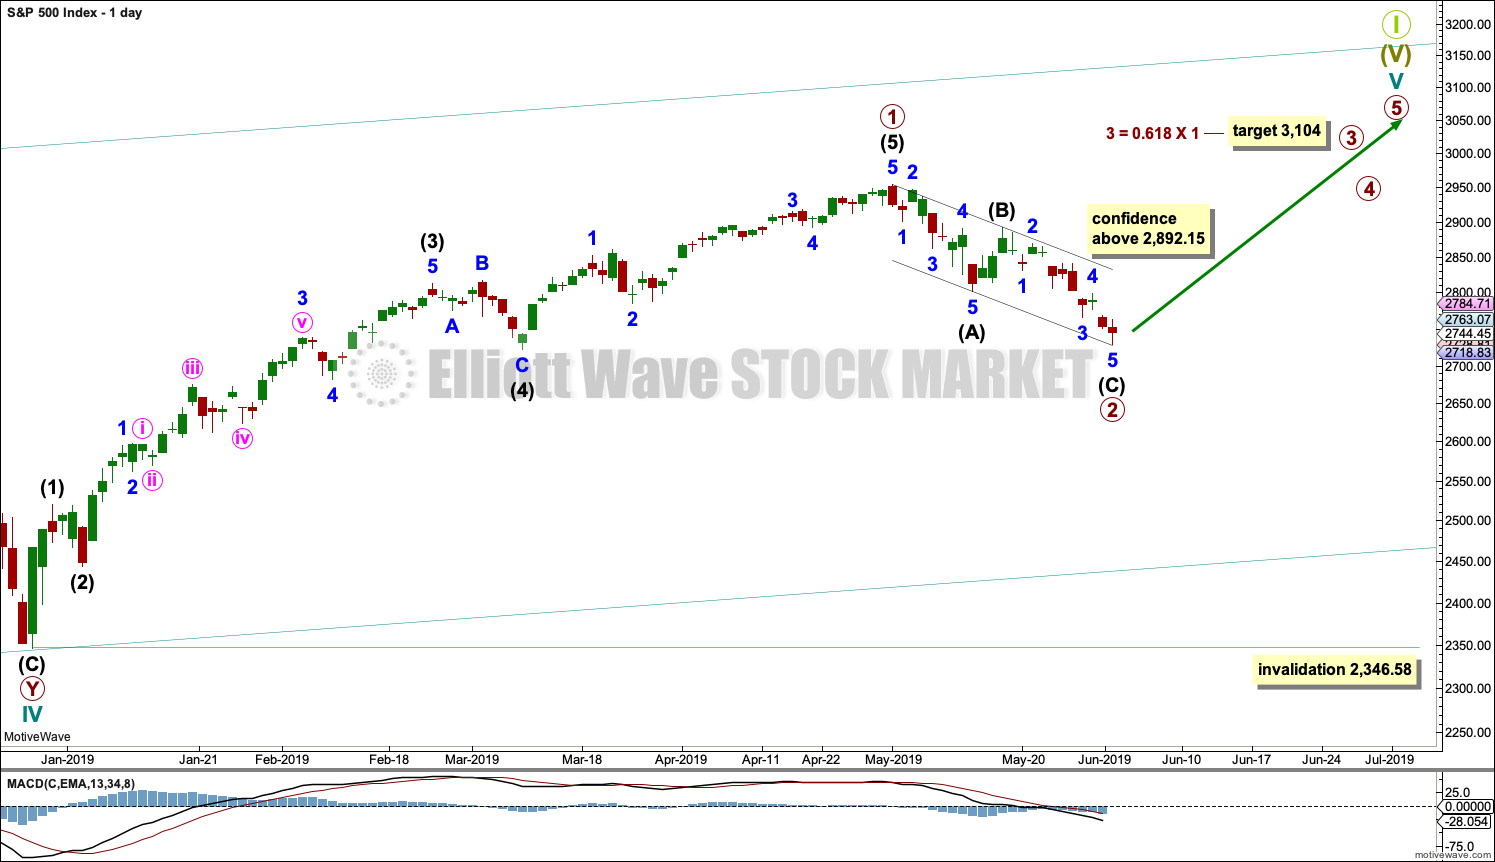
The structure of cycle wave V is focussed on at the daily chart level below.
Within cycle wave V, primary wave 2 may not move beyond the start of primary wave 1 below 2,346.58.
In historic analysis, two further monthly charts have been published that do not have a limit to upwards movement and are more bullish than this wave count. Members are encouraged to consider those possibilities (links below summary) alongside the wave counts presented on a daily and weekly basis.
DAILY CHART
Click chart to enlarge.
Cycle wave V must subdivide as a five wave motive structure. Within that five wave structure, primary wave 1 may be complete. Primary wave 2 may now be complete.
Primary wave 3 must move above the end of primary wave 1.
When primary wave 3 is over, then primary wave 4 may be a shallow sideways consolidation that may not move into primary wave 1 price territory below 2,954.13.
Thereafter, primary wave 5 should move above the end of primary wave 3 to avoid a truncation.
If it continues further, then primary wave 2 may not move beyond the start of primary wave 1 below 2,346.58.
Draw a channel about primary wave 2 using Elliott’s technique. Draw the first trend line from the start of intermediate wave (A) to the end of intermediate wave (B), then place a parallel copy on the end of intermediate wave (A). Intermediate wave (C) may have ended today almost perfectly at support at the lower edge of this channel.
When the channel is breached by upwards movement, it shall be used to provide confidence that the pullback for primary wave 2 is over and primary wave 3 would then be expected to be underway.
At this stage, a new high above 2,892.15 would invalidate the alternate wave count below and offer some confidence to this wave count.
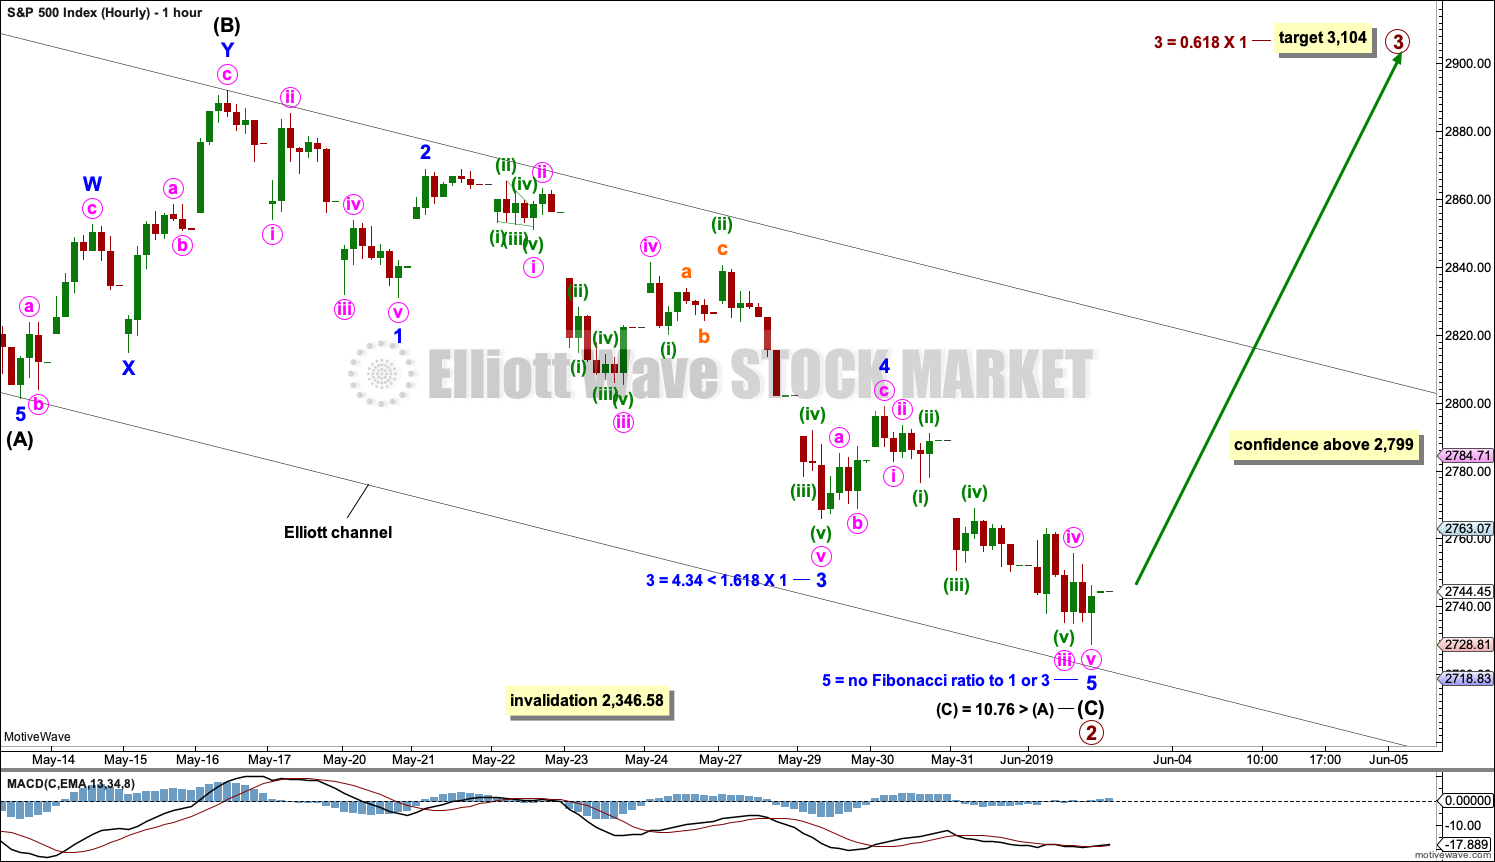
HOURLY CHART
Click chart to enlarge.
Primary wave 2 may be a complete zigzag.
Intermediate wave (C) may have ended very slightly short of the lower edge of the black Elliott channel. Fibonacci Ratios within primary wave 2 are noted on the chart. It is common for two of the three actionary waves within an impulse to exhibit a Fibonacci ratio, but uncommon for all three to exhibit Fibonacci Ratios. Here, minor waves 3 and 1 within intermediate wave (C) exhibit a Fibonacci ratio, but minor wave 5 does not. The Fibonacci ratio between intermediate waves (A) and (C) has a variation of less than 10% the length of intermediate wave (C), and I consider this to be acceptable.
The first confidence point is noted on this hourly chart. A new high above 2,799 (which is the start of minor wave 5) could not be a second wave correction within minor wave 5, so minor wave 5 may not at that stage be extending and must be complete.
If price breaks above the upper edge of the black Elliott channel, then that would add confidence that a low should be in place.
SECOND WAVE COUNT
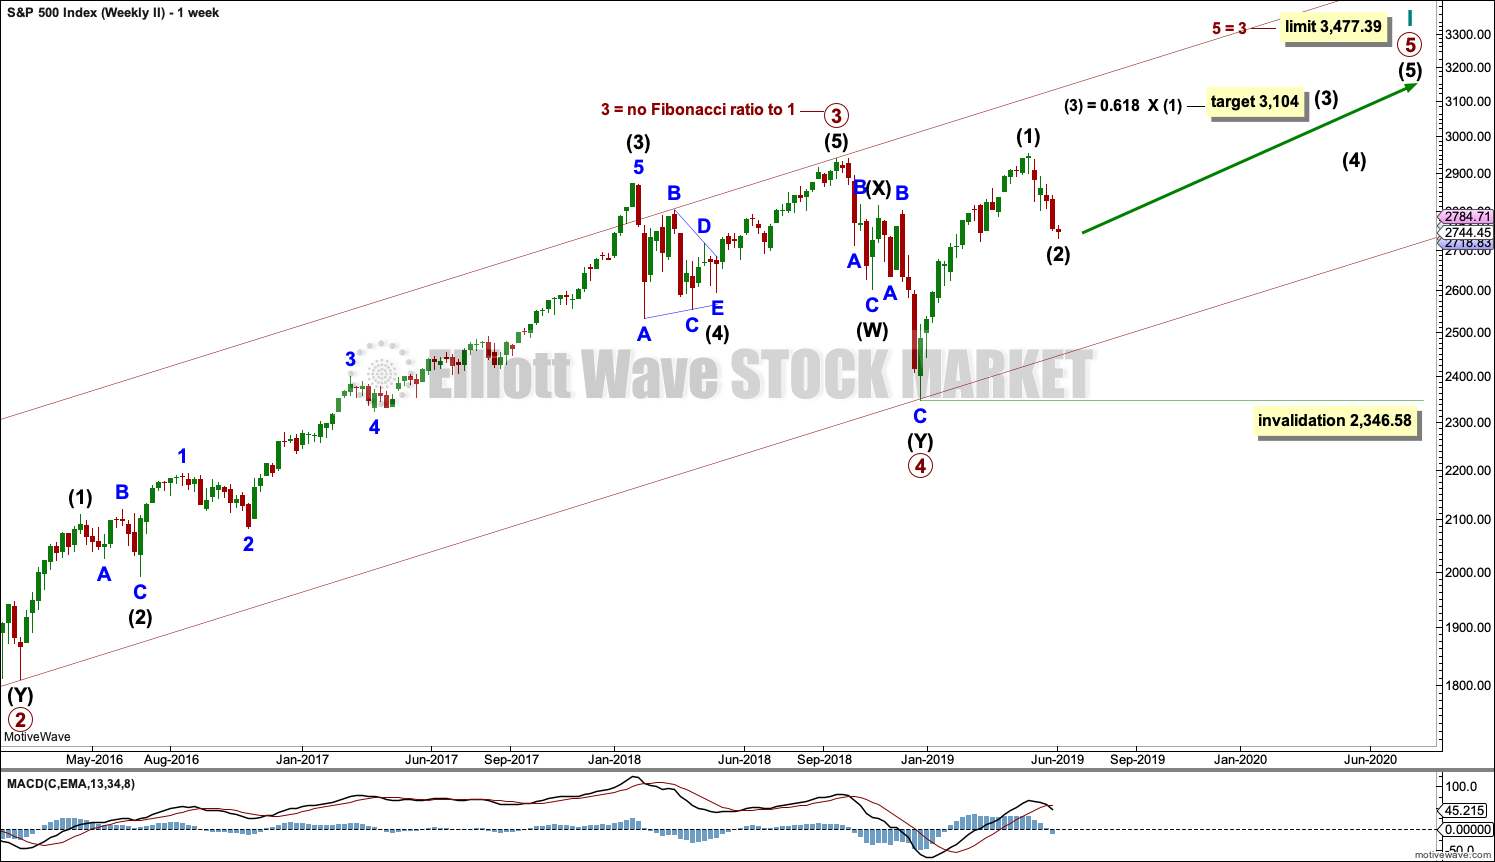
WEEKLY CHART
Click chart to enlarge.
This weekly chart is almost identical to the first weekly chart, with the sole exception being the degree of labelling.
This weekly chart moves the degree of labelling for the impulse beginning in March 2009 all down one degree. This difference is best viewed on monthly charts.
The impulse is still viewed as nearing an end; a fifth wave is still seen as needing to complete higher. This wave count labels it primary wave 5.
ALTERNATE WAVE COUNT
WEEKLY CHART
Click chart to enlarge.
It is possible that for the second wave count cycle wave I could be complete. Primary wave 5 may be seen as a complete five wave impulse on the daily chart.
If cycle wave I is complete, then cycle wave II may meet the definition of a bear market with a 20% drop in price at its end.
Within cycle wave I, primary wave 1 was a very long extension and primary wave 3 was shorter than primary wave 1 and primary wave 5 was shorter than primary wave 3. Because primary wave 1 was a long extension cycle wave II may end within the price range of primary wave 2, which was from 2,132 to 1,810. The 0.382 retracement of cycle wave I is within this range.
Cycle wave II may not move beyond the start of cycle wave I below 666.79.
This wave count does not have support at this time from classic technical analysis.
DAILY CHART
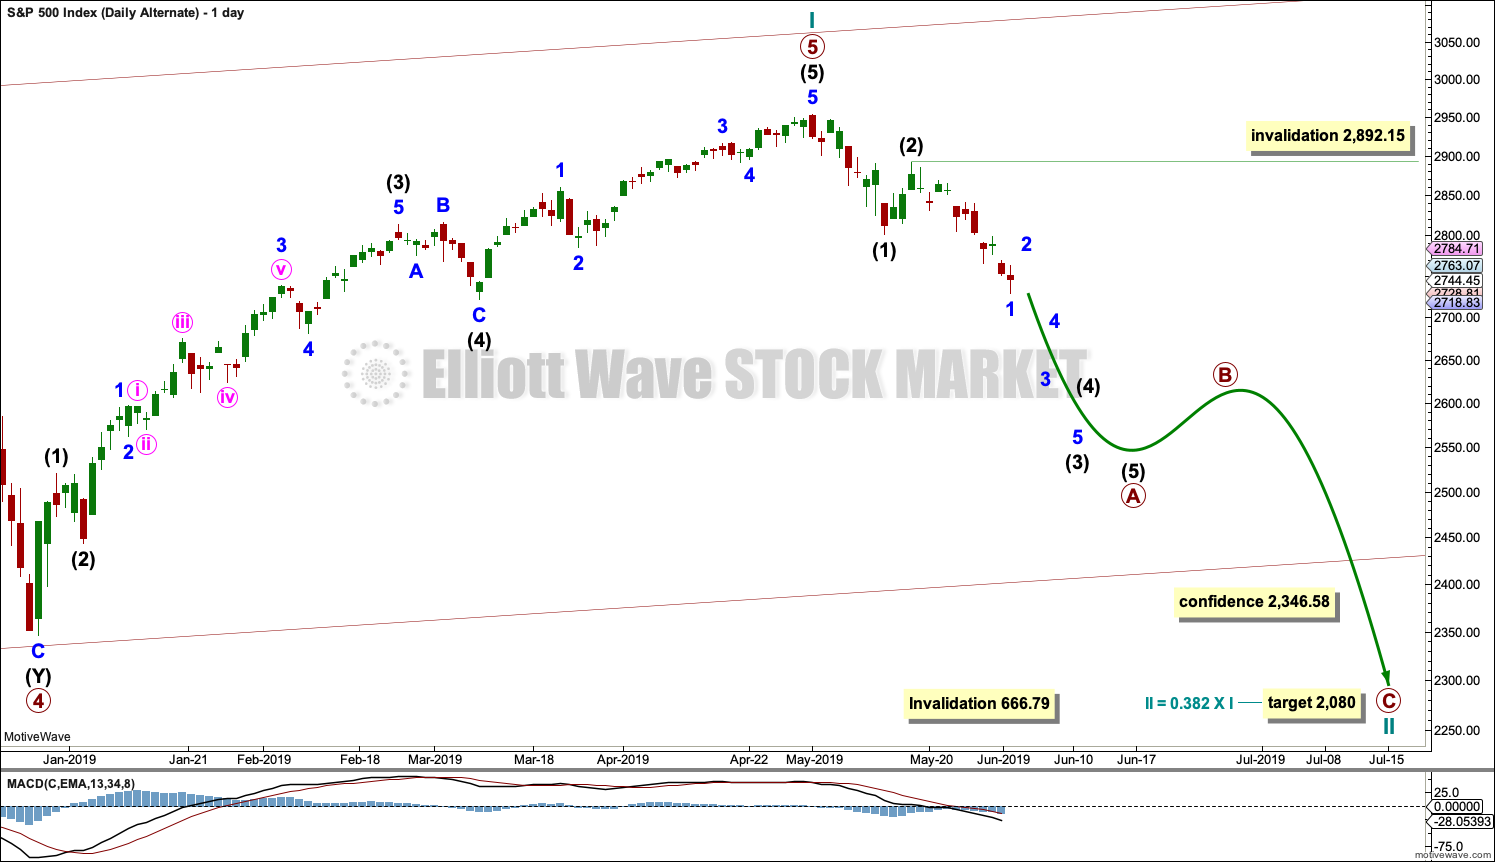
Click chart to enlarge.
The most likely structure for cycle wave II would be a zigzag. Within a zigzag, primary wave A would subdivide as a five wave structure, most likely an impulse. Within the impulse of primary wave A, so far intermediate waves (1) and (2) may be complete and intermediate wave (3) has moved below the end of intermediate wave (1) and may be incomplete.
Intermediate wave (3) would reach 1.618 the length of intermediate wave (1) at 2,645.
Intermediate wave (3) may only subdivide as an impulse. Within the impulse, minor wave 1 may be complete at today’s low. Minor wave 2 may not move beyond the start of minor wave 1 above 2,892.15. At this stage, a new high above this point would see this alternate wave count discarded.
Within the zigzag, primary wave B may not move beyond the start of primary wave A.
TECHNICAL ANALYSIS
WEEKLY CHART
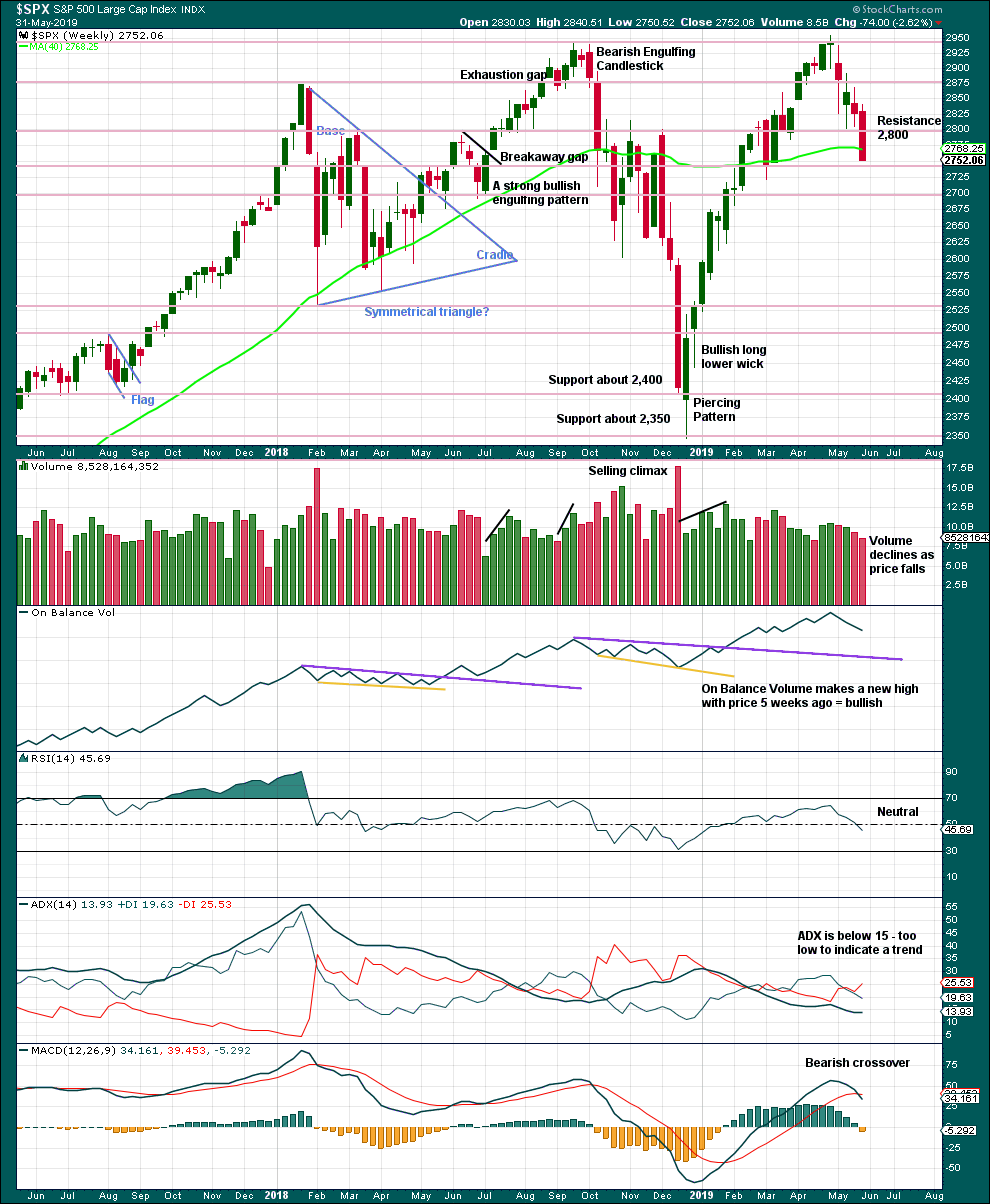
Click chart to enlarge. Chart courtesy of et=”_blank”>StockCharts.com.
There is an upwards trend from the low in December 2018, a series of higher highs and higher lows with a new all time high on the 30th of April 2019. The last swing low at 2,785.02 on the 25th of March has now been breached, so a trend change is now possible.
Last weekly candlestick closes with strong downwards movement and almost no lower wick. The lack of a lower wick strongly suggests more downwards movement this week. It is possible that downwards movement to begin the week for Monday has fulfilled this expectation, but it is also possible that it may continue.
DAILY CHART
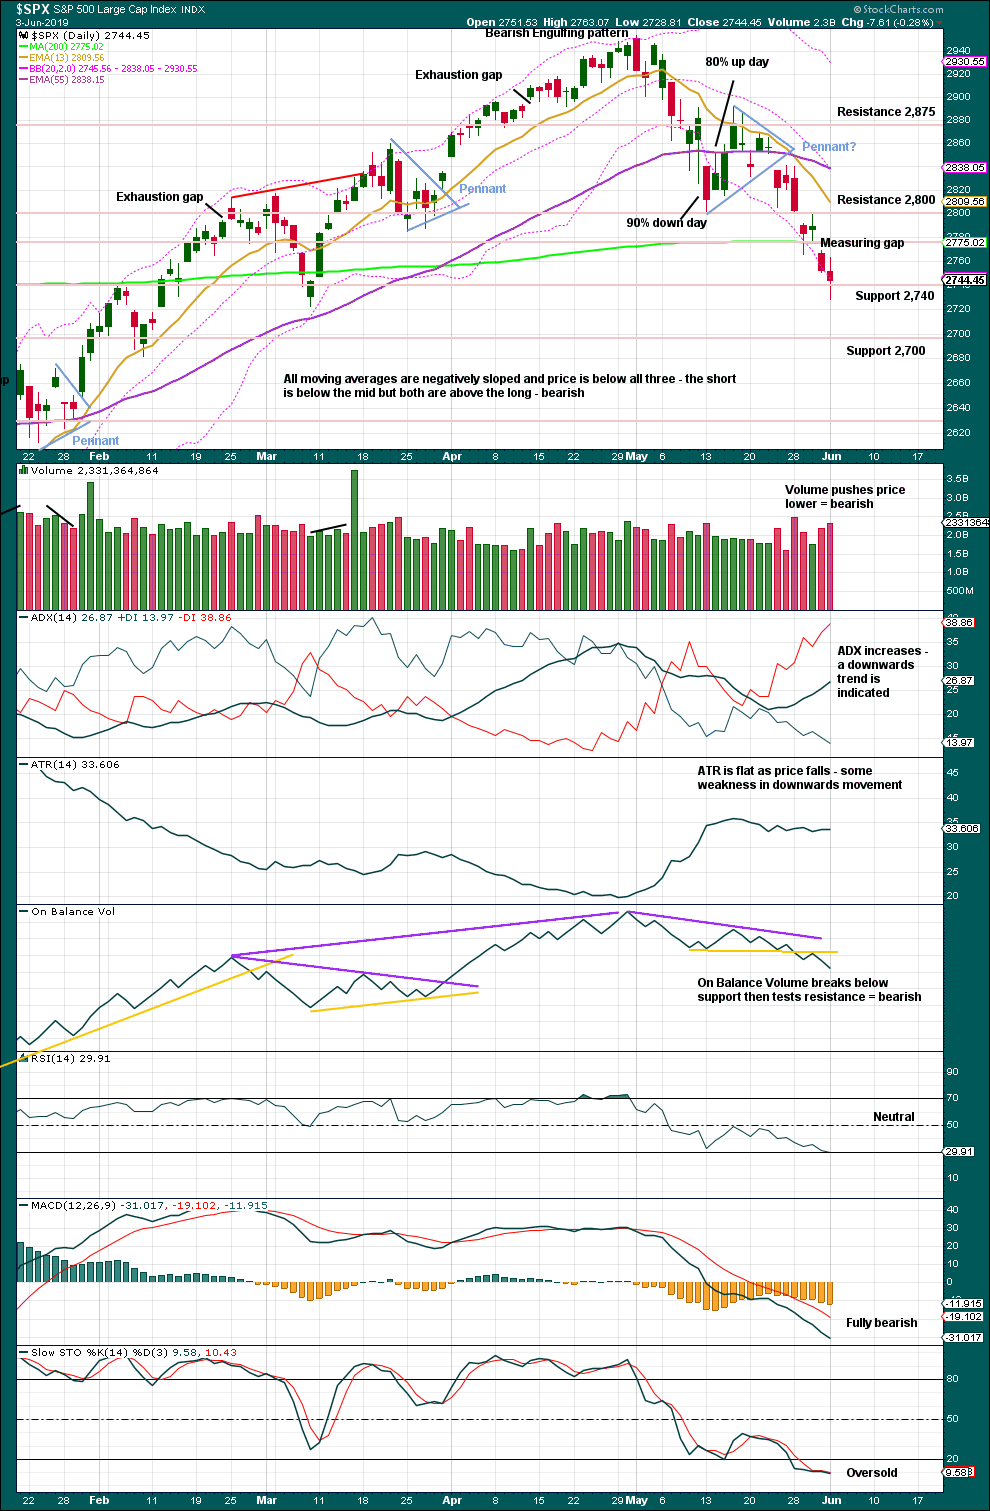
Click chart to enlarge. Chart courtesy of StockCharts.com.
A small pennant pattern may be complete and followed by a downwards breakout, which has support from volume. The target is about 2,690. The last measuring gap may also calculate a target about 2,694, which is very close to the target from the pennant. If price keeps falling here, then this area would be a possible target zone.
When price is trending, as it is now, Stochastics may remain extreme for a reasonable period of time. Only when Stochastics has been oversold for some time and then exhibits bullish divergence with price shall it be indicating an end to downwards movement.
Declining to flat ATR as price falls supports the first two Elliott wave counts and indicates the alternate looks less likely.
Lowry’s data today indicates up volume dominated at 72% and advances dominated at 65%, and Buying Power gained 3 points while Selling Pressure lost 3 points. The rebound at the end of this session had strength.
BREADTH – AD LINE
WEEKLY CHART
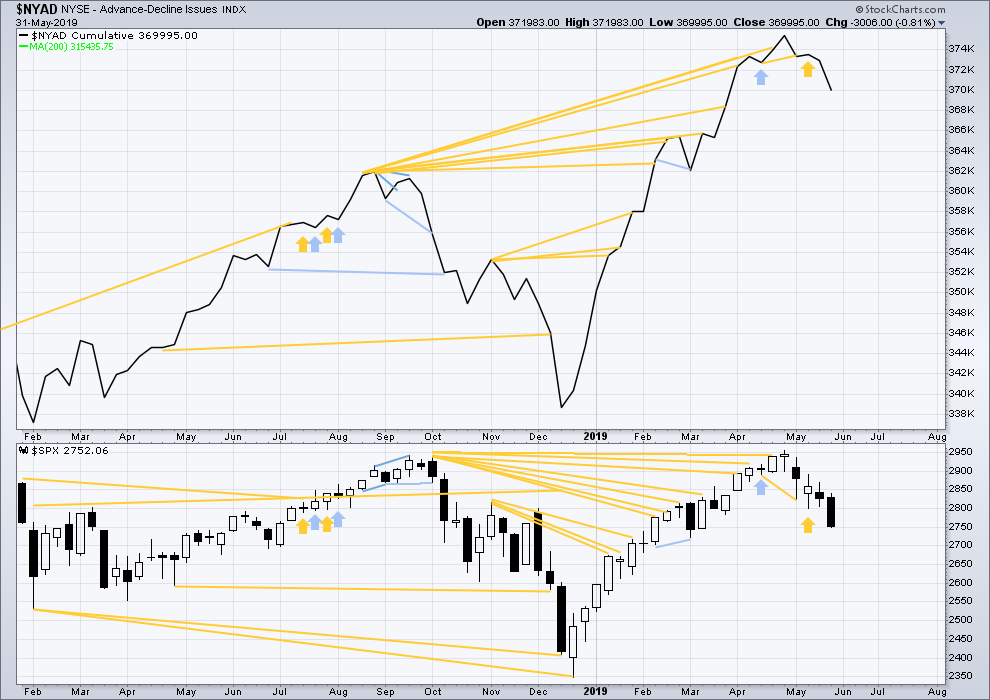
Click chart to enlarge. Chart courtesy of StockCharts.com. So that colour blind members are included, bearish signals
will be noted with blue and bullish signals with yellow.
Bear markets from the Great Depression and onwards have been preceded by an average minimum of 4 months divergence between price and the AD line with only two exceptions in 1946 and 1976. With the AD line making a new all time high on the 3rd of May, the end of this bull market and the start of a new bear market is very likely a minimum of 4 months away, which is the beginning of September 2019.
In all bear markets in the last 90 years there is some positive correlation (0.6022) between the length of bearish divergence and the depth of the following bear market. No to little divergence is correlated with more shallow bear markets. Longer divergence is correlated with deeper bear markets.
If a bear market does develop here, it comes after no bearish divergence. It would therefore more likely be shallow. The alternate Elliott wave count outlines this potential scenario.
Price has moved lower last week. Neither price nor the AD line have made new lows below the prior swing low of the week of the 4th of March. There is no new mid-term divergence.
DAILY CHART
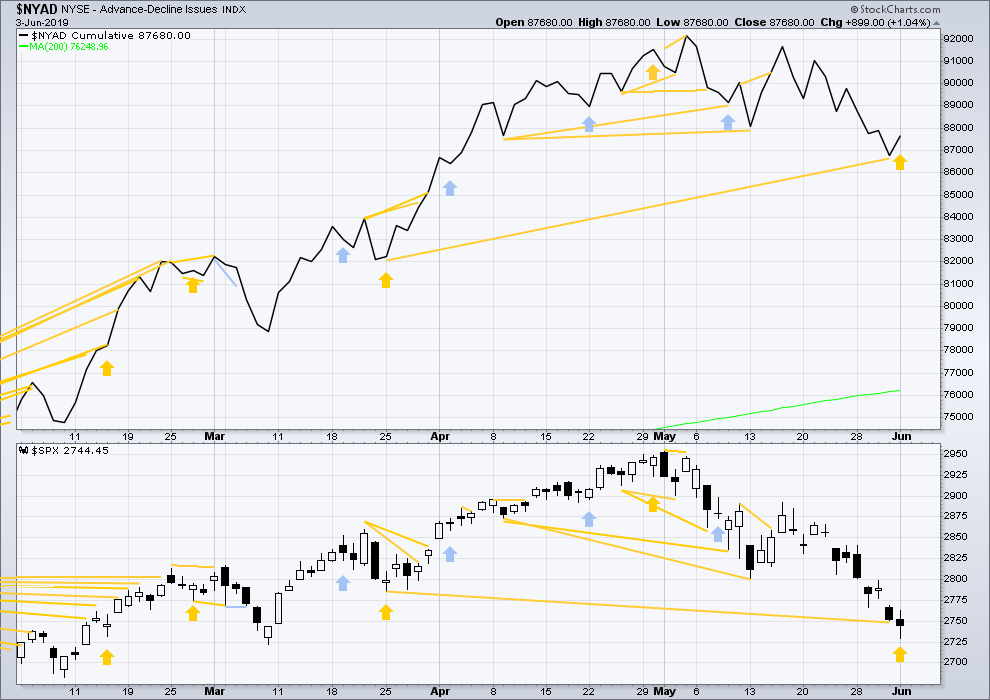
Click chart to enlarge. Chart courtesy of StockCharts.com. So that colour blind members are included, bearish signals
will be noted with blue and bullish signals with yellow.
Breadth should be read as a leading indicator.
Price has now made a new mid-term low below the prior low of the 25th of March, but the AD line has not. Price is falling faster than market breadth. This divergence is bullish for the mid term and supports the view that this pullback is a counter trend movement within an ongoing bull market and not the start of a fully fledged bear market.
In addition to mid-term bullish divergence, there is now today a single day of sharp bullish divergence. Price today moved lower, but the AD line moved higher.
VOLATILITY – INVERTED VIX CHART
WEEKLY CHART
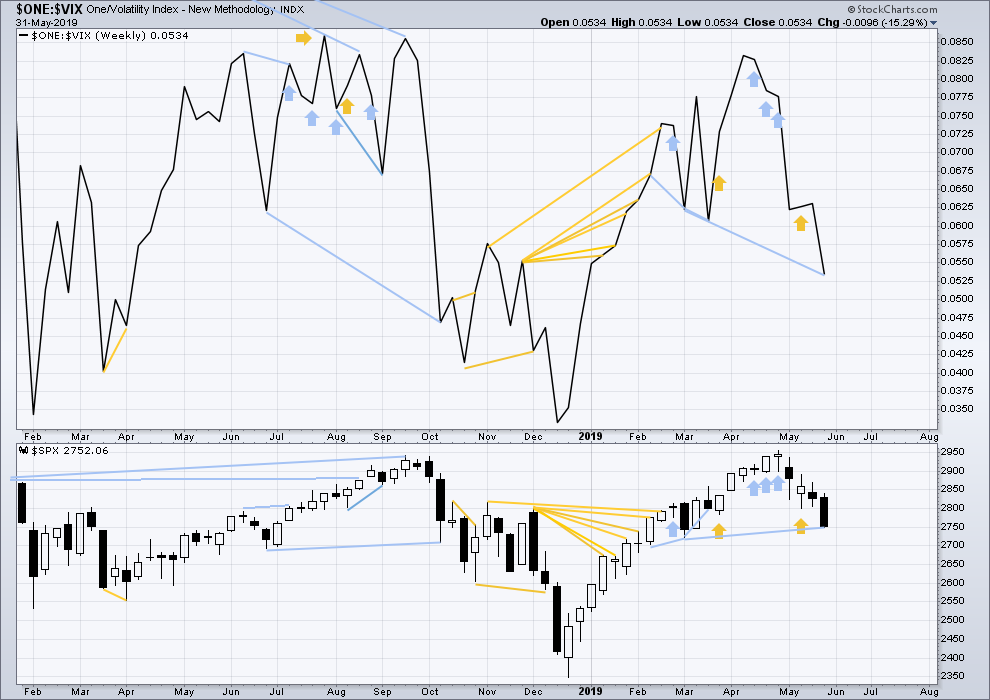
Click chart to enlarge. Chart courtesy of StockCharts.com. So that colour blind members are included, bearish signals
will be noted with blue and bullish signals with yellow.
Inverted VIX has made a new low below the low of the 4th of March, but price has not. Downwards movement comes with a strong increase in VIX, which is increasing faster than price. This divergence is bearish, but will not be given much weight in this analysis at this time.
If bearish divergence develops further, then it may be given some weight.
DAILY CHART
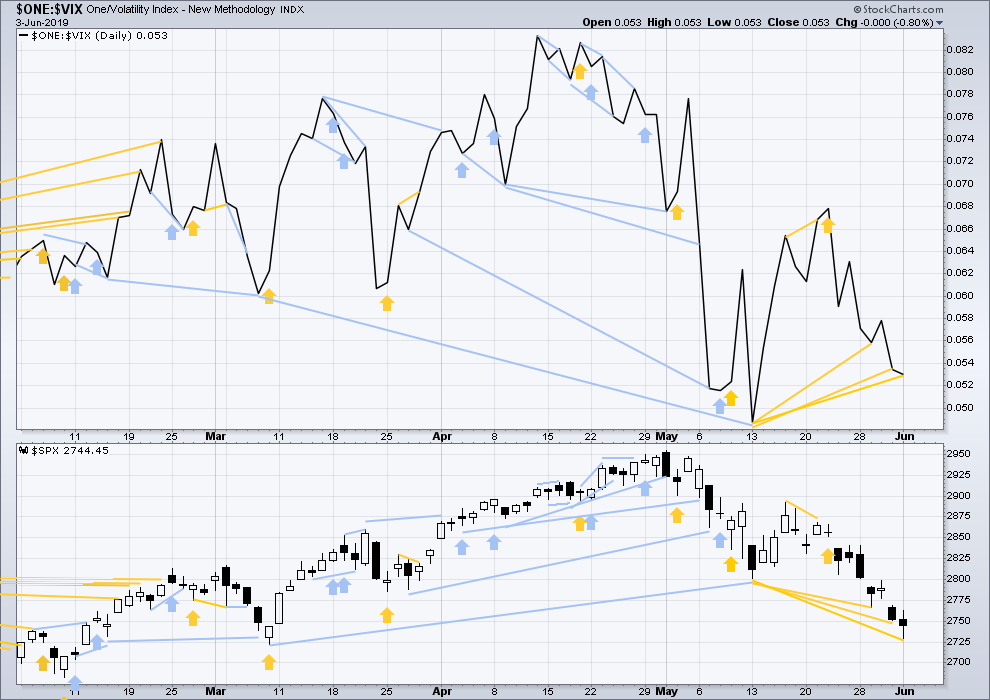
Click chart to enlarge. Chart courtesy of StockCharts.com. So that colour blind members are included, bearish signals
will be noted with blue and bullish signals with yellow.
Price has again made a new low below the prior low of the 13th of May, but inverted VIX has not. For the short term, the fall in price does not come with a corresponding increase in VIX. This divergence is bullish.
DOW THEORY
Dow Theory confirmed a bear market in December 2018. This does not necessarily mean a bear market at Grand Super Cycle degree though; Dow Theory makes no comment on Elliott wave counts. On the 25th of August 2015 Dow Theory also confirmed a bear market. The Elliott wave count sees that as part of cycle wave II. After Dow Theory confirmation of a bear market in August 2015, price went on to make new all time highs and the bull market continued.
DJIA: 23,344.52 – a close on the 19th of December at 23,284.97 confirms a bear market.
DJT: 9,806.79 – price has closed below this point on the 13th of December.
S&P500: 2,532.69 – a close on the 19th of December at 2,506.96 provides support to a bear market conclusion.
Nasdaq: 6,630.67 – a close on the 19th of December at 6,618.86 provides support to a bear market conclusion.
With all the indices having moved higher following a Dow Theory bear market confirmation, Dow Theory would confirm a bull market if the following highs are made:
DJIA: 26,951.81
DJT: 11,623.58
S&P500: 2,940.91 – a new all time high has been made on the 29th of April 2019.
Nasdaq: 8,133.30 – a new high has been made on 24th of April 2019.
Published @ 09:07 p.m. EST.
—
Careful risk management protects your trading account(s).
Follow my two Golden Rules:
1. Always trade with stops.
2. Risk only 1-5% of equity on any one trade.
—
New updates to this analysis are in bold.
Here are some useful levels. The chart is ES Heikin-Ashi 4 hour candles.
The 2820.50 level seems like a perfectly reasonable place for a retracement to begin. The 2877.25 level is a good overhead target to be aware of.
And to finish my thought …
Rodney, you were interested in adding to your 1/3 long stake. A good spot might be when the ES gets back down to the 2785.50 neighborhood.
Lovin’ RUT, doubled down on an underwater position at open and it’s been running up ever since.
Livin’ dangerously and surviving to tell about it. Sweet!
Always watchin’ my levels…massive cluster at 2811-15 up ahead. Any sign of a pivot there should be taken seriously.
Some reason to believe a ii down might be starting right here. At top of my volatility band (upper purple line) on hourly chart. Price is pretty close to last Thursday’s swing high. And the fibo cluster above (including the low of the A down) is within spitting distance. Momentum is waning and price bars are contracting…
From @CiovaccoCapital on Twitter about noon, Eastern… “Intraday advancing volume is running at roughy 82% on both NYSE and NASDAQ.”
So that 3rd wave may be here. Like Rodney and others, I’ll be looking for a decent place to hop on for hopefully a nice ride.
Hourly chart updated:
No change so far. Price is doing as expected.
Volume, On Balance Volume and the AD line will be important today. Signs of strength would support the wave count. Reasonable signs of weakness would suggest an alternate idea, suggested by Kevin, may be considered.
I want to see 2,799 breached, then the channel breached, for confidence. And for this count it MUST come with some strength.
Well, this is a rally for sure. Why didn’t anyone tell me a 1/3 long position was not enough? Now I need to decide how to deploy the rest. Should I wait for a second wave? Or should I get in right now? Should I wait for confirmation by breaking the channel line? Decisions, decisions.
I think I will wait for a retest of today’s gap up. The upper boundary of the gap is at SPX 2762.
Oh man so many decisions, not sure what kinds of pullback we’ll get if the 3rd has indeed started
Do be careful.
This may be a counter-trend rally folks.
Tremendous technical damage inflicted the last few weeks and we do have nine confirmed Hindenburg Omens on the clock.
Tight stops on long positions are in order….
Yep. For sure!
If premarket futures hold, we will have a strong 0.7% gap up opening. This will be a sign of strength. I will be watching the McClellan Oscillator closely as we rally off these lows. To confirm the upwards movement and a low being in place, we need to see it come off the -40 level and cross above the zero level. Next it would need to go over +20. If this happens it is an indication of strong breadth which will be accompanied by strong upward movement in the AD Line. If we rally and don’t get this sort of action, we can be looking at Kevin’s feared X wave. I think we will see the former.
The Fear-Greed index is at 24, Extreme Fear. Out of such positions a contrarian view is advised and bull market rallies are born.
BTW – Lara when I wrote late yesterday that we could all meet up at your place for a visit, I was not referring to NZ. I meant in Texas! I am sure your family would love to have a hundred strange market nerds showing up en masse. (he-he)
Given she knows us Rodney, it’s shocking they let her in the country at all…
LOL
Sure, come on down to Texas folks! I can’t show you around though, I’m geographically challenged in the northern hemisphere and I don’t know where anything is here.
And I can’t drive either so….
Texas sure is beautiful y’all (working on my Texas accent, but TBH it’s horrible)
Do I want to think at all about the possibility this is not a (almost/maybe complete) primary 2 down…but rather merely an intermediate W of a primary 2 down? Looks like there’s more than enough “room” below for such a an overall WXY structure. Should we worry that we might confuse early new price movement up as a motive wave when in fact it may play out as an X wave?
Tell me for some reason that’s not possible here, please. I dislike X waves. Particularly surprise X waves.
Sorry Kevin, I can’t be the one to tell you it can’t be an X wave.
It could be.
If upwards movement lacks strength, I’ll be publishing this idea. Let us see how volume and breadth behave on the way up.
But I’m also well aware that intermediate (A) had a nice strong low and intermediate (B) began with strength in an 80% up day.
Thanks Lara. Awareness is key!!
I’m a-gonna slip right in here…