
Downwards movement was expected as most likely for Friday’s session, which is exactly what happened.
The first target at two degrees can now be calculated.
Summary: The low of December 2018 is expected to most likely remain intact, and this pullback is expected to be followed by a strong third wave up to new all time highs.
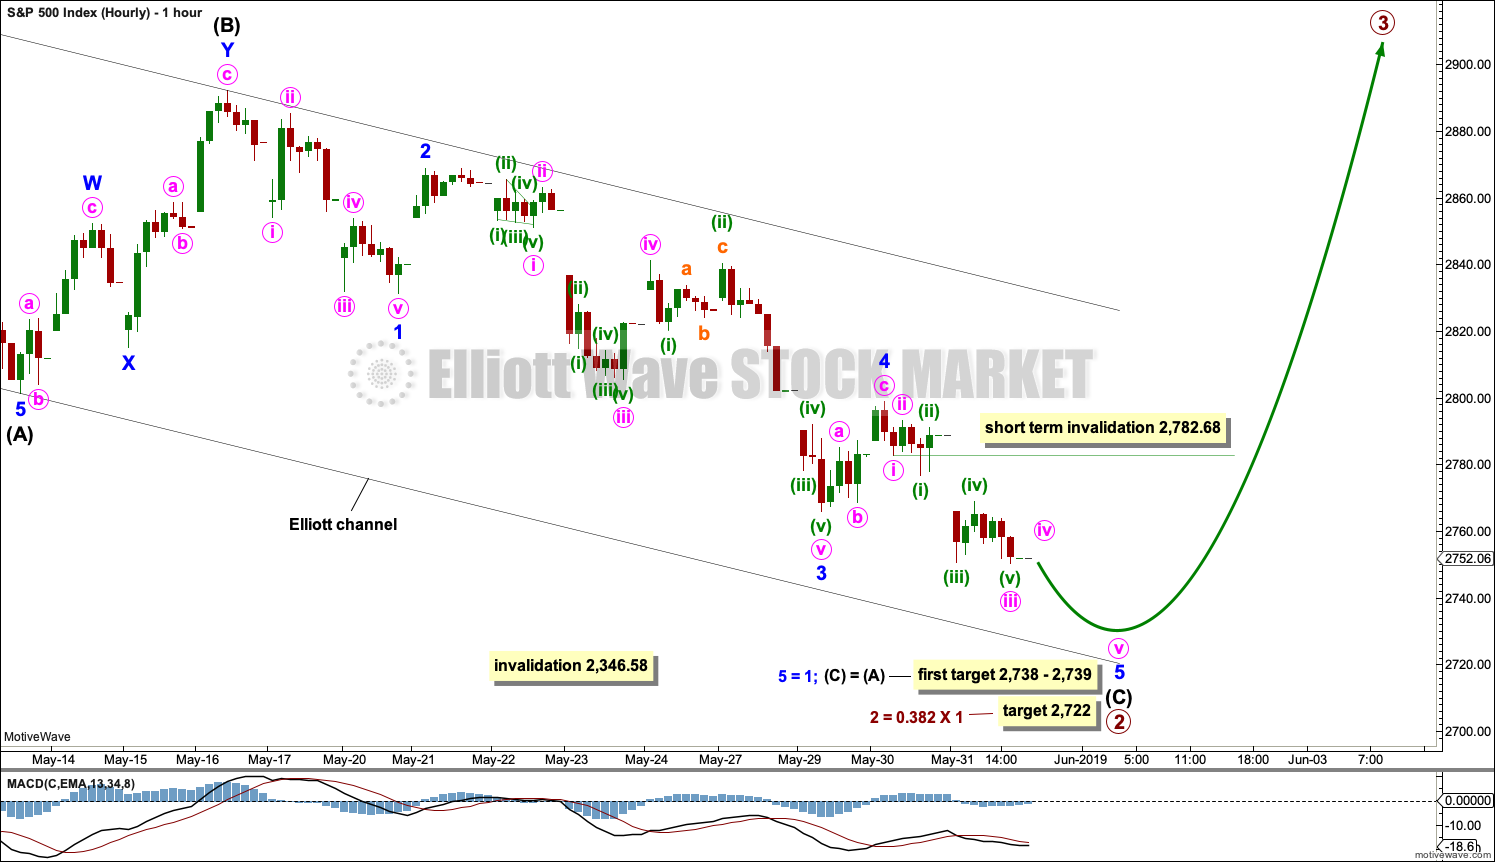
A pullback may end next week. The first target is now at 2,738 to 2,739, which has a good probability.
The second target is about 2,722 and may see price find support about the lower edge of the black Elliott channel.
If price keeps falling through these targets, then a classic target calculated from the pennant pattern is about 2,690. This target looks too low.
The alternate wave count considers the possibility that a relatively short lived bear market may have begun. The target is at 2,080. This wave count has a fairly low probability, but it is a possibility that must be acknowledged.
The biggest picture, Grand Super Cycle analysis, is here.
Monthly charts were last published here, with video here. There are two further alternate monthly charts here, with video here.
ELLIOTT WAVE COUNTS
The first two Elliott wave counts below will be labelled First and Second. They may be about of even probability. When the fifth wave currently unfolding on weekly charts may be complete, then these two wave counts will diverge on the severity of the expected following bear market. To see an illustration of this future divergence monthly charts should be viewed.
The alternate Elliott wave count has a very low probability.
FIRST WAVE COUNT
WEEKLY CHART
Click chart to enlarge.
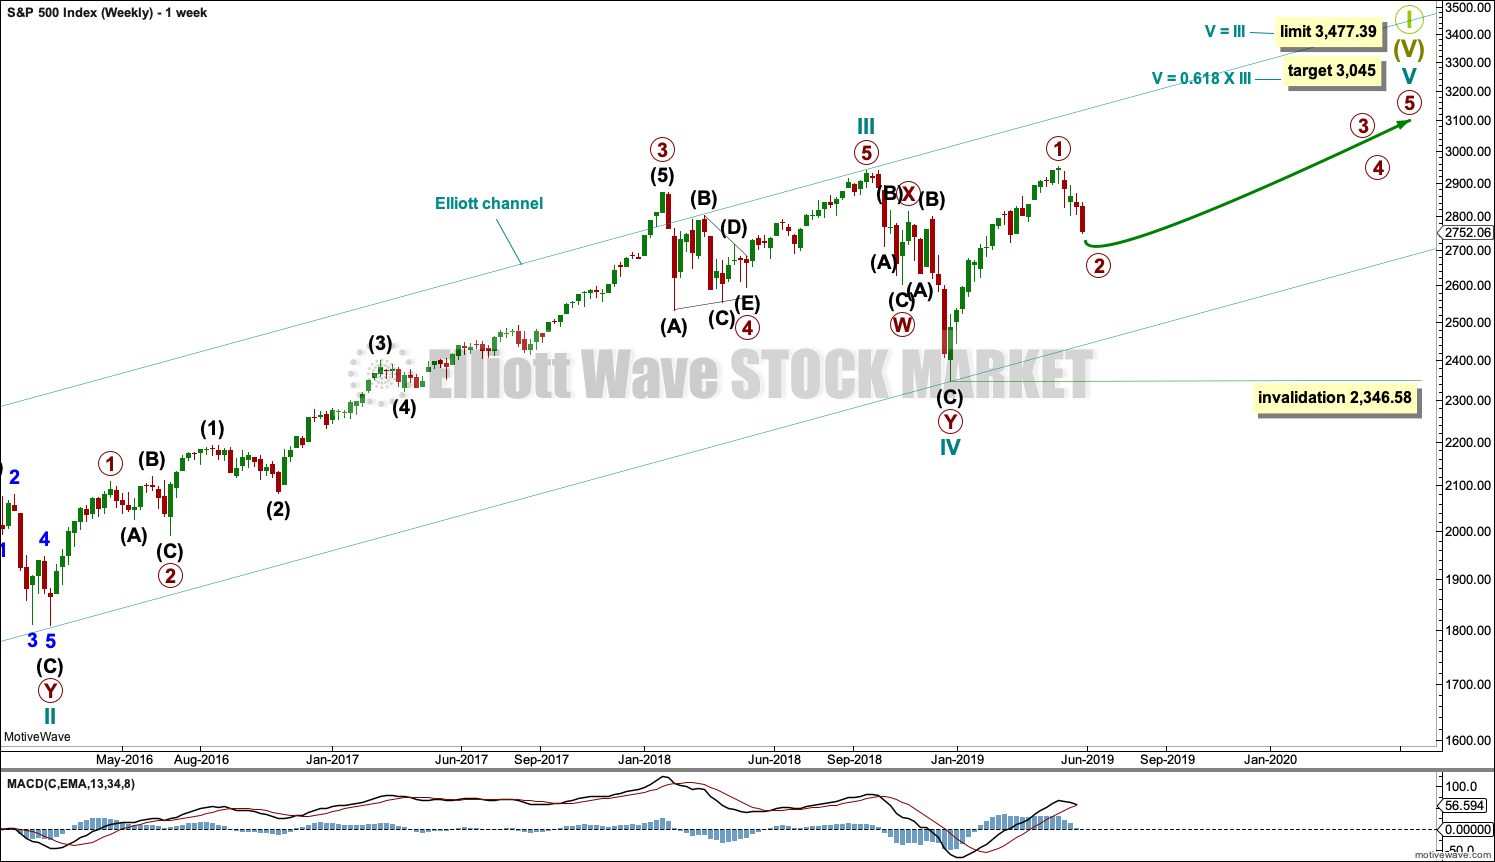
The basic Elliott wave structure consists of a five wave structure up followed by a three wave structure down (for a bull market). This wave count sees the bull market beginning in March 2009 as an incomplete five wave impulse and now within the last fifth wave, which is labelled cycle wave V. This impulse is best viewed on monthly charts. The weekly chart focusses on the end of it.
Elliott wave is fractal. This fifth wave labelled cycle wave V may end a larger fifth wave labelled Super Cycle wave (V), which may end a larger first wave labelled Grand Super Cycle wave I.
The teal Elliott channel is drawn using Elliott’s first technique about the impulse of Super Cycle wave (V). Draw the first trend line from the end of cycle wave I (off to the left of the chart, the weekly candlestick beginning 30th November 2014) to the end of cycle wave III, then place a parallel copy on the end of cycle wave II. This channel perfectly shows where cycle wave IV ended at support. The strongest portion of cycle wave III, the end of primary wave 3, overshoots the upper edge of the channel. This is a typical look for a third wave and suggests the channel is drawn correctly and the way the impulse is counted is correct.
Within Super Cycle wave (V), cycle wave III is shorter than cycle wave I. A core Elliott wave rule states that a third wave may never be the shortest. For this rule to be met in this instance, cycle wave V may not be longer in length than cycle wave III. This limit is at 3,477.39.
A final target is calculated at cycle degree for the impulse to end.
The structure of cycle wave V is focussed on at the daily chart level below.
Within cycle wave V, primary wave 2 may not move beyond the start of primary wave 1 below 2,346.58.
In historic analysis, two further monthly charts have been published that do not have a limit to upwards movement and are more bullish than this wave count. Members are encouraged to consider those possibilities (links below summary) alongside the wave counts presented on a daily and weekly basis.
DAILY CHART
Click chart to enlarge.
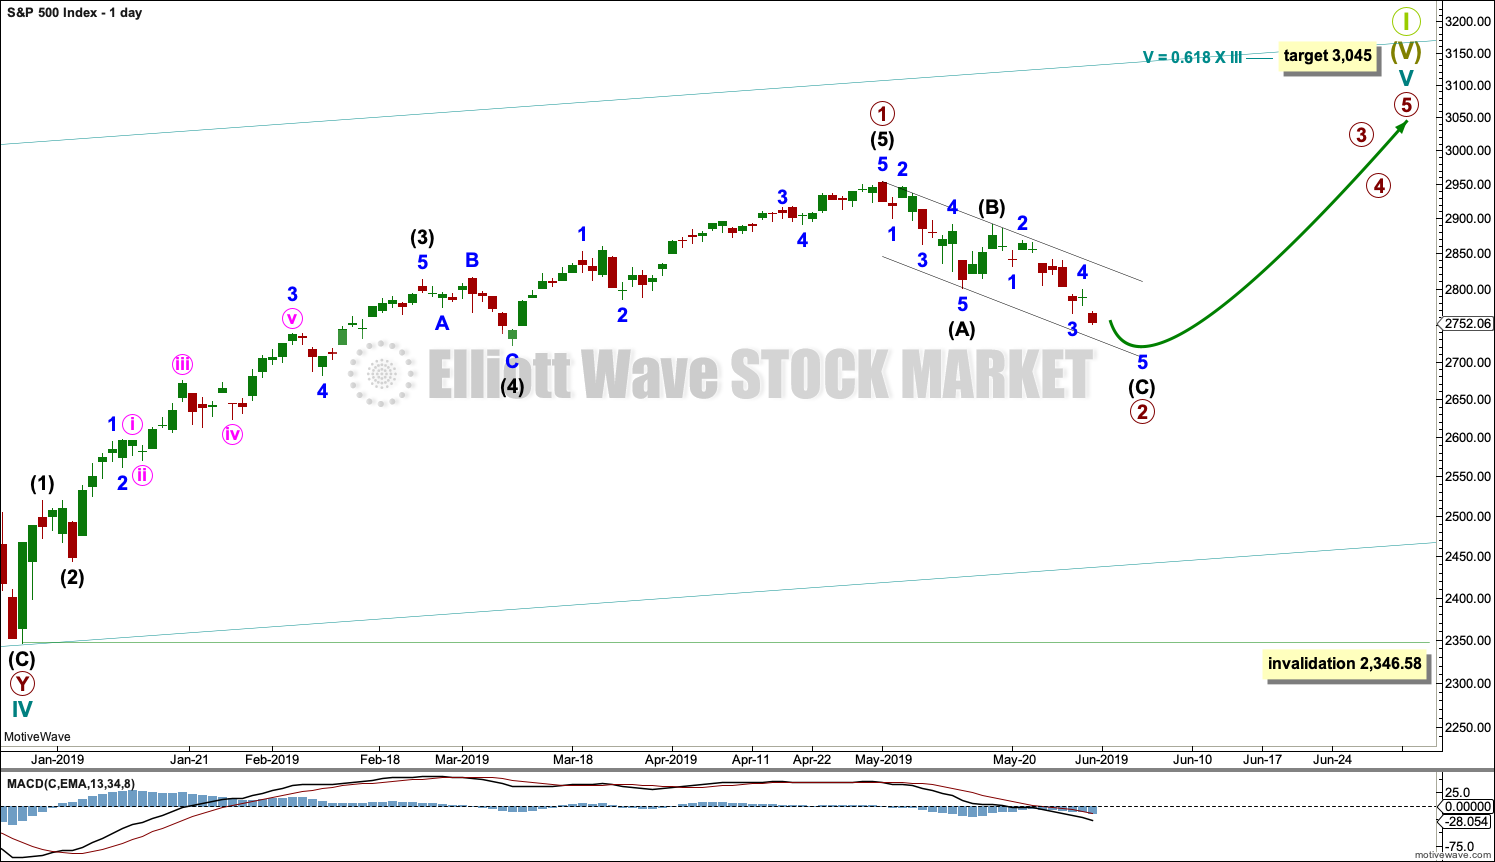
Cycle wave V must subdivide as a five wave motive structure. Within that five wave structure, primary wave 1 may be complete. Primary wave 2 may now continue lower as a zigzag, which may end next week.
Primary wave 3 must move above the end of primary wave 1.
When primary wave 3 is over, then primary wave 4 may be a shallow sideways consolidation that may not move into primary wave 1 price territory below 2,954.13.
Thereafter, primary wave 5 should move above the end of primary wave 3 to avoid a truncation.
Primary wave 2 may not move beyond the start of primary wave 1 below 2,346.58.
Draw a channel about primary wave 2 using Elliott’s technique. Draw the first trend line from the start of intermediate wave (A) to the end of intermediate wave (B), then place a parallel copy on the end of intermediate wave (A). Intermediate wave (C) may end when price finds support at the lower edge of this channel.
When the channel is breached by upwards movement, it shall be used as an indication that the pullback for primary wave 2 is over and primary wave 3 would then be expected to be underway.
HOURLY CHART
Click chart to enlarge.
Primary wave 2 may be an incomplete zigzag. This wave count expects downwards movement to complete intermediate wave (C) and in turn complete the zigzag of primary wave 2.
Minor wave 3 may be complete and would be 4.34 points short of 1.618 the length of minor wave 1. The most likely Fibonacci ratio for minor wave 5 would be equality in length with minor wave 1. The first target is now calculated at two degrees to a 1 point zone, which has a reasonable probability.
Minor wave 5 looks like it is subdividing as an impulse. Within the impulse, minute waves i through to iii may be complete. For the short term, when markets open on Monday, minute wave iv may not move into minute wave i price territory.
Intermediate wave (C) may end at support about the lower edge of the black Elliott channel.
SECOND WAVE COUNT
WEEKLY CHART
Click chart to enlarge.
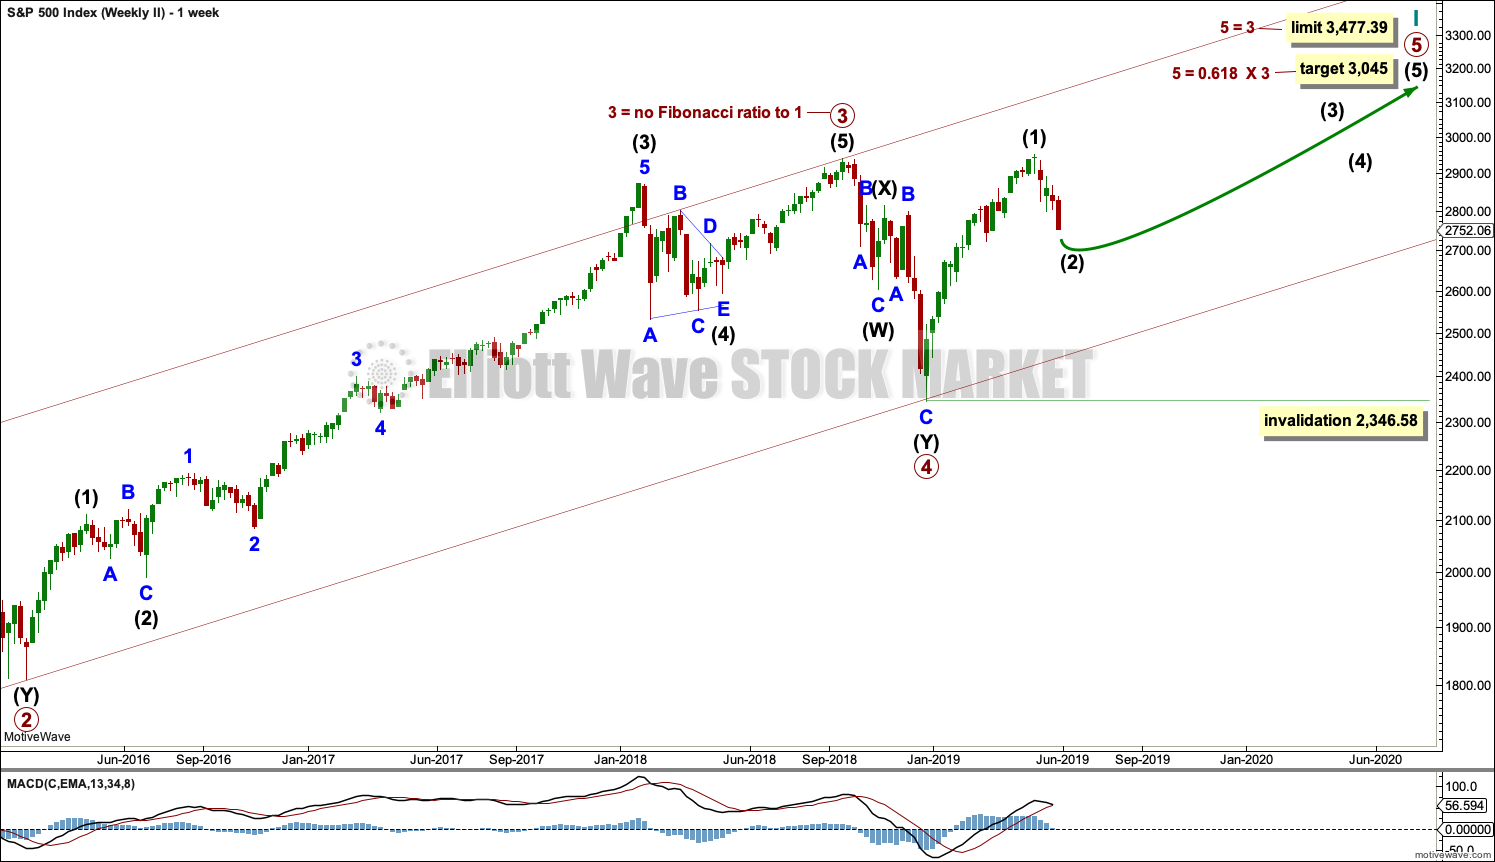
This weekly chart is almost identical to the first weekly chart, with the sole exception being the degree of labelling.
This weekly chart moves the degree of labelling for the impulse beginning in March 2009 all down one degree. This difference is best viewed on monthly charts.
The impulse is still viewed as nearing an end; a fifth wave is still seen as needing to complete higher. This wave count labels it primary wave 5.
ALTERNATE WAVE COUNT
WEEKLY CHART
Click chart to enlarge.
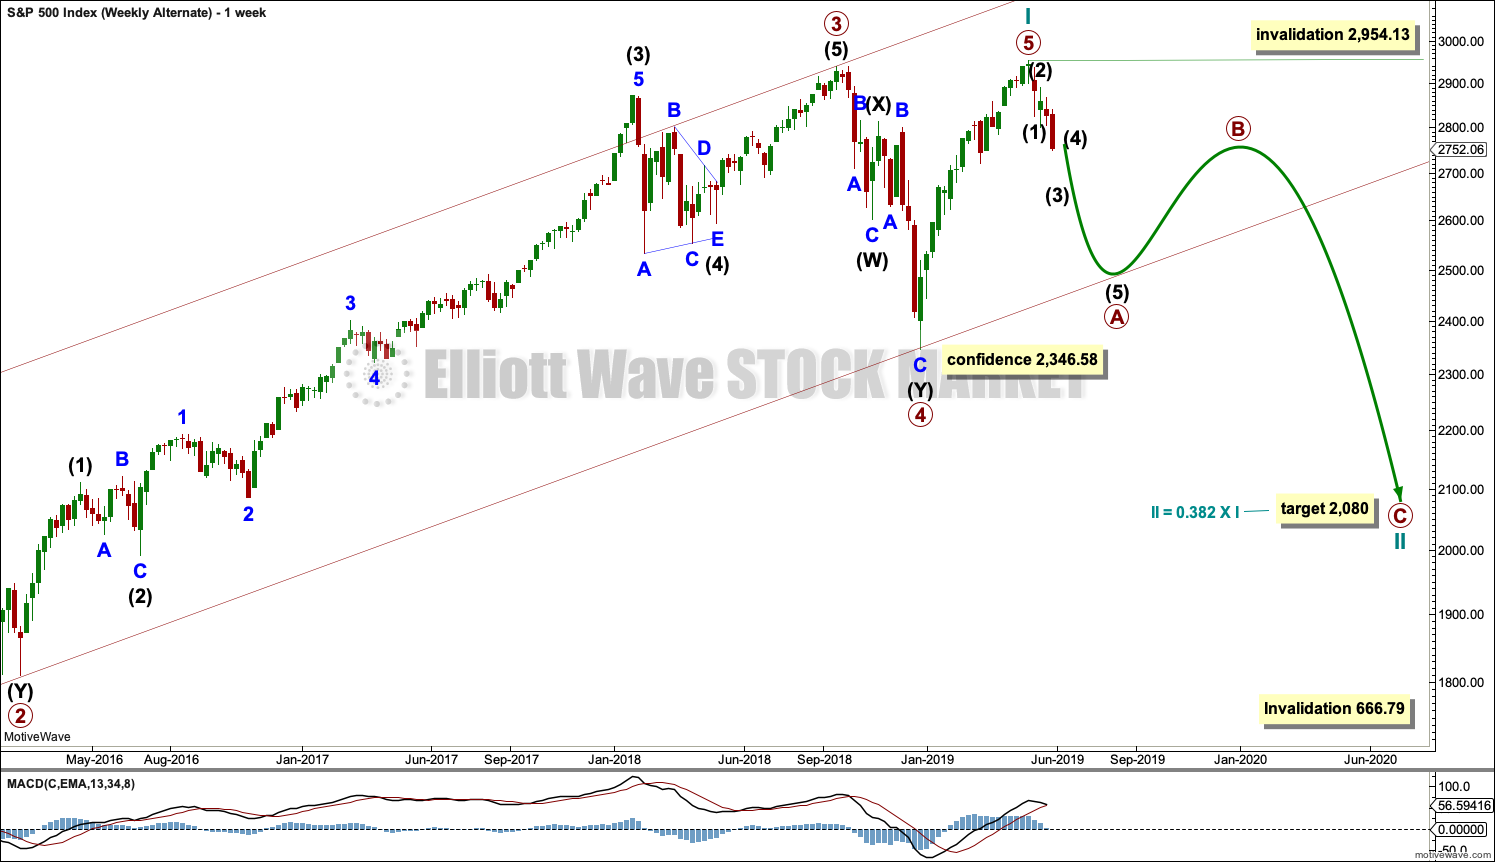
It is possible that for the second wave count cycle wave I could be complete. Primary wave 5 may be seen as a complete five wave impulse on the daily chart.
If cycle wave I is complete, then cycle wave II may meet the definition of a bear market with a 20% drop in price at its end.
Within cycle wave I, primary wave 1 was a very long extension and primary wave 3 was shorter than primary wave 1 and primary wave 5 was shorter than primary wave 3. Because primary wave 1 was a long extension cycle wave II may end within the price range of primary wave 2, which was from 2,132 to 1,810. The 0.382 retracement of cycle wave I is within this range.
Cycle wave II may not move beyond the start of cycle wave I below 666.79.
This wave count does not have support at this time from classic technical analysis.
DAILY CHART
Click chart to enlarge.
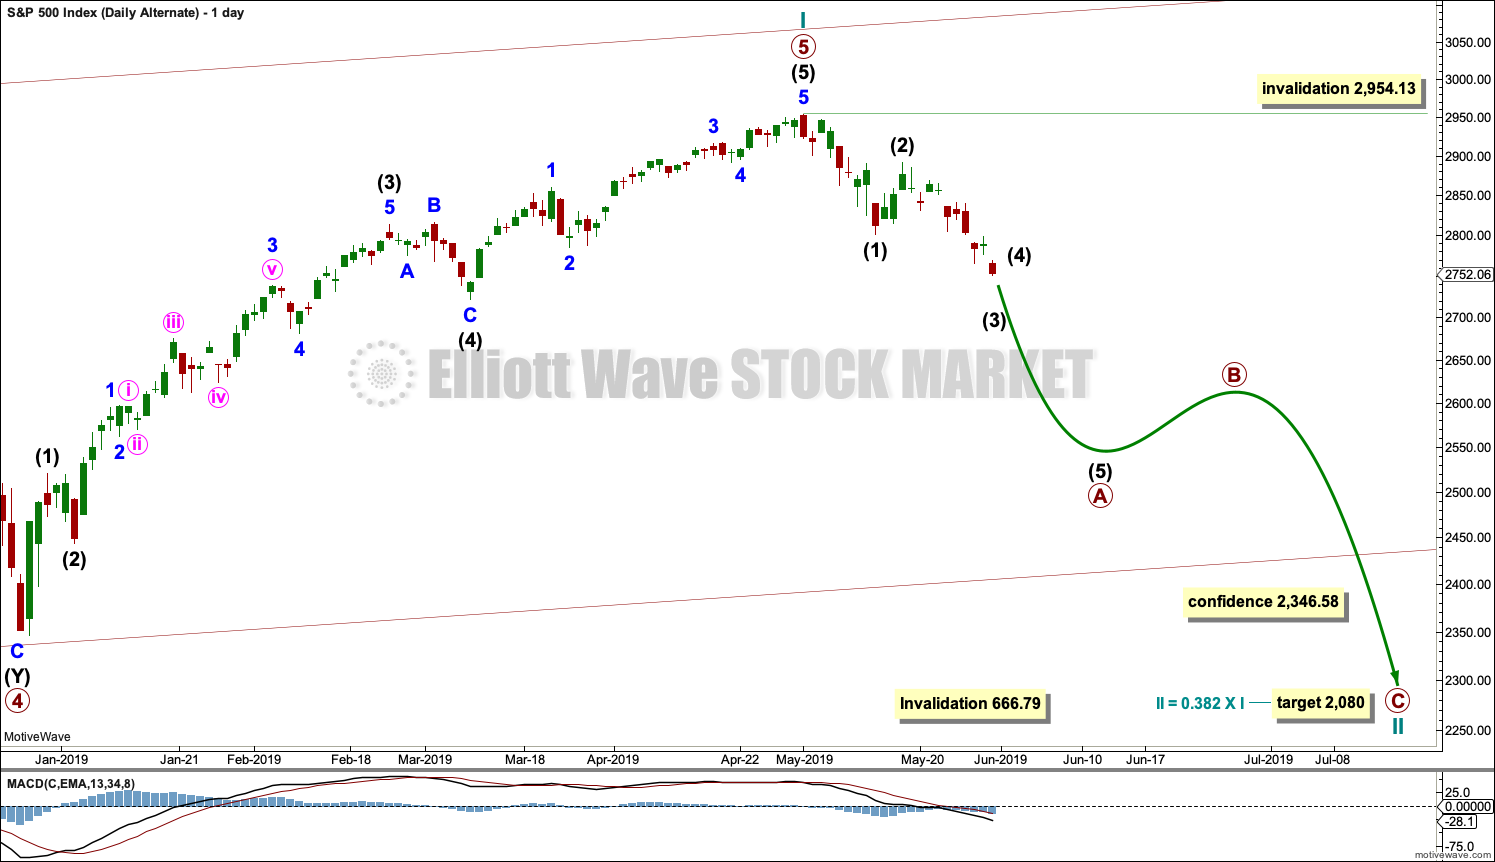
The most likely structure for cycle wave II would be a zigzag. Within a zigzag, primary wave A would subdivide as a five wave structure, most likely an impulse. Within the impulse of primary wave A, so far intermediate waves (1) and (2) may be complete and intermediate wave (3) has moved below the end of intermediate wave (1) and may be incomplete.
Intermediate wave (3) would reach 1.618 the length of intermediate wave (1) at 2,645.
Within the zigzag, primary wave B may not move beyond the start of primary wave A.
TECHNICAL ANALYSIS
WEEKLY CHART
Click chart to enlarge. Chart courtesy of et=”_blank”>StockCharts.com.
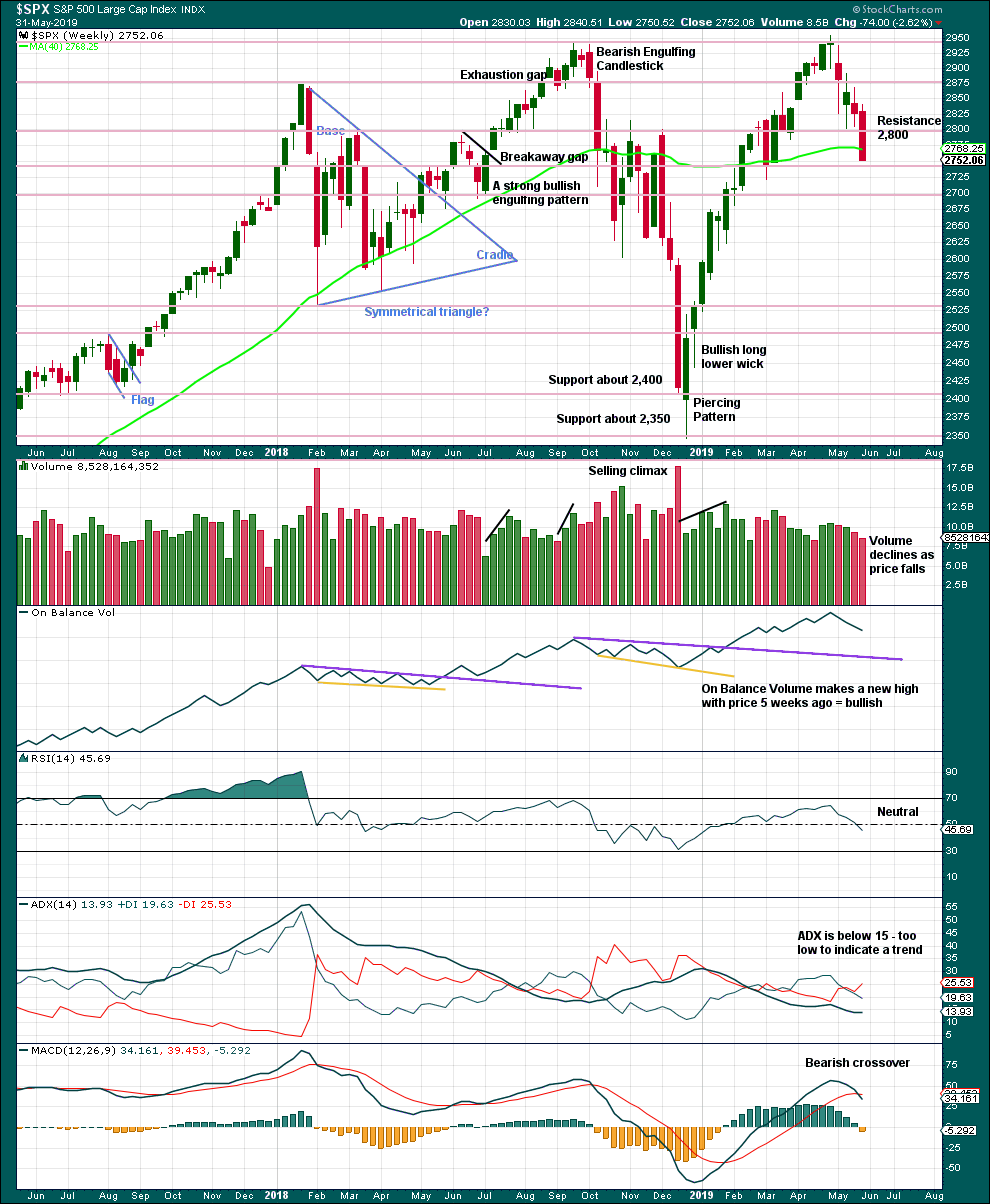
There is an upwards trend from the low in December 2018, a series of higher highs and higher lows with a new all time high on the 30th of April 2019. The last swing low at 2,785.02 on the 25th of March has now been breached, so a trend change is now possible.
This weekly candlestick closes with strong downwards movement and almost no lower wick. The lack of a lower wick strongly suggests more downwards movement next week.
DAILY CHART
Click chart to enlarge. Chart courtesy of StockCharts.com.
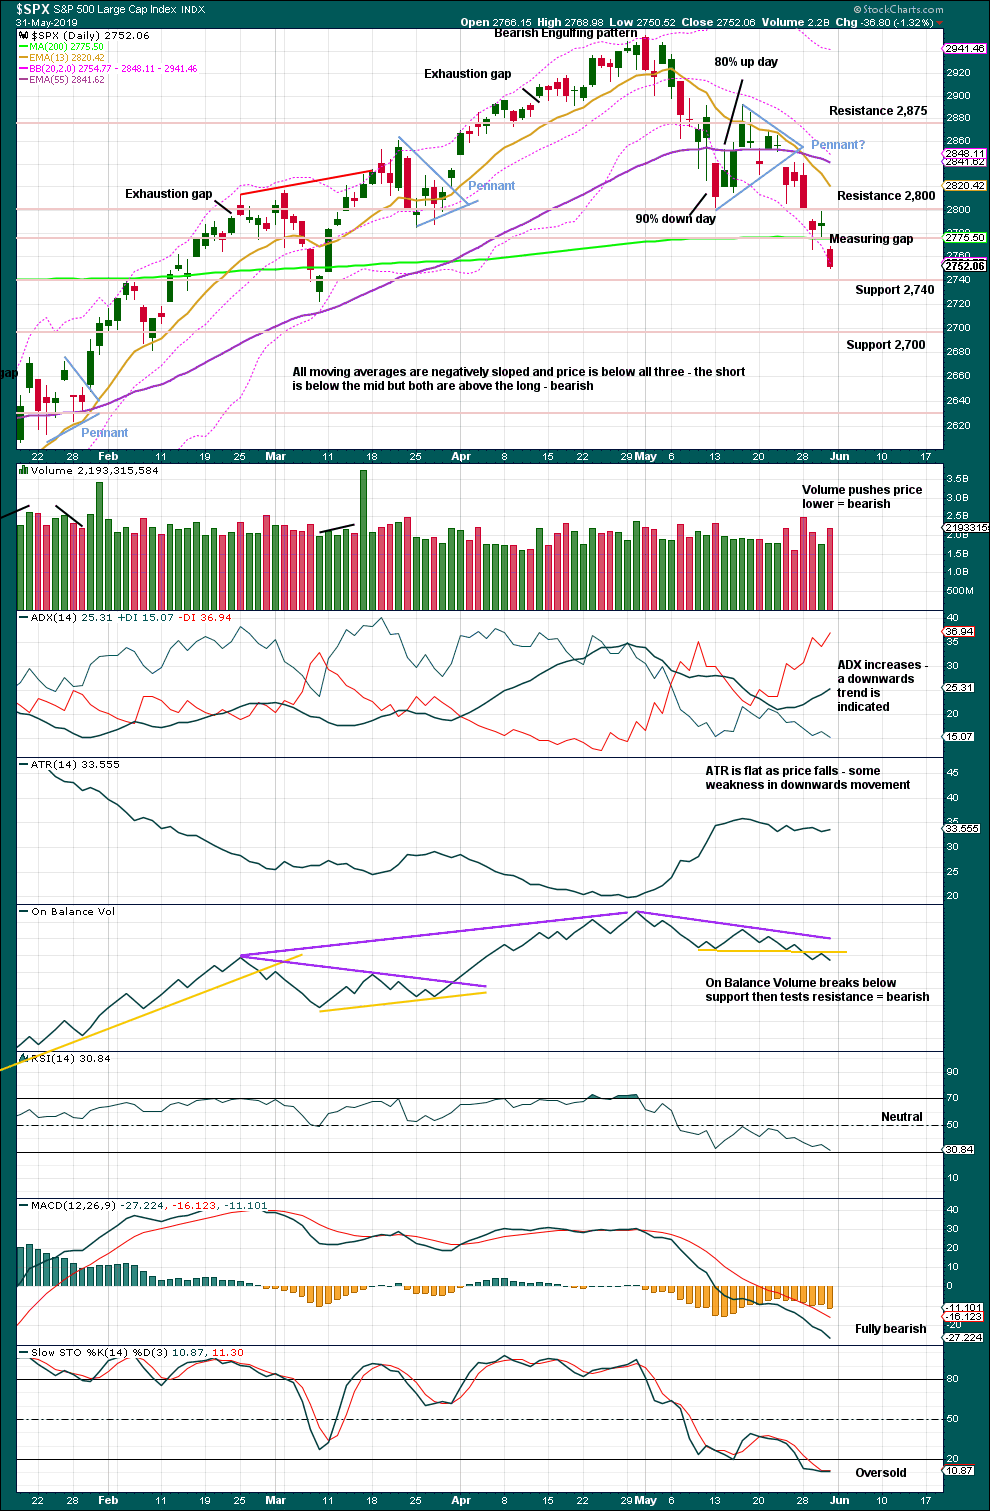
A small pennant pattern may be complete and followed by a downwards breakout, which has support from volume. The target is about 2,690.
When price is trending, as it is now, Stochastics may remain extreme for a reasonable period of time. Only when Stochastics has been oversold for some time and then exhibits bullish divergence with price shall it be indicating an end to downwards movement.
Selling Pressure has assumed the dominant position over Buying Power in Lowry’s data.
Declining to flat ATR as price falls supports the first two Elliott wave counts and indicates the alternate looks less likely.
BREADTH – AD LINE
WEEKLY CHART
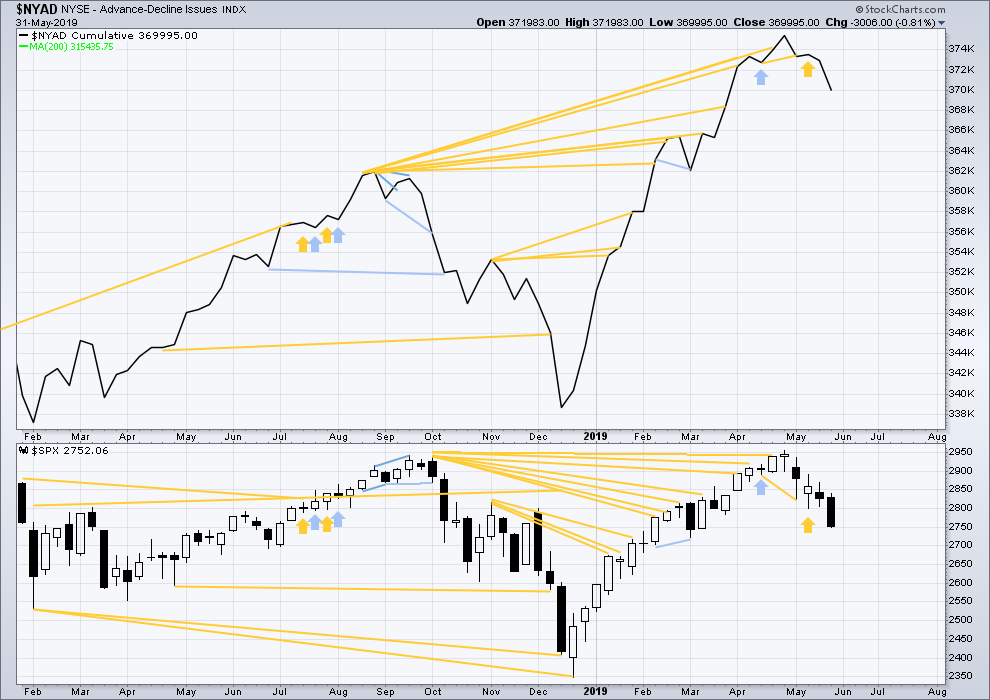
Click chart to enlarge. Chart courtesy of StockCharts.com. So that colour blind members are included, bearish signals
will be noted with blue and bullish signals with yellow.
Bear markets from the Great Depression and onwards have been preceded by an average minimum of 4 months divergence between price and the AD line with only two exceptions in 1946 and 1976. With the AD line making a new all time high on the 3rd of May, the end of this bull market and the start of a new bear market is very likely a minimum of 4 months away, which is the beginning of September 2019.
In all bear markets in the last 90 years there is some positive correlation (0.6022) between the length of bearish divergence and the depth of the following bear market. No to little divergence is correlated with more shallow bear markets. Longer divergence is correlated with deeper bear markets.
If a bear market does develop here, it comes after no bearish divergence. It would therefore more likely be shallow. The alternate Elliott wave count outlines this potential scenario.
Price has moved lower for the week. Neither price nor the AD line have made new lows below the prior swing low of the week of the 4th of March. There is no new mid-term divergence.
DAILY CHART
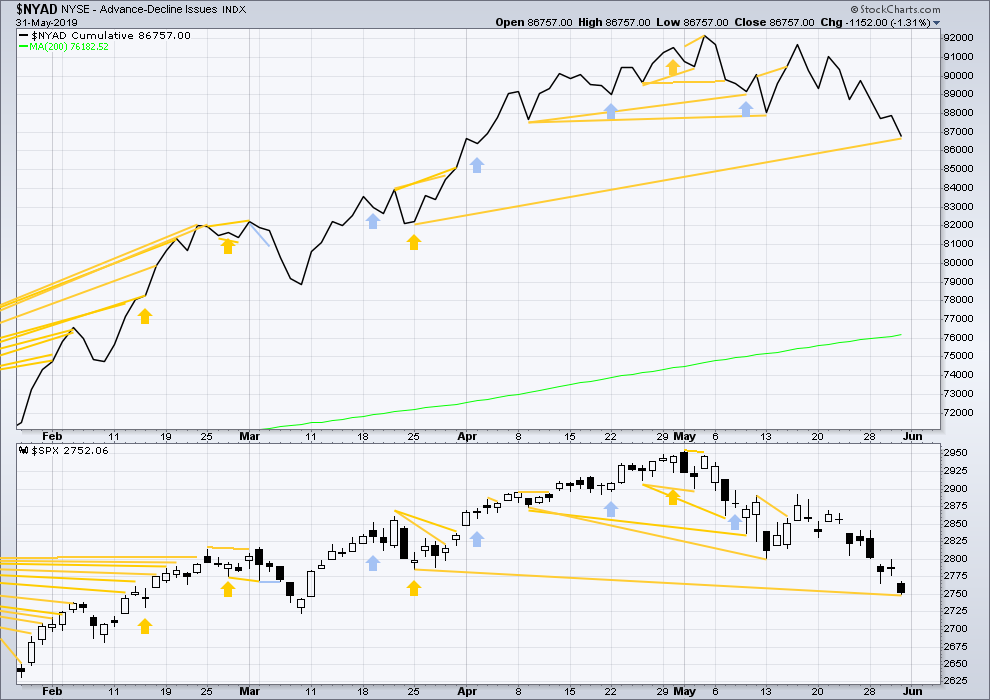
Click chart to enlarge. Chart courtesy of StockCharts.com. So that colour blind members are included, bearish signals
will be noted with blue and bullish signals with yellow.
Breadth should be read as a leading indicator.
Price has now made a new mid-term low below the prior low of the 25th of March, but the AD line has not. Price is falling faster than market breadth. This divergence is bullish for the mid term and supports the view that this pullback is a counter trend movement within an ongoing bull market and not the start of a fully fledged bear market.
VOLATILITY – INVERTED VIX CHART
WEEKLY CHART
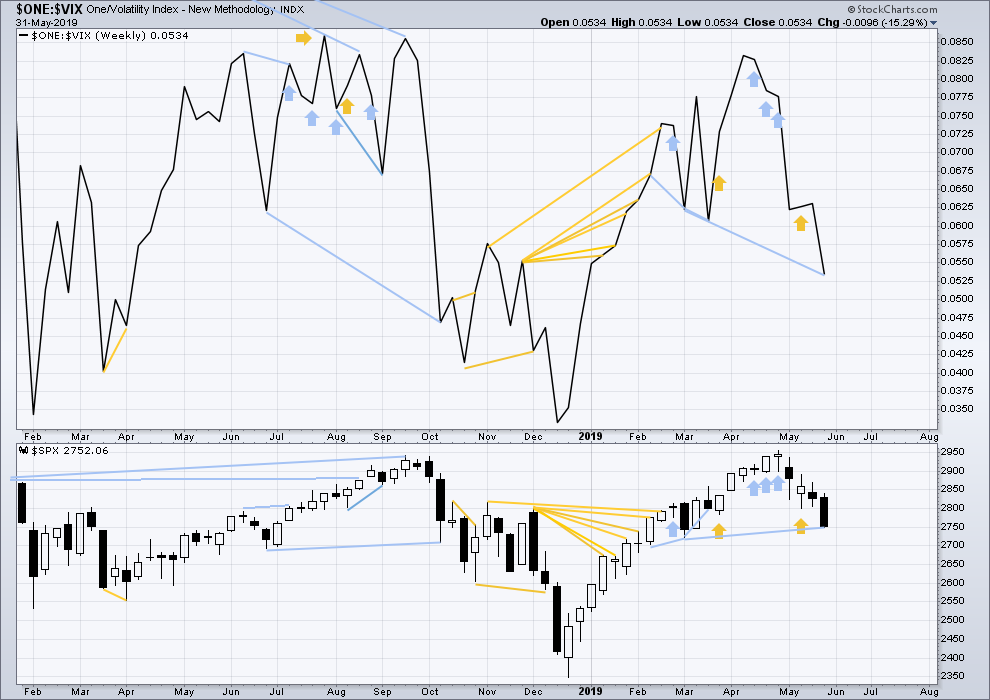
Click chart to enlarge. Chart courtesy of StockCharts.com. So that colour blind members are included, bearish signals
will be noted with blue and bullish signals with yellow.
Inverted VIX has made a new low below the low of the 4th of March, but price has not. Downwards movement comes with a strong increase in VIX, which is increasing faster than price. This divergence is bearish, but will not be given much weight in this analysis at this time.
If bearish divergence develops further, then it may be given some weight.
DAILY CHART
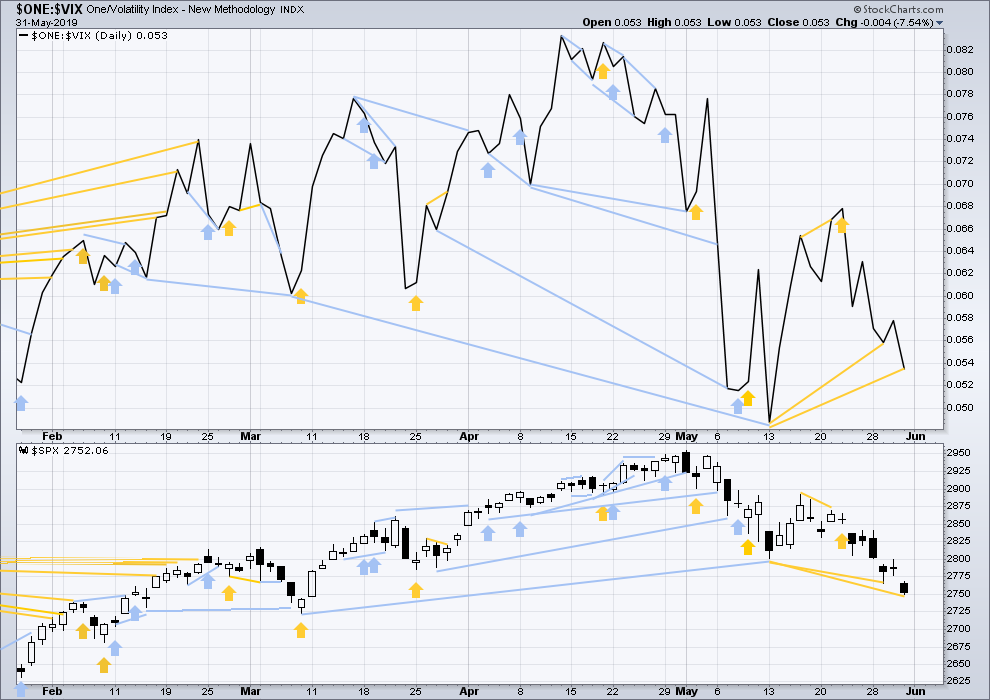
Click chart to enlarge. Chart courtesy of StockCharts.com. So that colour blind members are included, bearish signals
will be noted with blue and bullish signals with yellow.
Price has made a new low below the prior low of the 13th of May, but inverted VIX has not. For the short term, the fall in price does not come with a corresponding increase in VIX. This divergence is bullish.
DOW THEORY
Dow Theory confirmed a bear market in December 2018. This does not necessarily mean a bear market at Grand Super Cycle degree though; Dow Theory makes no comment on Elliott wave counts. On the 25th of August 2015 Dow Theory also confirmed a bear market. The Elliott wave count sees that as part of cycle wave II. After Dow Theory confirmation of a bear market in August 2015, price went on to make new all time highs and the bull market continued.
DJIA: 23,344.52 – a close on the 19th of December at 23,284.97 confirms a bear market.
DJT: 9,806.79 – price has closed below this point on the 13th of December.
S&P500: 2,532.69 – a close on the 19th of December at 2,506.96 provides support to a bear market conclusion.
Nasdaq: 6,630.67 – a close on the 19th of December at 6,618.86 provides support to a bear market conclusion.
With all the indices having moved higher following a Dow Theory bear market confirmation, Dow Theory would confirm a bull market if the following highs are made:
DJIA: 26,951.81
DJT: 11,623.58
S&P500: 2,940.91 – a new all time high has been made on the 29th of April 2019.
Nasdaq: 8,133.30 – a new high has been made on 24th of April 2019.
Published @ 11:07 a.m. EST on June 1, 2019.
—
Careful risk management protects your trading account(s).
Follow my two Golden Rules:
1. Always trade with stops.
2. Risk only 1-5% of equity on any one trade.
—
New updates to this analysis are in bold.
General observation about trading…
As Kevin says below, “Taking a bite out of the middle is always the safest play.”
I agree. Since I stopped trying to pick bottoms and tops, and switched entirely to grabbing small bites from the middle of momentum swings, with tight stops, my trading has turned consistently profitable. Not every trade, mind you, but profitable overall. Seriously profitable.
As always, YMMV.
I have gone 33% long SPX today. I will be looking to deploy the other 2/3 of this position tomorrow or day after as conditions warrant.
May the Force be with you Rodney!!
I’ve certainly got money long in some smaller issues with very deep stops, but not too much and as I say, I want to perceive a bit more edge before committing more. This is the first day this overall 2 really got to a really high momentum level…but only for NDX. I’m talking days that sell off over 2%. The relatively low momentum through this sell off seems supportive of it not going to far deeper levels. But today throws a bit of a monkey wrench in that viewpoint, even if SPX didn’t spike down super hard today. The bearish contagion often spreads from one market to more over a little time. Today was a bit spooky.
Thus, the 1/3 position. You don’t see me do that too often. I am usually 50% or higher on my opening of a position. I am putting a lot of weight on the McClellan Oscillator ending positive / green today and never going below the May 13th low when SPX was around 2800. This is a strong positive divergence.
Hourly chart updated:
The first target was met and price fell through. Now use the second target, the 0.382 Fibonacci ratio of primary wave 1.
I’ve checked the structure of minuette wave (v) on the five minute chart, it fits nicely as an ending contracting diagonal.
Minute iv may be over here, or it may continue sideways to have better proportion.
Also, look for price to come and touch the lower edge of the black Elliott channel, and maybe overshoot it. If that happens then look for the possibility of a sharp reversal.
Yep! 🙂
Thank you, Lara. I figured we were getting close, but today’s mush was confusing. I appreciate this update… even if it changes!
big cap tech getting MURDERED today. -7% both FB and GOOGL, AMZN down 4.7%, bam bam bam!! Really striking divergences across the board (SPX down less than 0.5% for example, while NDX is down about 1.7%, and EEM is UP, about 0.9%!
SPX is getting ever close to the 2722-24 area with multiple fibo’s and that swing low from March. I continue to view that as the most likely bottom of this 2 down. But I’ll wait for proof, oh yes. It could be a minor way station as well on a continued deteriorating view of the intermediate term future for business.
Even though we are down on the SPX, the McClellan Oscillator is up. This indicates that the breadth is positive (more stocks up than down). So, we have a few stocks leading / dragging the overall market down. It seems to me this is another signal that the correction is weak and weakening. The bottom or completion of the correction may be very soon. Since we are at the first target area of 2739 and the structure is incomplete, I agree that we should be going down toward the next target of 2722. I will begin my accumulation of long positions at that point unless something dramatic is happening.
Well it made a low of 38 & then up to 63, which could be 4 then another low… with a fast tempo today… u could mark the structure complete IMO
I’m not going to be satisfied given the strength of the 2 overall and the “fundamentals” that seem to be driving it with any logical “structure complete” evidence. I need to see evidence of an impulse upward launching and running. Taking a bite out of the middle is always the safest play, vs. catching falling knives.
Yeah always a better bet, the only problem is most of the initial gain is going to be in ETH 🙂
Anyways looks like an ED in play
AMGN appears at the weekly level to be set up with a possibly completed 7 or so month correction. I have it as a completed WXY, with the Y an ABC, the C leg being the April high to May low. There’s a nice double bottom in place now just above 166. Movement today up off that floor could be the start of a new motive wave up. I’ve taken a long here…but I’m looking for small profit (3%) in case this is just a small bounce, particularly given the overall instant health of the market is “severe flu”!!
NDX has tagged it’s March swing low at 6941, which is just above 50% of the Dec low to May high at 6879. A tidy place for this debacle to bottom. However, it will take quite a snap reversal of momentum to do so. Dropping to the 61.8% at 6444 and turning instead in that vicinity would seem quite possible here.
Here’s a measured move measurement.
Left yellow arrow moved down 161 points. If the right arrow moves down 161 points, that would take us to 2733.
2731 in overnight, opening around 2751. I know “overnight doesn’t count”…
Early Bird Number One!
Thanks, Lara, for your excellent analysis! Still stateside searching for the elusive good coffee?
I’ll be in Texas for a few weeks yet… may need to change my departure date and push it out.
I have found acceptable coffee. I also bought a small espresso machine so I can get my caffeine in the morning before going out, so things are looking up 🙂
Having consumed TV and movies made in the USA all my life, coming here is a surreal experience. It’s like stepping into a movie set.
So I am very happy indeed.
Cool to hear that you have found happiness! If your travels bring you to Charlotte NC, my wife and I would enjoy showing you the USA’s 17th largest city and the second largest financial center in America, after NYC. I’ll be on the west coast from the 18th through the 25th, so there’s that. Wishing you safe travels!
That is very kind, thank you very much.
We’re unlikely to travel out of Texas during this visit, but we plan on coming north again next year and spending much more time and having more flexibility. And so when that happens I’d love to meet up with members!
Maybe we could all come to your place! (he-he)
If anyone is visiting NZ I can certainly advise on the best bits to visit!
But be warned, the land area of NZ is greater than Great Britain. A few days won’t do it justice. At least 2 weeks, and preferably a month or more IMO