
The most likely scenario expected yesterday was for downwards movement to continue, which is what has happened. The first target is met and the structure is incomplete. The second target will now be used.
Summary: The low of December 2018 is expected to most likely remain intact, and this pullback is expected to be followed by a strong third wave up to new all time highs.
A pullback may end this week about 2,722. If price keeps falling through this target, then a classic target calculated from the pennant pattern is about 2,690.
The alternate wave count considers the possibility that a relatively short lived bear market may have begun. The target is at 2,080. This wave count has a fairly low probability, but it is a possibility that must be acknowledged.
The biggest picture, Grand Super Cycle analysis, is here.
Monthly charts were last published here, with video here. There are two further alternate monthly charts here, with video here.
ELLIOTT WAVE COUNTS
The first two Elliott wave counts below will be labelled First and Second. They may be about of even probability. When the fifth wave currently unfolding on weekly charts may be complete, then these two wave counts will diverge on the severity of the expected following bear market. To see an illustration of this future divergence monthly charts should be viewed.
The alternate Elliott wave count has a very low probability.
FIRST WAVE COUNT
WEEKLY CHART
Click chart to enlarge.
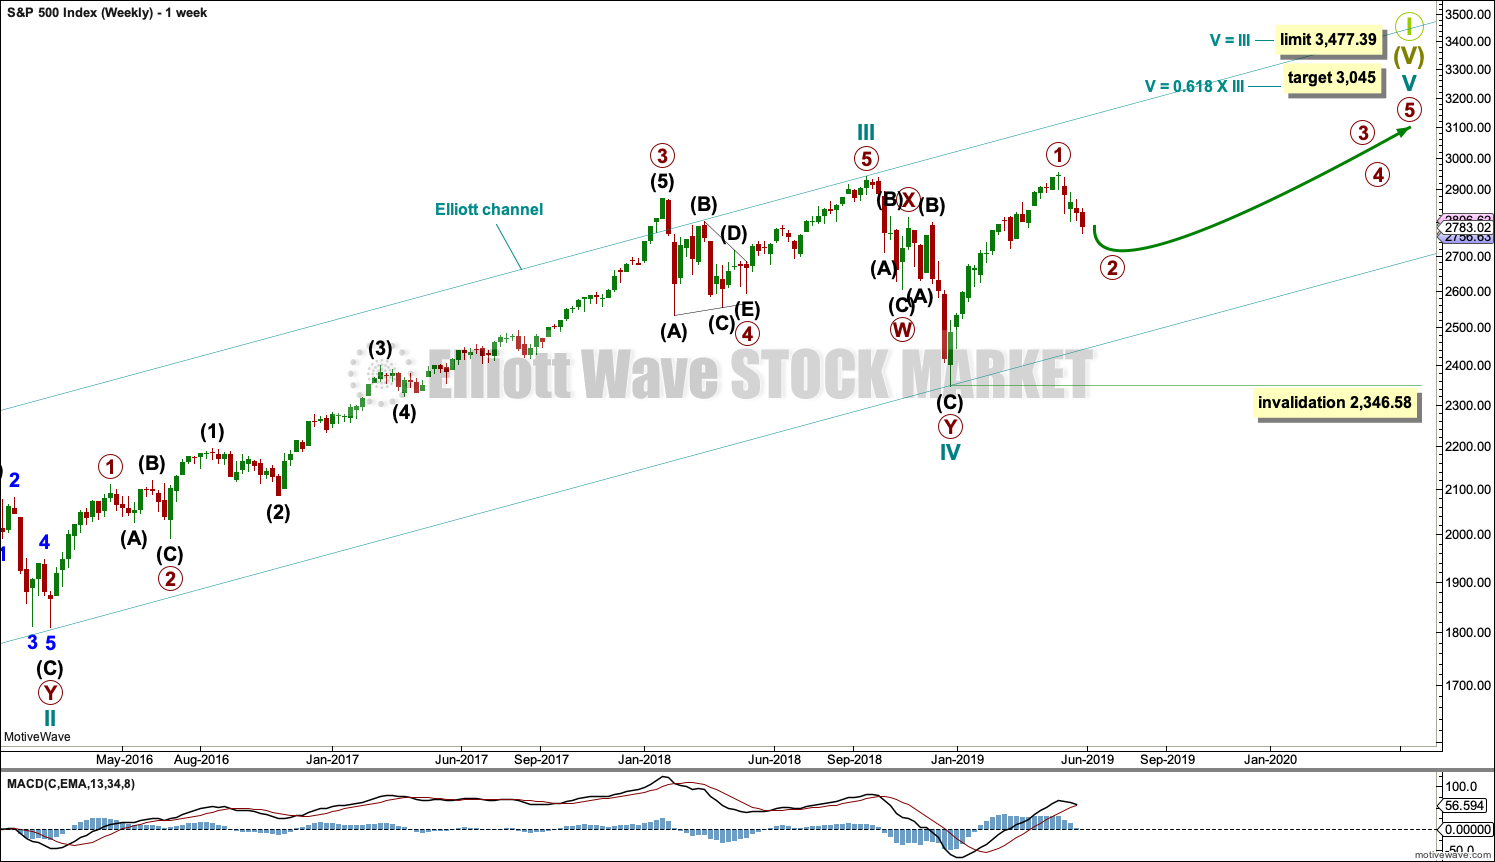
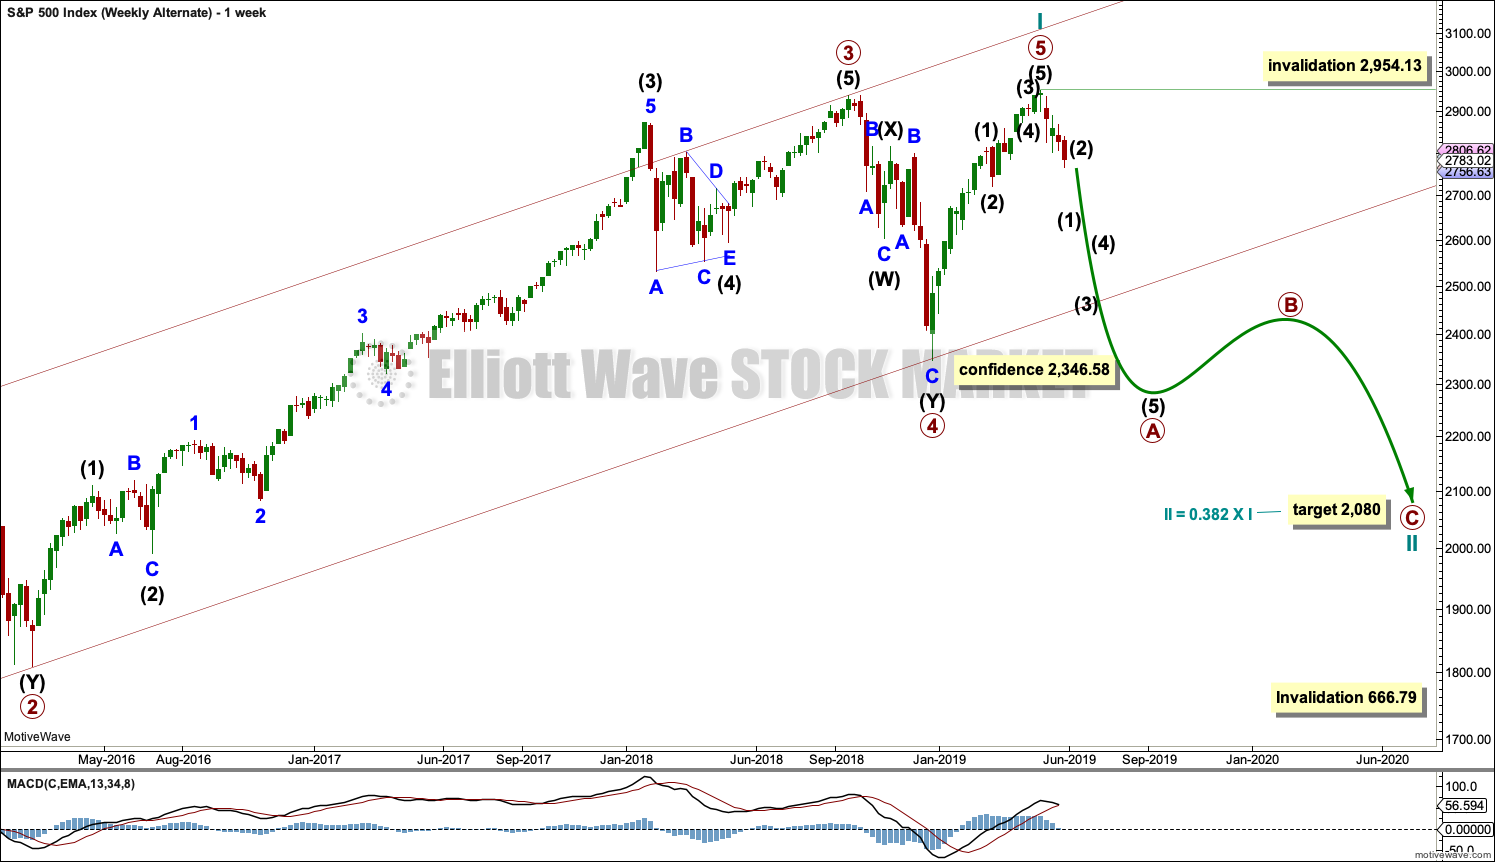
The basic Elliott wave structure consists of a five wave structure up followed by a three wave structure down (for a bull market). This wave count sees the bull market beginning in March 2009 as an incomplete five wave impulse and now within the last fifth wave, which is labelled cycle wave V. This impulse is best viewed on monthly charts. The weekly chart focusses on the end of it.
Elliott wave is fractal. This fifth wave labelled cycle wave V may end a larger fifth wave labelled Super Cycle wave (V), which may end a larger first wave labelled Grand Super Cycle wave I.
The teal Elliott channel is drawn using Elliott’s first technique about the impulse of Super Cycle wave (V). Draw the first trend line from the end of cycle wave I (off to the left of the chart, the weekly candlestick beginning 30th November 2014) to the end of cycle wave III, then place a parallel copy on the end of cycle wave II. This channel perfectly shows where cycle wave IV ended at support. The strongest portion of cycle wave III, the end of primary wave 3, overshoots the upper edge of the channel. This is a typical look for a third wave and suggests the channel is drawn correctly and the way the impulse is counted is correct.
Within Super Cycle wave (V), cycle wave III is shorter than cycle wave I. A core Elliott wave rule states that a third wave may never be the shortest. For this rule to be met in this instance, cycle wave V may not be longer in length than cycle wave III. This limit is at 3,477.39.
A final target is calculated at cycle degree for the impulse to end.
The structure of cycle wave V is focussed on at the daily chart level below.
Within cycle wave V, primary wave 2 may not move beyond the start of primary wave 1 below 2,346.58.
In historic analysis, two further monthly charts have been published that do not have a limit to upwards movement and are more bullish than this wave count. Members are encouraged to consider those possibilities (links below summary) alongside the wave counts presented on a daily and weekly basis.
DAILY CHART
Click chart to enlarge.
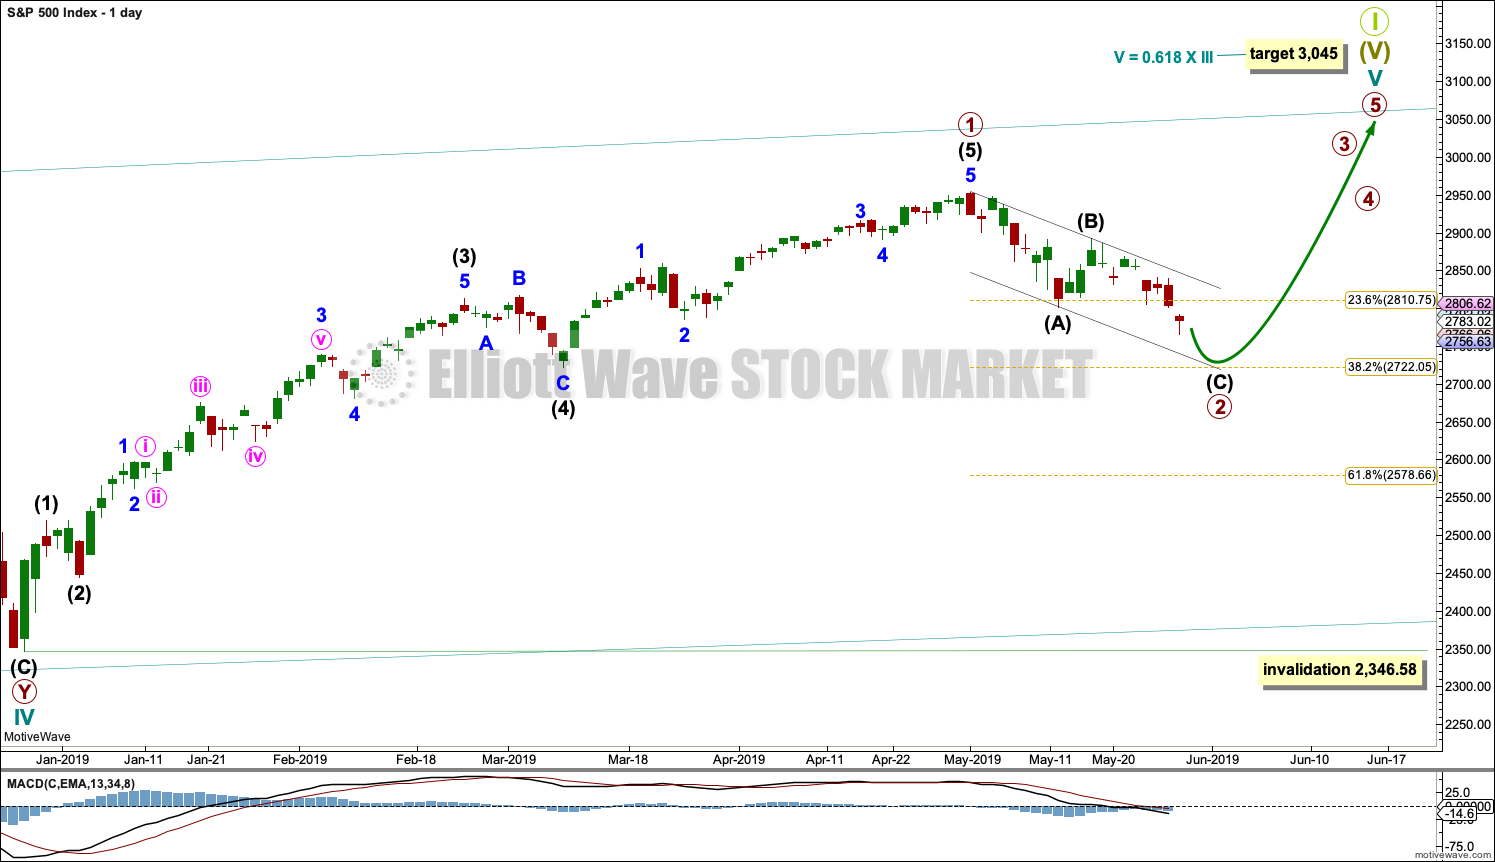
Cycle wave V must subdivide as a five wave motive structure. Within that five wave structure, primary wave 1 may be complete. Primary wave 2 may now continue lower as a zigzag, which may end in another one to two weeks.
Primary wave 3 must move above the end of primary wave 1.
When primary wave 3 is over, then primary wave 4 may be a shallow sideways consolidation that may not move into primary wave 1 price territory below 2,954.13.
Thereafter, primary wave 5 should move above the end of primary wave 3 to avoid a truncation.
Primary wave 2 may not move beyond the start of primary wave 1 below 2,346.58.
Draw a channel about primary wave 2 using Elliott’s technique. Draw the first trend line from the start of intermediate wave (A) to the end of intermediate wave (B), then place a parallel copy on the end of intermediate wave (A). While primary wave 2 continues lower, any bounces should continue to find resistance at the upper edge of this channel. Copy the channel over to the hourly chart.
HOURLY CHART
Click chart to enlarge.
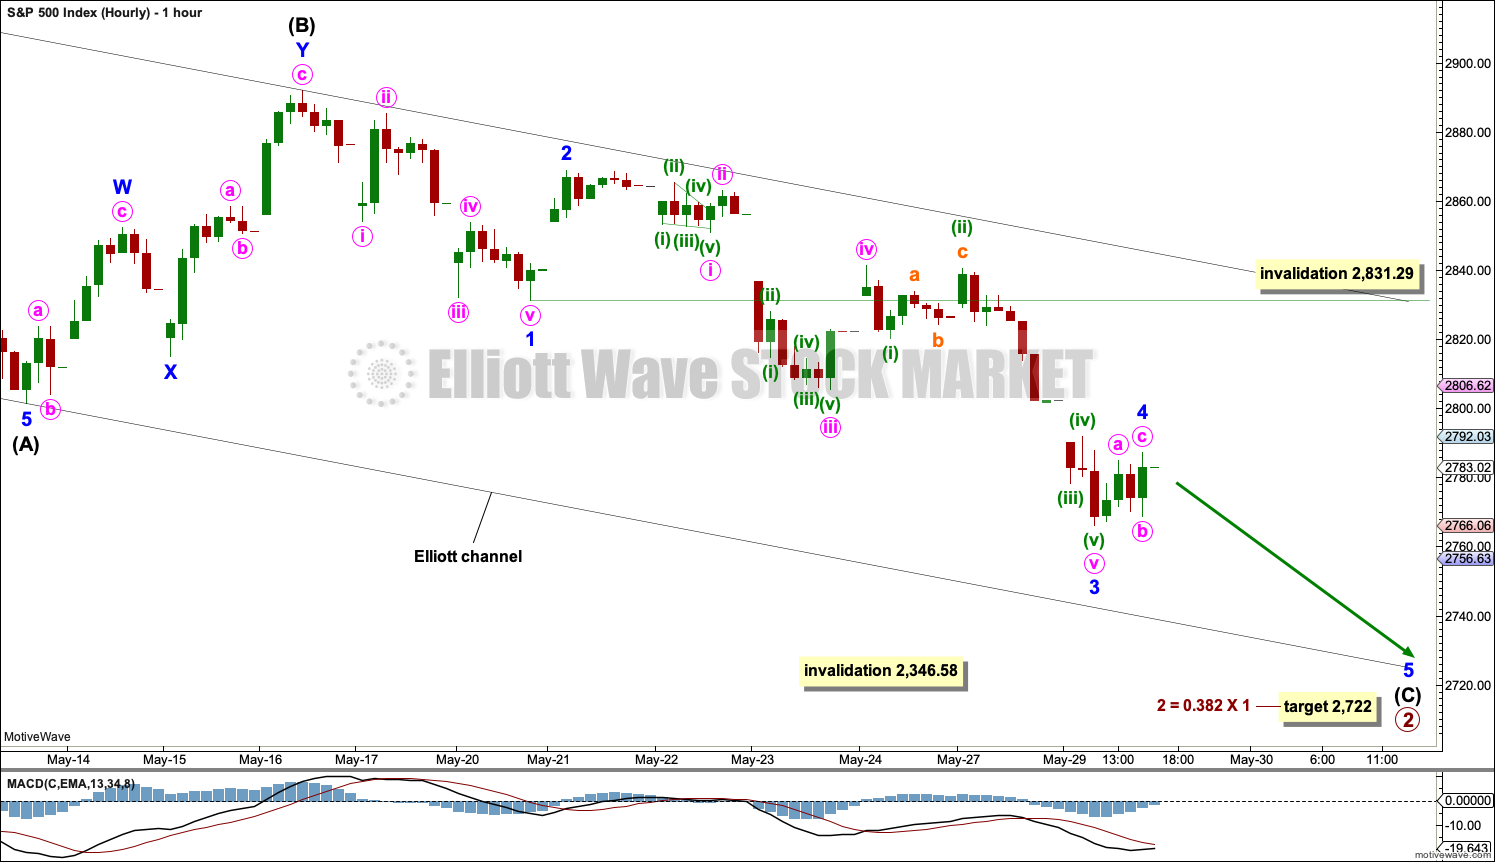
Today this is the only hourly wave count published. The other two wave counts are discarded based upon a very low probability.
Primary wave 2 may be an incomplete zigzag. This wave count expects downwards movement this week to complete intermediate wave (C) and in turn complete the zigzag of primary wave 2.
Minor wave 3 may today be complete and would be 4.34 points short of 1.618 the length of minor wave 1. Minor wave 4 may not move into minor wave 1 price territory above 2,831.29.
Intermediate wave (C) may end at support about the lower edge of the black Elliott channel.
SECOND WAVE COUNT
WEEKLY CHART
Click chart to enlarge.
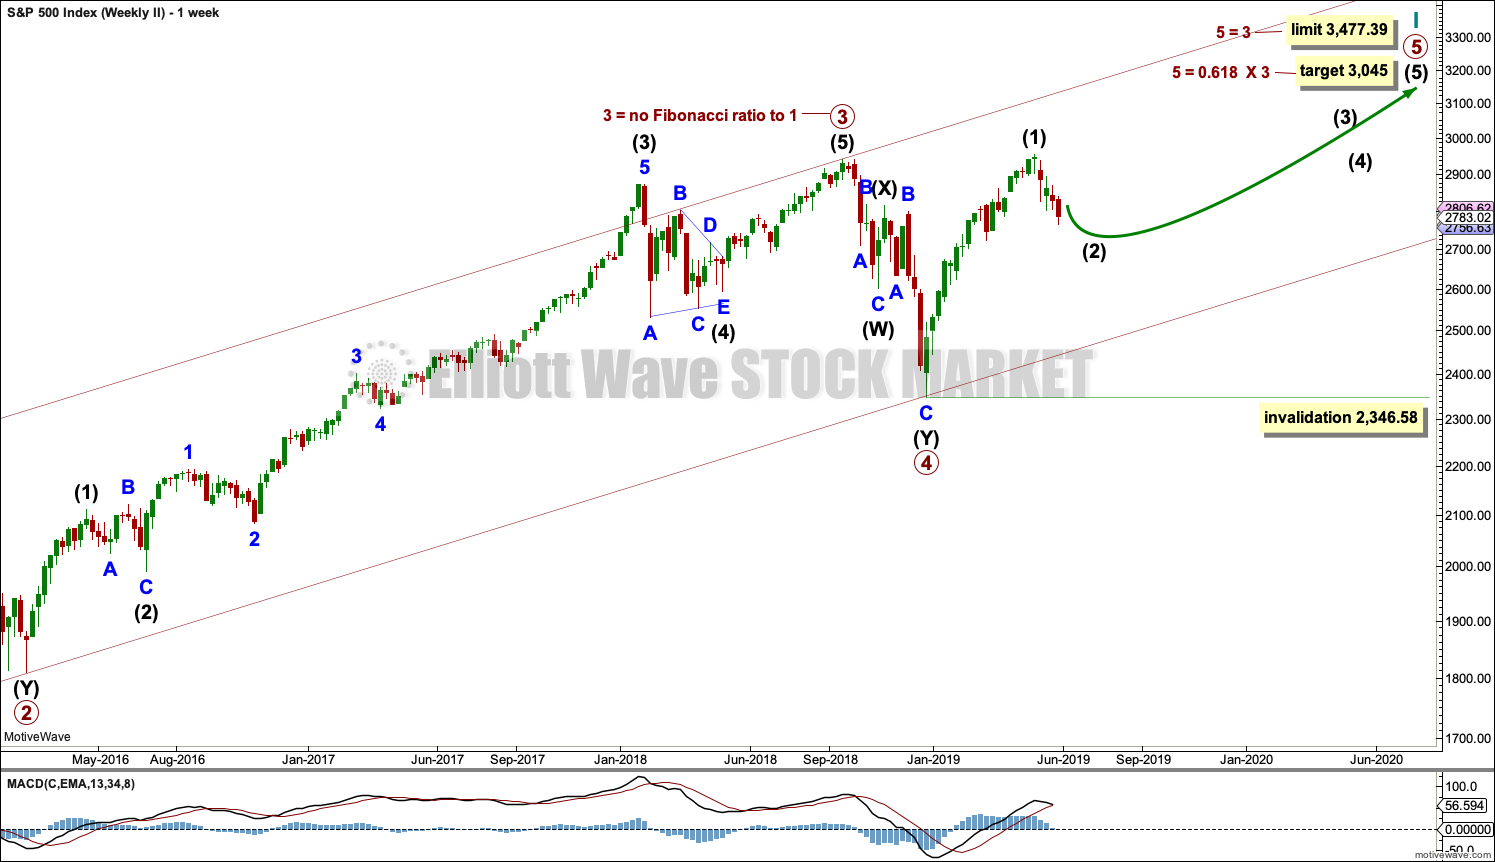
This weekly chart is almost identical to the first weekly chart, with the sole exception being the degree of labelling.
This weekly chart moves the degree of labelling for the impulse beginning in March 2009 all down one degree. This difference is best viewed on monthly charts.
The impulse is still viewed as nearing an end; a fifth wave is still seen as needing to complete higher. This wave count labels it primary wave 5.
ALTERNATE WAVE COUNT
WEEKLY CHART
Click chart to enlarge.
It is possible that for the second wave count cycle wave I could be complete. Primary wave 5 may be seen as a complete five wave impulse on the daily chart.
If cycle wave I is complete, then cycle wave II may meet the definition of a bear market with a 20% drop in price at its end.
Within cycle wave I, primary wave 1 was a very long extension and primary wave 3 was shorter than primary wave 1 and primary wave 5 was shorter than primary wave 3. Because primary wave 1 was a long extension cycle wave II may end within the price range of primary wave 2, which was from 2,132 to 1,810. The 0.382 retracement of cycle wave I is within this range.
Cycle wave II may not move beyond the start of cycle wave I below 666.79.
This wave count does not have support at this time from classic technical analysis.
TECHNICAL ANALYSIS
WEEKLY CHART
Click chart to enlarge. Chart courtesy of et=”_blank”>StockCharts.com.
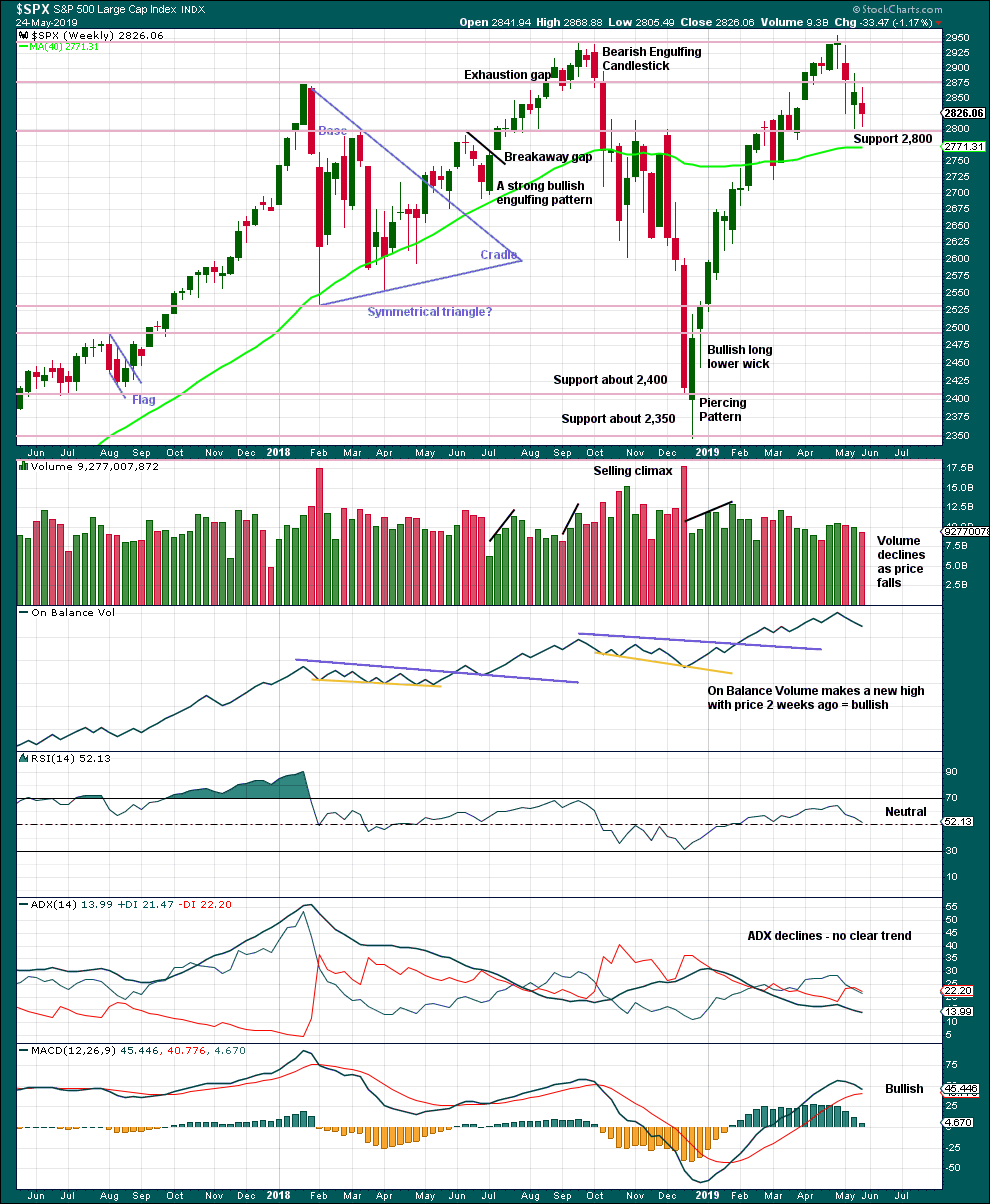
There is an upwards trend from the low in December 2018, a series of higher highs and higher lows with a new all time high on the 30th of April 2019. While the last swing low at 2,785.02 on the 25th of March remains intact, then this view should remain dominant.
The trend is your friend.
Last week closes red, but price has moved sideways. The balance of volume was downwards and volume is not pushing price lower. Overall, this is neutral.
DAILY CHART
Click chart to enlarge. Chart courtesy of StockCharts.com.
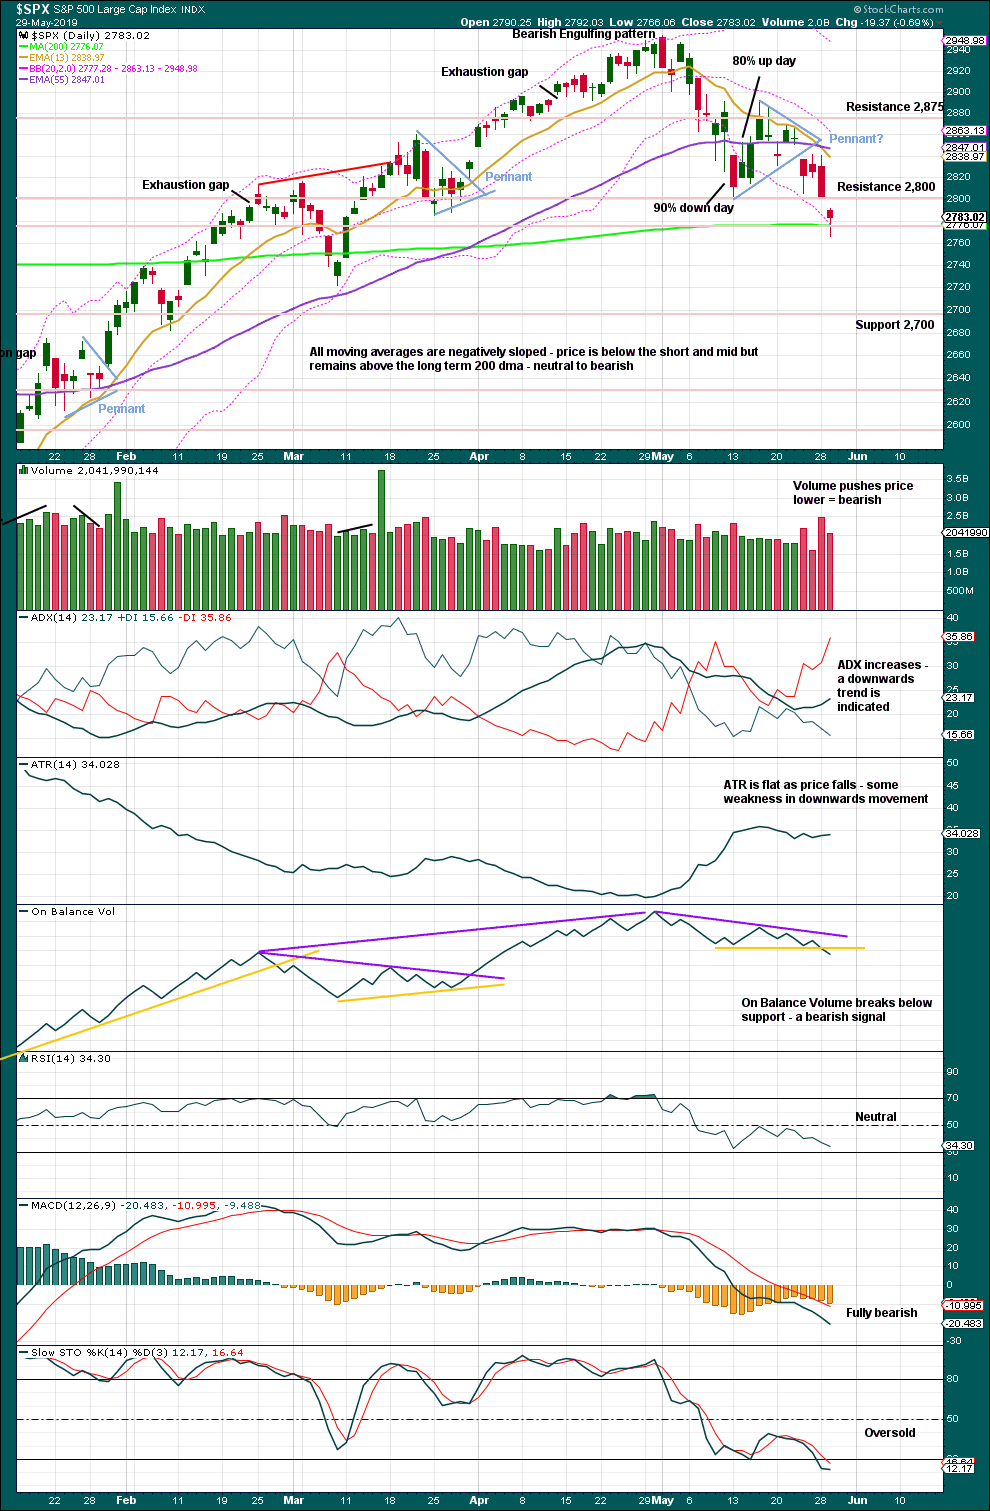
A small pennant pattern may be complete and followed by a downwards breakout, which has support from volume. The target is about 2,690.
Volume has declined from yesterday but remains strong relative to recent days. The 200 day moving average may provide a little support here.
Weight should be given to the bearish signal from On Balance Volume. It supports the Elliott wave counts which expect more downwards movement here.
When price is trending, as it is now, Stochastics may remain extreme for a reasonable period of time. Only when Stochastics has been oversold for some time and then exhibits bullish divergence with price shall it be indicating an end to downwards movement.
Selling Pressure has today assumed the dominant position over Buying Power in Lowry’s data.
BREADTH – AD LINE
WEEKLY CHART
Click chart to enlarge. Chart courtesy of StockCharts.com. So that colour blind members are included, bearish signals
will be noted with blue and bullish signals with yellow.
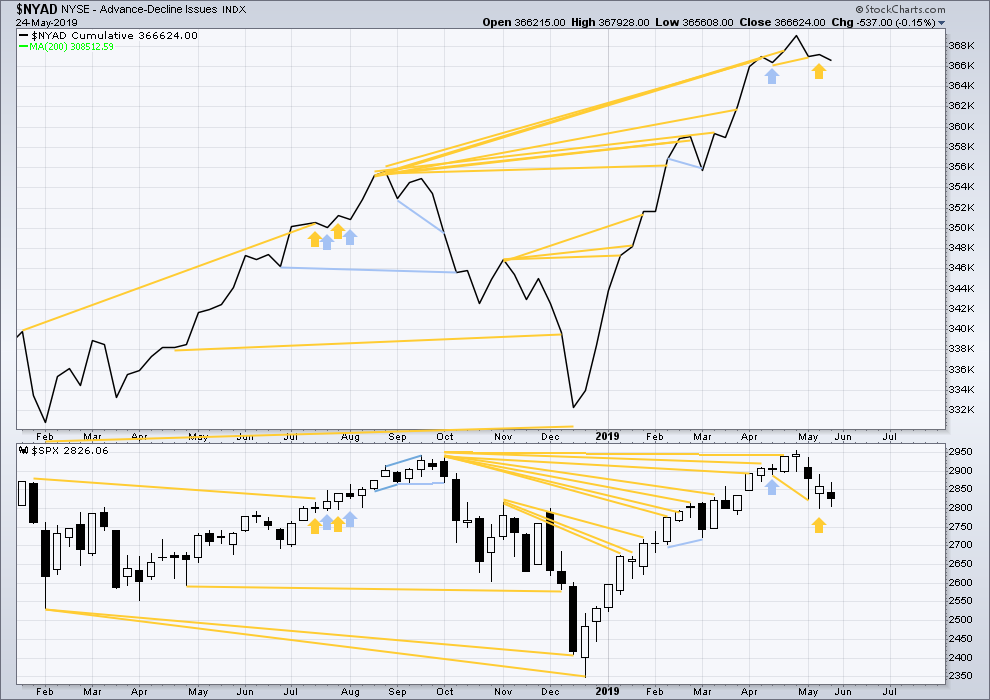
Bear markets from the Great Depression and onwards have been preceded by an average minimum of 4 months divergence between price and the AD line with only two exceptions in 1946 and 1976. With the AD line making a new all time high on the 3rd of May, the end of this bull market and the start of a new bear market is very likely a minimum of 4 months away, which is the beginning of September 2019.
In all bear markets in the last 90 years there is some positive correlation (0.6022) between the length of bearish divergence and the depth of the following bear market. No to little divergence is correlated with more shallow bear markets. Longer divergence is correlated with deeper bear markets.
If a bear market does develop here, it comes after no bearish divergence. It would therefore more likely be shallow. The alternate Elliott wave count outlines this potential scenario.
Last week price has moved sideways and the candlestick has closed red. A decline in breath this week supports downwards movement within the week. There is no short-term divergence.
Last week all of small, mid and large caps moved sideways.
DAILY CHART
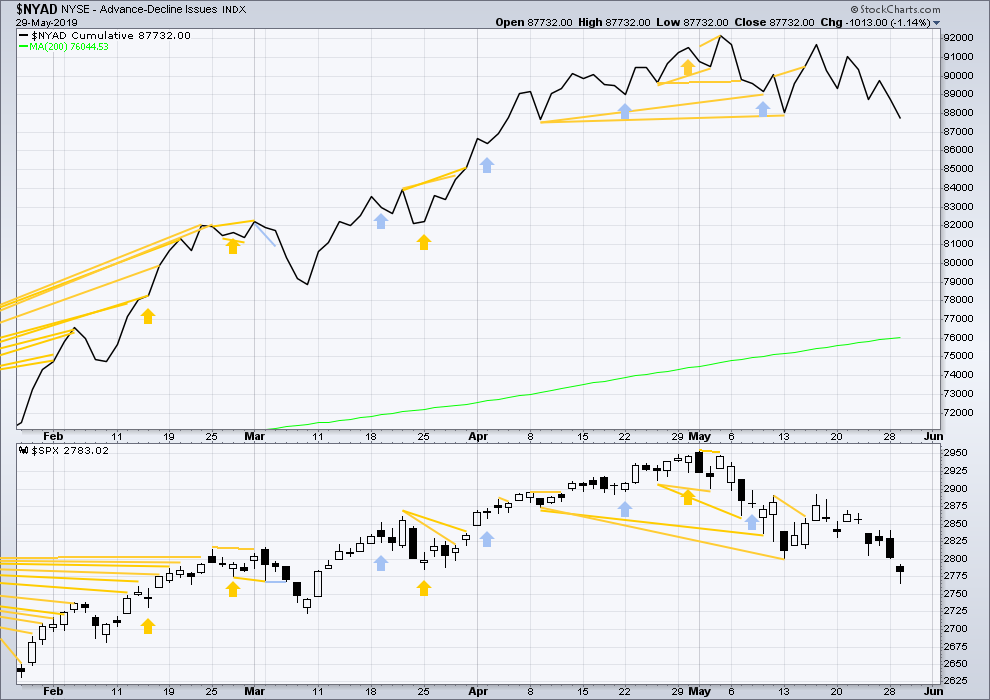
Click chart to enlarge. Chart courtesy of StockCharts.com. So that colour blind members are included, bearish signals
will be noted with blue and bullish signals with yellow.
Breadth should be read as a leading indicator.
Mid-term bullish divergence remains and supports the view here that a low may be in place.
Today both price and the AD line have moved lower. Both have now made new short-term lows below the prior swing low of the 13th of May. There is no new short-term divergence.
VOLATILITY – INVERTED VIX CHART
WEEKLY CHART
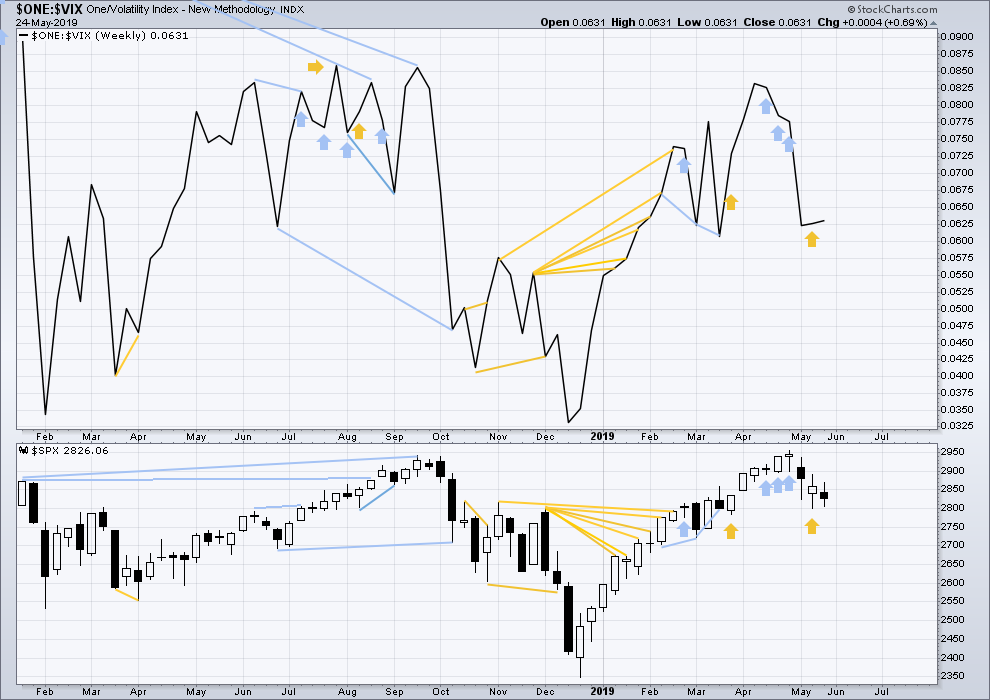
Click chart to enlarge. Chart courtesy of StockCharts.com. So that colour blind members are included, bearish signals
will be noted with blue and bullish signals with yellow.
Three weeks in a row of weekly bearish divergence has now been followed by two reasonable downwards weeks. It may be resolved here, or it may yet be an indication of further downwards movement in price.
Last week price has completed an inside week. Inverted VIX has moved slightly higher. There is no short-term divergence.
DAILY CHART
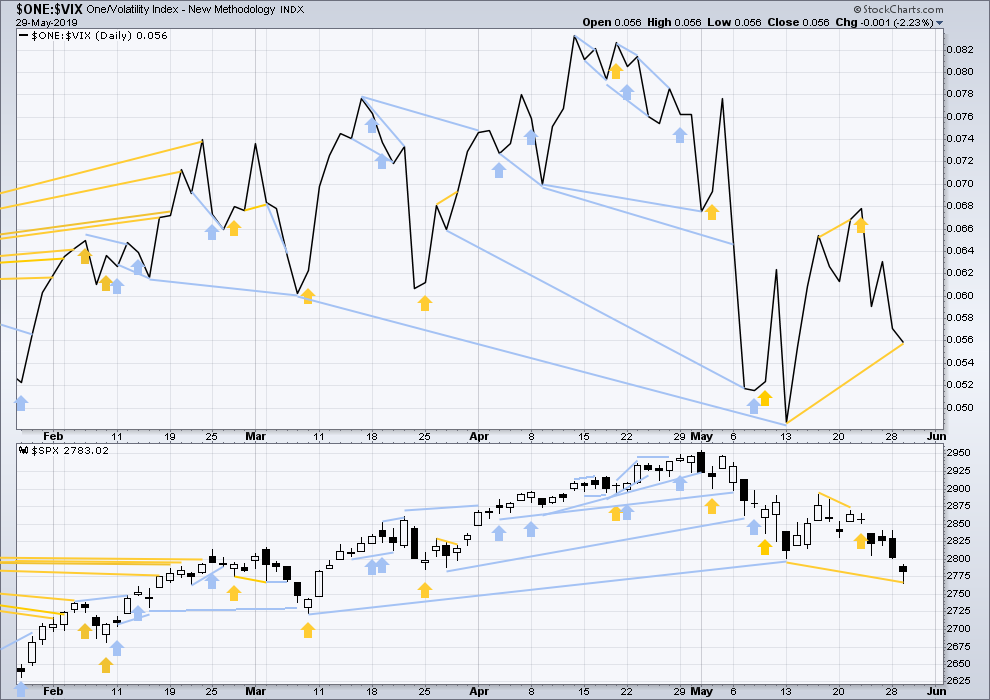
Click chart to enlarge. Chart courtesy of StockCharts.com. So that colour blind members are included, bearish signals
will be noted with blue and bullish signals with yellow.
Today price has made a new swing low below the prior low of the 13th of May, but inverted VIX has not. This divergence is bullish for the short term.
DOW THEORY
Dow Theory confirmed a bear market in December 2018. This does not necessarily mean a bear market at Grand Super Cycle degree though; Dow Theory makes no comment on Elliott wave counts. On the 25th of August 2015 Dow Theory also confirmed a bear market. The Elliott wave count sees that as part of cycle wave II. After Dow Theory confirmation of a bear market in August 2015, price went on to make new all time highs and the bull market continued.
DJIA: 23,344.52 – a close on the 19th of December at 23,284.97 confirms a bear market.
DJT: 9,806.79 – price has closed below this point on the 13th of December.
S&P500: 2,532.69 – a close on the 19th of December at 2,506.96 provides support to a bear market conclusion.
Nasdaq: 6,630.67 – a close on the 19th of December at 6,618.86 provides support to a bear market conclusion.
With all the indices moving now higher, Dow Theory would confirm a bull market if the following highs are made:
DJIA: 26,951.81
DJT: 11,623.58
S&P500: 2,940.91 – a new all time high has been made on the 29th of April 2019.
Nasdaq: 8,133.30 – a new high has been made on 24th of April 2019.
Published @ 06:29 p.m. EST.
—
Careful risk management protects your trading account(s).
Follow my two Golden Rules:
1. Always trade with stops.
2. Risk only 1-5% of equity on any one trade.
—
New updates to this analysis are in bold.
Lowry’s Latest:
“While it is often recited in technical analysis circles that ideally, breadth should lead price in healthy uptrends, it is rarely observed. In fact, prior to 2019, there had only been 9 observations of this condition since 1940, when after a drawdown of 10% or more, the NYSE Advance-Decline Line made a new multi-year or all-time high while the major price indexes were comparatively lower. These “positive divergences” between the major price indexes and the NYSE Advance-Decline Line occurred in November 1942, October 1949, June 1978, May 2003, December 2009, August 2010, January 2012, April 2016, April 2018, and February 2019. Of the prior 9 positive divergences, 8 of them (89%) ushered in new bull market or all-time price highs, with the exception of 1978. Thus, we can conclude that this rare condition carries a significant probability of identifying the early stages of an important, long-term advance to new market highs…”
Downwards movement within this session subdivides as a three on the five minute chart, so far. So it looks like minor 4 may not be over, it may move sideways tomorrow.
The 0.382 Fibonacci ratio of minor wave 3 may be a reasonable target for minor wave 4 to end.
Primary 2 may not end this week, it may move into next week.
The gap above is still open… maybe tomorrow ?
Did the IWM bottom today? Is it still leading the market?
Ahhh. Back from vacation. Rested, tanned and ready to go. So, what have I missed?
One thing I did over the down time was read Kevin’s wonderful piece published in the May 2019 edition of Technical Analysis of Stocks & Commodities. It was nice being able to take the time to read for content and connect with the material. If you haven’t already, check this out because it’s really great stuff. His MVTI (Morgan Visual Trend Indicator) is powerful when it is implemented across various timeframes. It’s pretty brilliant once you see it in use.
My interest in the MVTI is to familiarize it with intermediate to long-term Heikin-Ashi charts.
And happy end of May everyone. Let’s kick some ass this summer!
Chartmonkey, that’s very kind of you. Thank you.
DG…. short it?
tail candle forming on the 3H
Everybody has an opinion…
Shorting DG here is the inverse of trying to catch a falling knife (like, for example, buying INTC right now). DG trend is strong up across the board, every time frame. Awesome stock to trade long inside the rising trend range (clearly visible on the weekly chart). Buy pullbacks to/past the rising 21 ema on the weekly, use a deep stop (15% perhaps) and take profit on any move up of 4-5%, would be one way to play it. Rinse and repeat this trade over and over as long as the action over the last many years continues.
But short it, nope not me!!
option straddles and strangles have been working well for me on the retail stocks . DG big winner today .
consider WSM this afternoon , and BIG in the AM
Lara, considering that wave C made a lower low than A & yesterday’s daily candle looks decent, also considering where the futures are and a real good possibility of opening gap up back above important 2800 level… also the month end shenanigans.. i am really watching the open, very important open… if we do open gap up, it will be the rare Abandoned baby pattern, a reliable pattern..
So is it possible that yesterday marked the end of 2??
Obviously it has to open with a decent gap up & maintain that gap.
Hash man I’ve had similar thoughts. Though try as I might, when I consider “alternative counts” of the correction to justify it being complete now, I keep coming up with “nope, not yet”. Also, I’ve learned the hard way that second guessing Lara’s primary counts is very rarely supportive of my profit goals, if you catch my drift.
That all said…we’ll see. I’m not piling into SPX on the long side yet though, that’s for sure. I want Lara’s “main” call to be that this 2 down is over first, for that. “Trust the wave count Luke.” And trust the expert.
Yup agree Kevin..
But the open was not over 2800 & lacked any real thrust to be honest…
I also think that once the 2 will be done, there’ll be plenty of opportunity to join the trend, so similarly I’ll wait for the opportune moment…
Anyways my current thoughts are a neutral day with another low in 79-80 then close around 85-90, open higher tomorrow top out around 2810s then spend time between 2790s & 2810 all day… gap down Monday with a big down day…
Upwards movement from the low of the 29th does not subdivide well as a five on the 5 minute chart. So far.
So… I don’t think the low is in yet.
Just had to say thanks Lara!
I had been piling into $SPXS about 10-12 days ago- focusing on the ‘least likely’ scenario.
Your education and guidance on the minor wave counts kept me from getting stopped out by $.02 and its been smooth sailing ever since.
Thanks to your service ive been travelling spain for the last 3 weeks while I casually sell off my position- Youve created incredible opportuntiy for me, as well as taken my trading skills and mentality to the next level! Thank you so much!
Awesome! Thanks for letting me know.
Excellent analysis and commentary. Lara, from shortly after the ATH you have been right on with this correction as you navigated the 23 possible structures. It looks like tomorrow or Friday may bring a new low around 2722 at your target completing the structure. It will surely come when I am in the mountains and away from my computer to place orders. Of course it never fails. I am going to hang around for the open tomorrow (6:30 AM my time) before I hit the road. I may be able to place some open orders before I leave. Thanks Lara. Sure hope you are over any jet lag and enjoying your visit to the USA.
Thank you very much Rodney.
I am over the jet lag and have been enjoying spending lots of time with family. Yesterday I attended a nephew’s graduation, and it was just like I’ve seen in the movies my whole life. It felt like I was in a movie!
I’m eating Texas BBQ and acclimatising to the heat.
I’ll pay very careful attention to target calculation today for you when I do my analysis. Here’s hoping I can get it right so your orders catch the low!
#1 !
Yesterday and today, you all keep beating me to the punch. Good job.
Ron U!