
A strong downwards day indicates which short-term scenario is most likely.
Summary: The low of December 2018 is expected to most likely remain intact, and this pullback is expected to be followed by a strong third wave up to new all time highs.
Two scenarios remain possible for the short term:
1. A pullback ends this week about 2,740 or 2,722. Today this is by a wide margin the most likely short-term scenario.
2. Some sideways movement continues before a final wave down to about 2,722 completes the pullback in one or two weeks time.
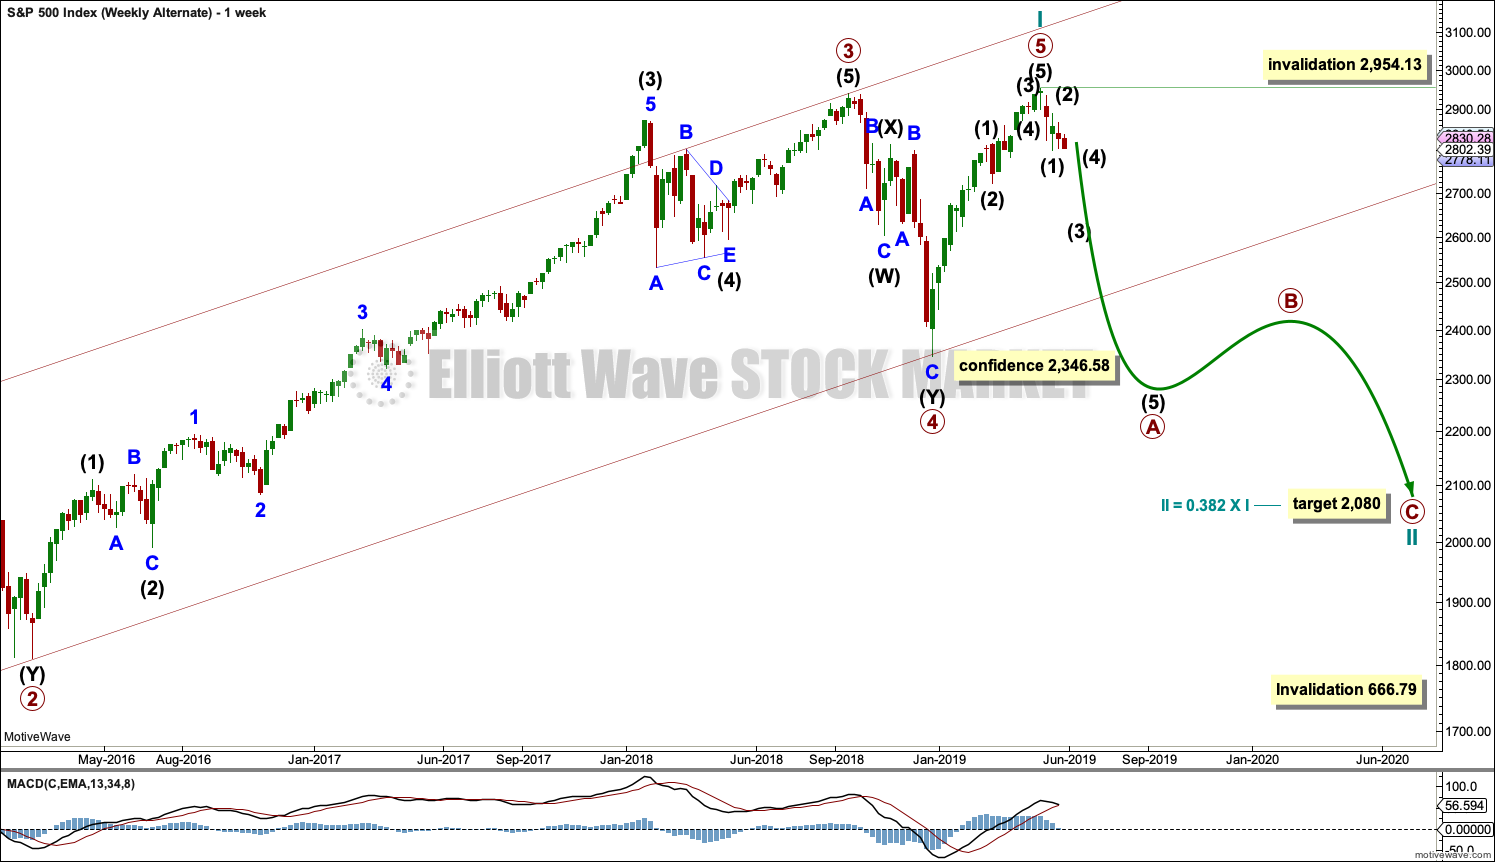
The alternate wave count considers the possibility that a relatively short lived bear market may have begun. The target is at 2,080. This wave count has a fairly low probability, but it is a possibility that must be acknowledged.
The biggest picture, Grand Super Cycle analysis, is here.
Monthly charts were last published here, with video here. There are two further alternate monthly charts here, with video here.
ELLIOTT WAVE COUNTS
The first two Elliott wave counts below will be labelled First and Second. They may be about of even probability. When the fifth wave currently unfolding on weekly charts may be complete, then these two wave counts will diverge on the severity of the expected following bear market. To see an illustration of this future divergence monthly charts should be viewed.
The alternate Elliott wave count has a very low probability.
FIRST WAVE COUNT
WEEKLY CHART
Click chart to enlarge.
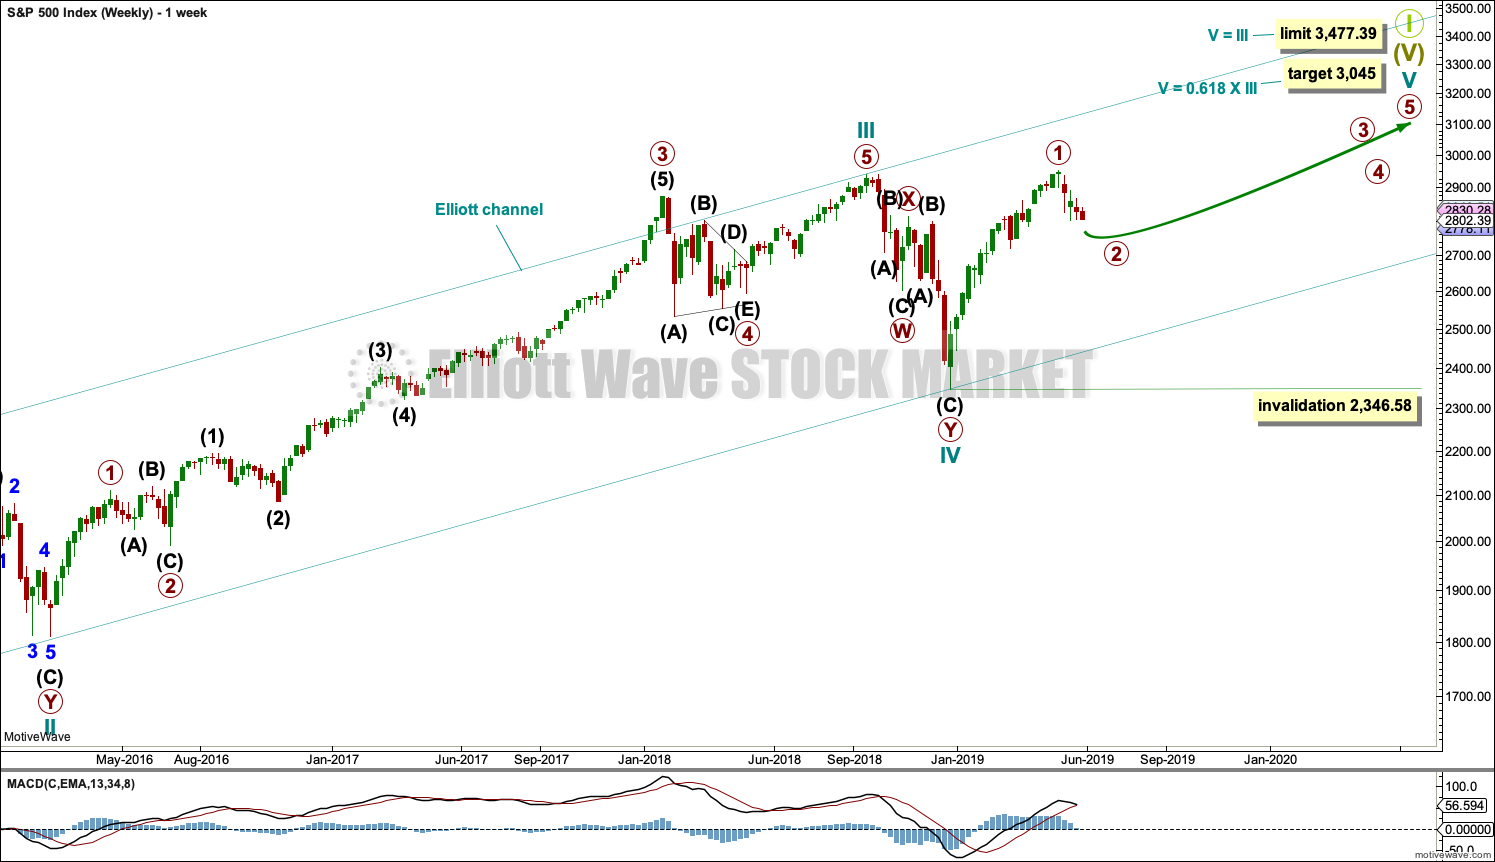
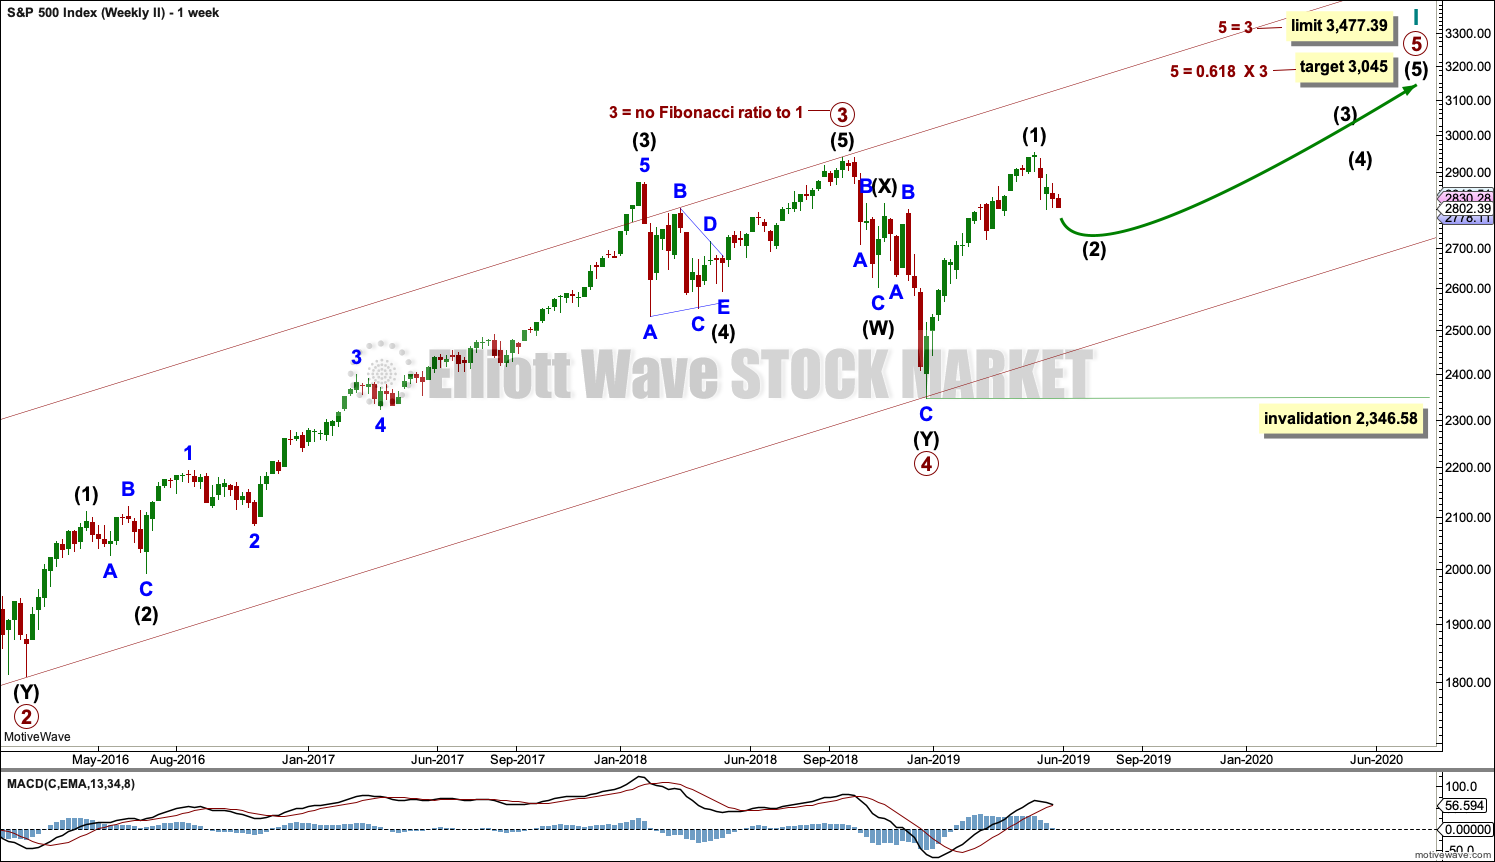
The basic Elliott wave structure consists of a five wave structure up followed by a three wave structure down (for a bull market). This wave count sees the bull market beginning in March 2009 as an incomplete five wave impulse and now within the last fifth wave, which is labelled cycle wave V. This impulse is best viewed on monthly charts. The weekly chart focusses on the end of it.
Elliott wave is fractal. This fifth wave labelled cycle wave V may end a larger fifth wave labelled Super Cycle wave (V), which may end a larger first wave labelled Grand Super Cycle wave I.
The teal Elliott channel is drawn using Elliott’s first technique about the impulse of Super Cycle wave (V). Draw the first trend line from the end of cycle wave I (off to the left of the chart, the weekly candlestick beginning 30th November 2014) to the end of cycle wave III, then place a parallel copy on the end of cycle wave II. This channel perfectly shows where cycle wave IV ended at support. The strongest portion of cycle wave III, the end of primary wave 3, overshoots the upper edge of the channel. This is a typical look for a third wave and suggests the channel is drawn correctly and the way the impulse is counted is correct.
Within Super Cycle wave (V), cycle wave III is shorter than cycle wave I. A core Elliott wave rule states that a third wave may never be the shortest. For this rule to be met in this instance, cycle wave V may not be longer in length than cycle wave III. This limit is at 3,477.39.
A final target is calculated at cycle degree for the impulse to end.
The structure of cycle wave V is focussed on at the daily chart level below.
Within cycle wave V, primary wave 2 may not move beyond the start of primary wave 1 below 2,346.58.
In historic analysis, two further monthly charts have been published that do not have a limit to upwards movement and are more bullish than this wave count. Members are encouraged to consider those possibilities (links below summary) alongside the wave counts presented on a daily and weekly basis.
DAILY CHART
Click chart to enlarge.
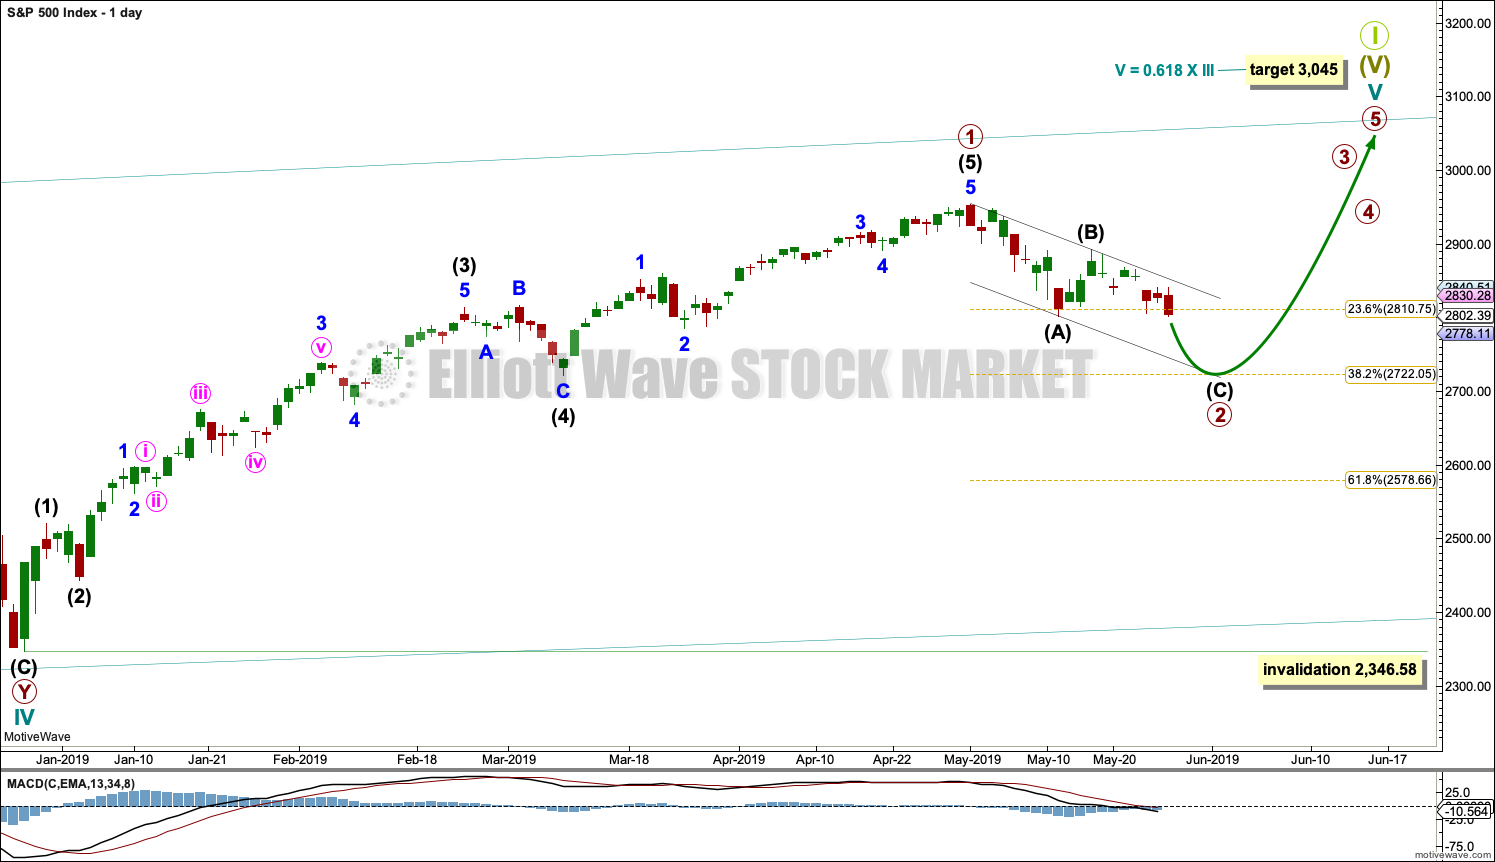
Cycle wave V must subdivide as a five wave motive structure. Within that five wave structure, primary wave 1 may be complete. Primary wave 2 may now continue lower as a zigzag, which may end in another one to two weeks.
Primary wave 3 must move above the end of primary wave 1.
When primary wave 3 is over, then primary wave 4 may be a shallow sideways consolidation that may not move into primary wave 1 price territory below 2,954.13.
Thereafter, primary wave 5 should move above the end of primary wave 3 to avoid a truncation.
Primary wave 2 may not move beyond the start of primary wave 1 below 2,346.58.
Draw a channel about primary wave 2 using Elliott’s technique. Draw the first trend line from the start of intermediate wave (A) to the end of intermediate wave (B), then place a parallel copy on the end of intermediate wave (A). While primary wave 2 continues lower, any bounces should continue to find resistance at the upper edge of this channel. Copy the channel over to the hourly chart.
FIRST HOURLY CHART
Click chart to enlarge.
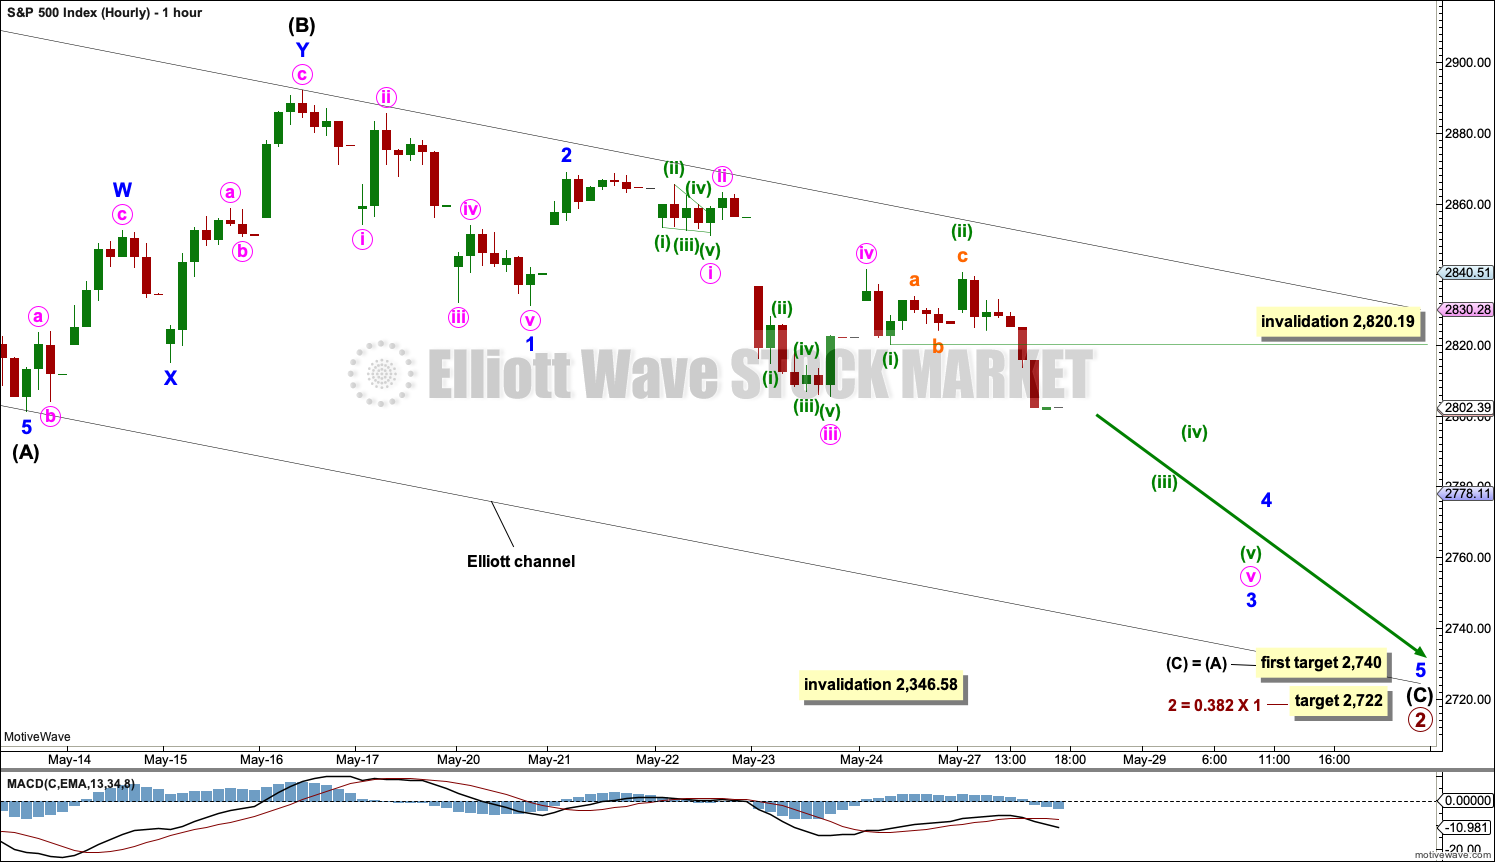
With strong downwards movement today pushed lower by a strong increase in volume, and price closing near the low for the session, this is now the most likely short-term wave count by a fair margin.
It is possible that primary wave 2 is an incomplete zigzag, and within it intermediate wave (B) is complete. This wave count expects downwards movement this week to complete intermediate wave (C) and in turn complete the zigzag of primary wave 2.
Within intermediate wave (C), labelling is slightly changed today to see minor wave 1 complete lower. Minor wave 2 is also still seen as complete, and minor wave 3 has still possibly moved through the middle strongest portion.
Minor wave 3 may only subdivide as an impulse. Within minor wave 3, minute waves i through to iv may be complete. Minute wave v may be extending.
Within minute wave v, minuette waves (i) and (ii) may be complete. Minuette wave (iv) may not move into minuette wave (i) price territory above 2,820.19.
Intermediate wave (C) may end at support about the lower edge of the black Elliott channel.
SECOND HOURLY CHART
Click chart to enlarge.
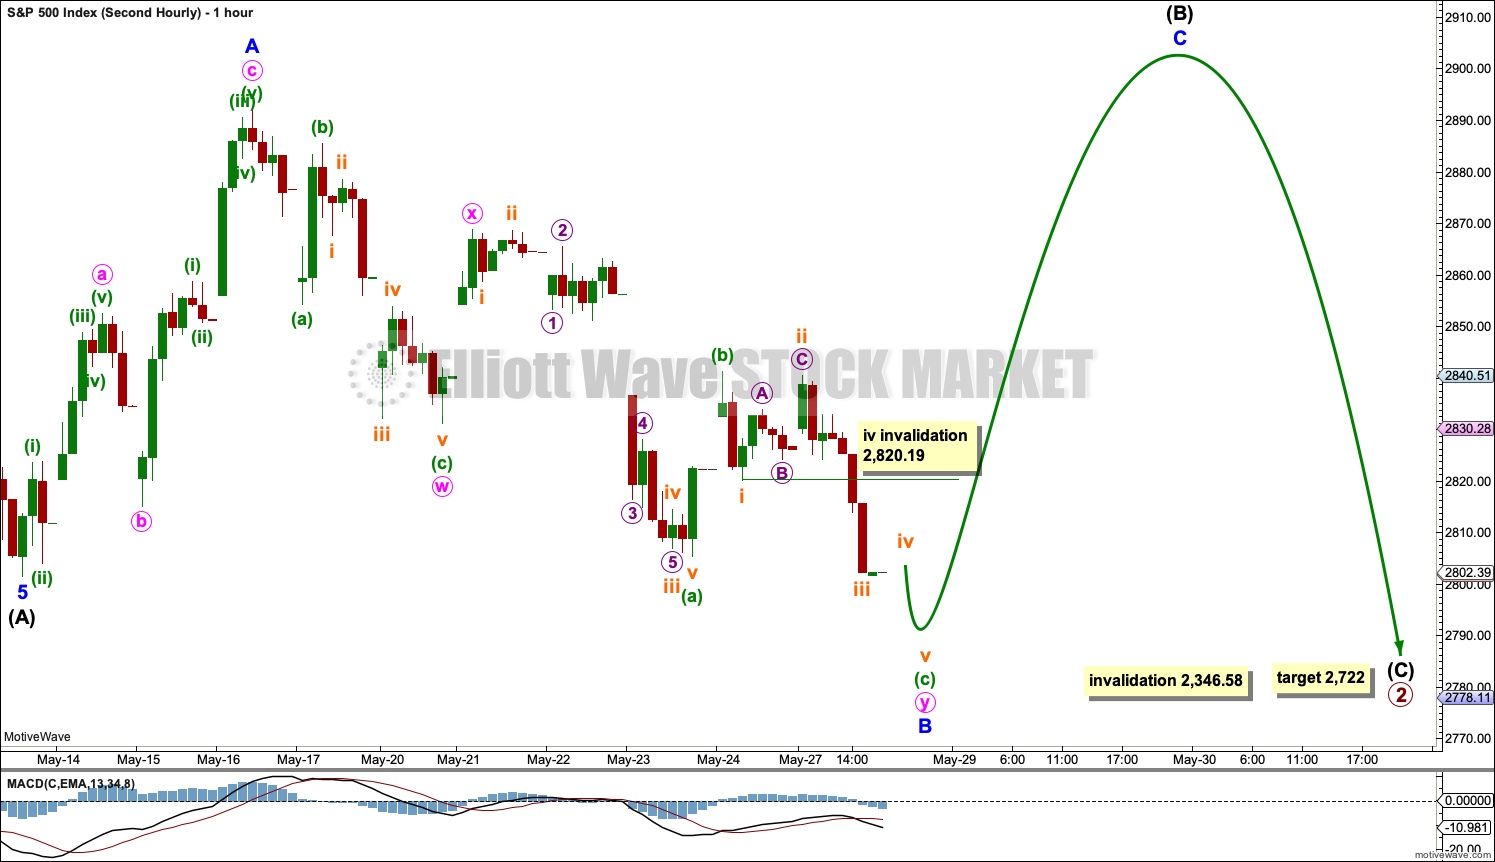
This wave count has now reduced in probability.
This wave count allows for sideways movement for another one to two weeks before a final wave down to complete the pullback labelled primary wave 2.
Intermediate wave (B) may not move beyond the start of intermediate wave (A) above 2,954.01.
Intermediate wave (B) may be unfolding sideways as a flat correction. Within intermediate wave (B), minor wave B has met and passed the minimum requirement to retrace 0.9 the length of minor wave A. At 2,796.89 minor wave B would reach 1.05 the length of minor wave A. This is the requirement for wave B within an expanded flat. Expanded flats are fairly common structures, particularly in B wave positions.
When minor wave B may again be complete, then minor wave C should move above the end of minor wave A to avoid a truncation.
THIRD HOURLY CHART

Click chart to enlarge.
This third hourly chart is identical to the second up to the low labelled intermediate wave (A). Thereafter, it considers a different structure for intermediate wave (B).
Intermediate wave (B) may continue sideways as a running contracting or running barrier triangle. For both possibilities, minor wave B may have continued lower to complete as a double zigzag. Only one of the five triangle sub-waves may subdivide as a multiple, and while wave C most commonly does this sometimes wave B may do so. All remaining sub-waves must subdivide as single zigzags.
Within a contracting triangle (the more common type), minor wave C may not move beyond the end of minor wave A above 2,892.15. Thereafter, minor wave D may not move beyond the end of minor wave B below 2,831.29. Finally, minor wave E may not move above the end of minor wave C.
Within a barrier triangle (less common), minor wave C may not move beyond the end of minor wave A above 2,892.15. Thereafter, minor wave D should end about the same level as minor wave B at 2,831.29. A barrier triangle would remain valid as long as the B-D trend line remains essentially flat. This rule is the only Elliott wave rule which involves any degree of subjectivity. Finally, minor wave E may not move above the end of minor wave C.
A triangle may see price move sideways for another one to maybe two or even three weeks.
Elliott wave triangles are tricky structures to label correctly as they unfold, so some flexibility is essential with them. It is possible that labelling of this triangle may need to change again as price continues sideways. It is easy to label an Elliott wave triangle complete before it is so. Patience is required.
SECOND WAVE COUNT
WEEKLY CHART
Click chart to enlarge.
This weekly chart is almost identical to the first weekly chart, with the sole exception being the degree of labelling.
This weekly chart moves the degree of labelling for the impulse beginning in March 2009 all down one degree. This difference is best viewed on monthly charts.
The impulse is still viewed as nearing an end; a fifth wave is still seen as needing to complete higher. This wave count labels it primary wave 5.
ALTERNATE WAVE COUNT
WEEKLY CHART
Click chart to enlarge.
It is possible that for the second wave count cycle wave I could be complete. Primary wave 5 may be seen as a complete five wave impulse on the daily chart.
If cycle wave I is complete, then cycle wave II may meet the definition of a bear market with a 20% drop in price at its end.
Within cycle wave I, primary wave 1 was a very long extension and primary wave 3 was shorter than primary wave 1 and primary wave 5 was shorter than primary wave 3. Because primary wave 1 was a long extension cycle wave II may end within the price range of primary wave 2, which was from 2,132 to 1,810. The 0.382 retracement of cycle wave I is within this range.
Cycle wave II may not move beyond the start of cycle wave I below 666.79.
This wave count does not have support at this time from classic technical analysis.
TECHNICAL ANALYSIS
WEEKLY CHART
Click chart to enlarge. Chart courtesy of et=”_blank”>StockCharts.com.
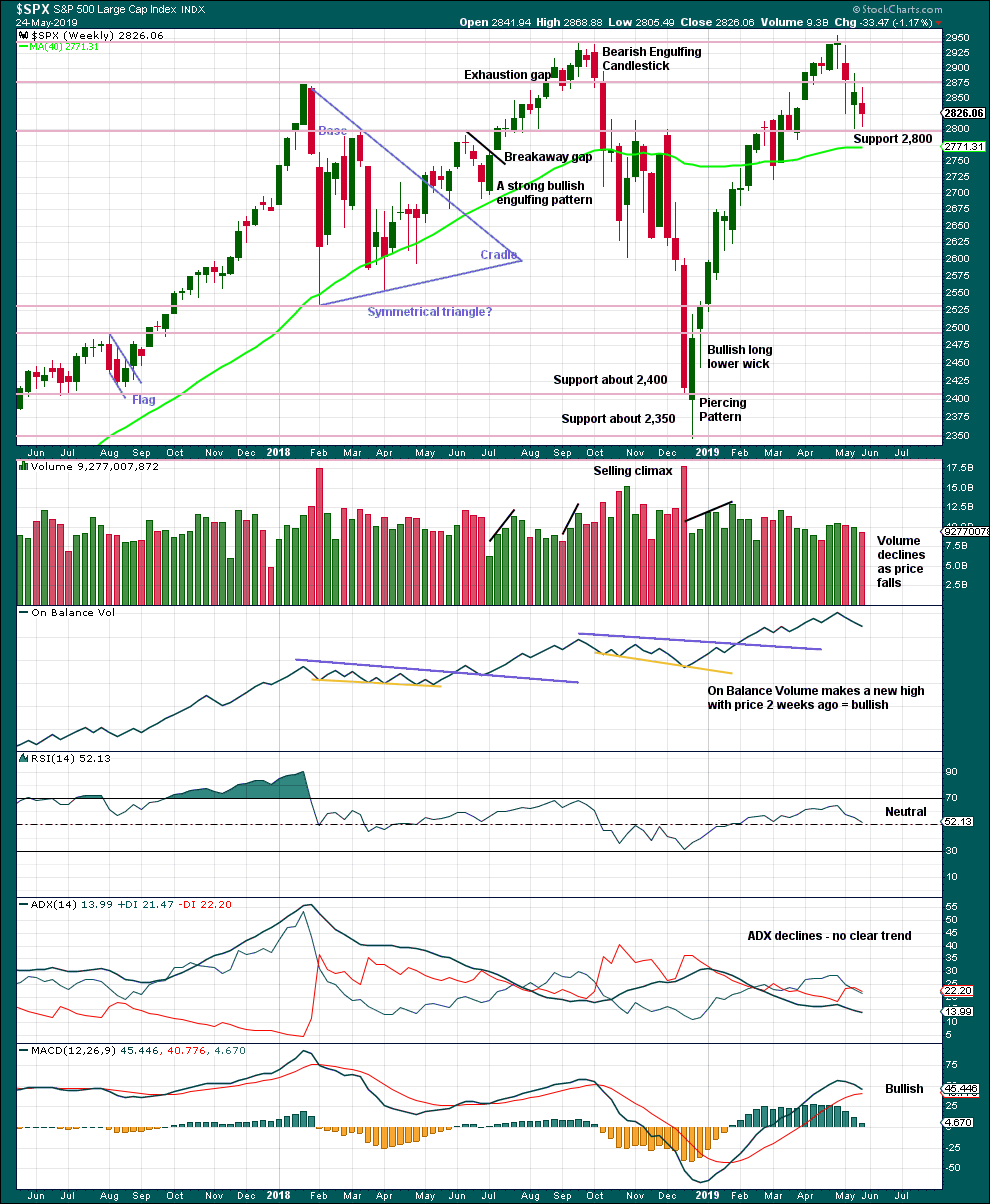
There is an upwards trend from the low in December 2018, a series of higher highs and higher lows with a new all time high on the 30th of April 2019. While the last swing low at 2,785.02 on the 25th of March remains intact, then this view should remain dominant.
The trend is your friend.
Last week closes red, but price has moved sideways. The balance of volume was downwards and volume is not pushing price lower. Overall, this is neutral.
DAILY CHART
Click chart to enlarge. Chart courtesy of StockCharts.com.
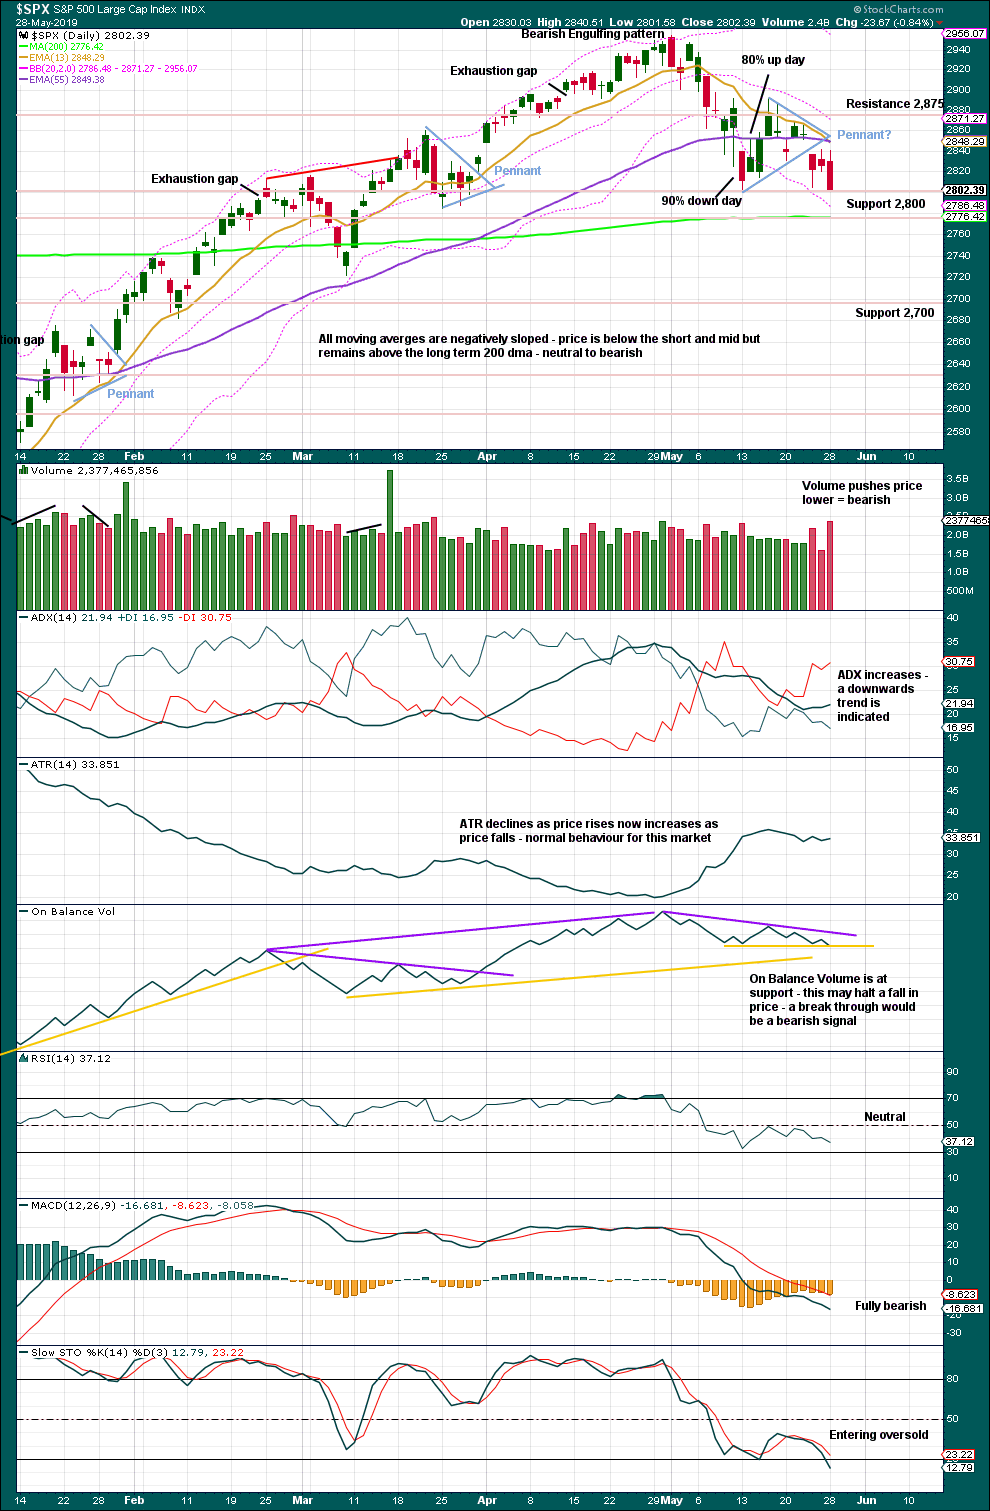
A small pennant pattern may be complete and followed by a downwards breakout, which has support from volume. The target is about 2,690.
Tuesday has completed a strong bearish candlestick with price closing about the low for the session and volume pushing price strongly lower. It looks highly likely that price may continue lower tomorrow.
It now looks like the idea of a low in place for the 13th of May was wrong.
BREADTH – AD LINE
WEEKLY CHART
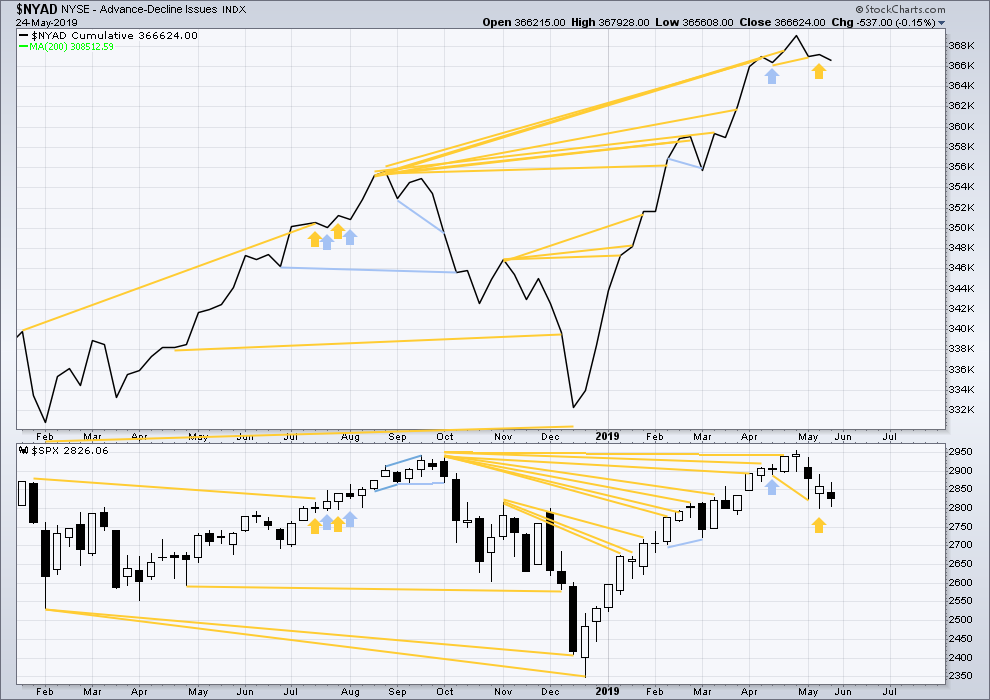
Click chart to enlarge. Chart courtesy of StockCharts.com. So that colour blind members are included, bearish signals
will be noted with blue and bullish signals with yellow.
Bear markets from the Great Depression and onwards have been preceded by an average minimum of 4 months divergence between price and the AD line with only two exceptions in 1946 and 1976. With the AD line making a new all time high on the 3rd of May, the end of this bull market and the start of a new bear market is very likely a minimum of 4 months away, which is the beginning of September 2019.
In all bear markets in the last 90 years there is some positive correlation (0.6022) between the length of bearish divergence and the depth of the following bear market. No to little divergence is correlated with more shallow bear markets. Longer divergence is correlated with deeper bear markets.
If a bear market does develop here, it comes after no bearish divergence. It would therefore more likely be shallow. The alternate Elliott wave count outlines this potential scenario.
Last week price has moved sideways and the candlestick has closed red. A decline in breath this week supports downwards movement within the week. There is no short-term divergence.
Last week all of small, mid and large caps moved sideways.
DAILY CHART
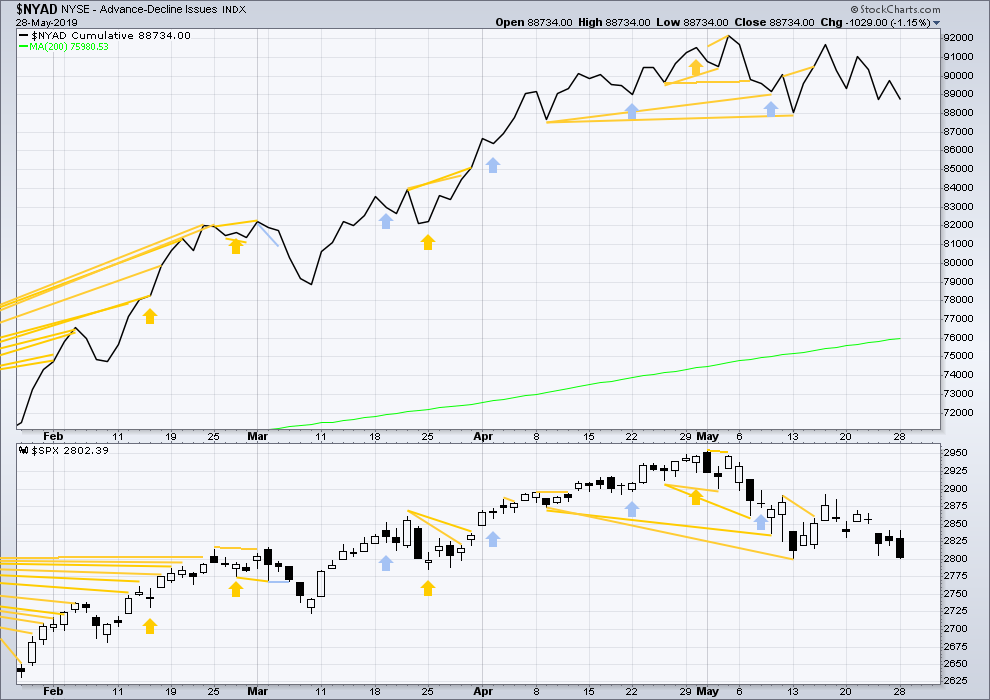
Click chart to enlarge. Chart courtesy of StockCharts.com. So that colour blind members are included, bearish signals
will be noted with blue and bullish signals with yellow.
Breadth should be read as a leading indicator.
Mid-term bullish divergence remains and supports the view here that a low may be in place.
On Tuesday both price and the AD line have moved lower. Neither have yet made new swing lows below the prior swing low of the 13th of May. There is no new short-term divergence.
VOLATILITY – INVERTED VIX CHART
WEEKLY CHART
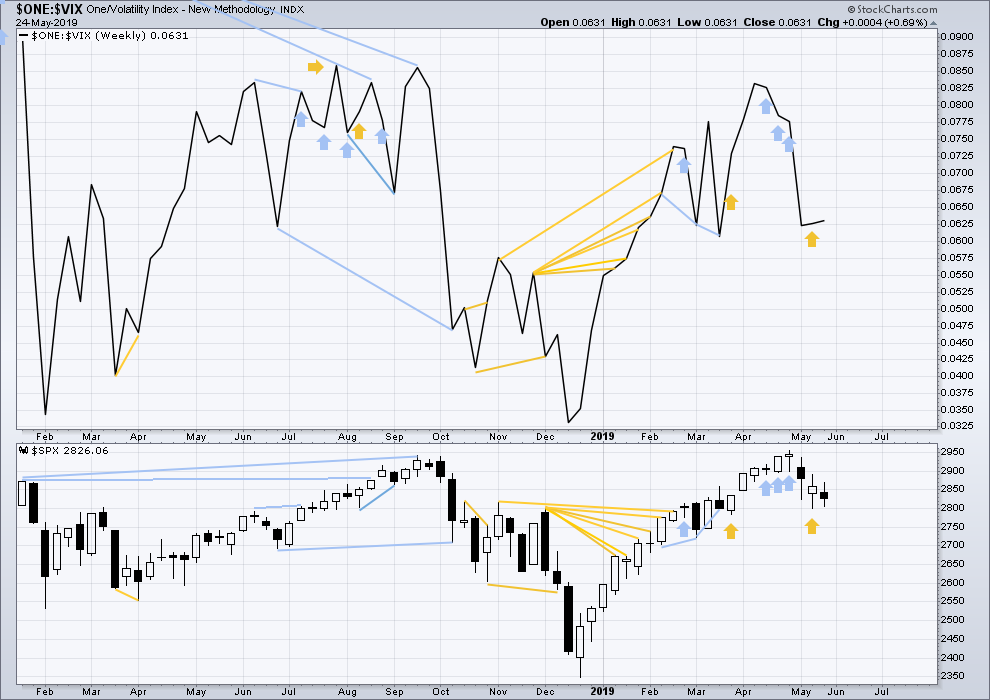
Click chart to enlarge. Chart courtesy of StockCharts.com. So that colour blind members are included, bearish signals
will be noted with blue and bullish signals with yellow.
Three weeks in a row of weekly bearish divergence has now been followed by two reasonable downwards weeks. It may be resolved here, or it may yet be an indication of further downwards movement in price.
Last week price has completed an inside week. Inverted VIX has moved slightly higher. There is no short-term divergence.
DAILY CHART
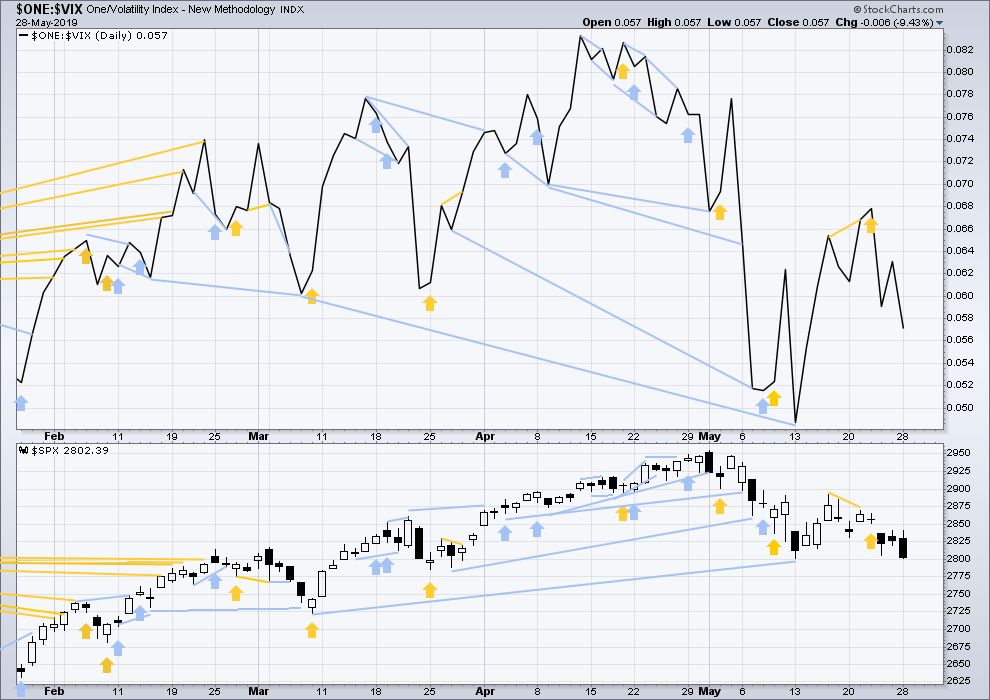
Click chart to enlarge. Chart courtesy of StockCharts.com. So that colour blind members are included, bearish signals
will be noted with blue and bullish signals with yellow.
On Tuesday price and inverted VIX both moved lower. Neither have yet made new swing lows below the prior low of the 13th of May. There is no short-term divergence.
DOW THEORY
Dow Theory confirmed a bear market in December 2018. This does not necessarily mean a bear market at Grand Super Cycle degree though; Dow Theory makes no comment on Elliott wave counts. On the 25th of August 2015 Dow Theory also confirmed a bear market. The Elliott wave count sees that as part of cycle wave II. After Dow Theory confirmation of a bear market in August 2015, price went on to make new all time highs and the bull market continued.
DJIA: 23,344.52 – a close on the 19th of December at 23,284.97 confirms a bear market.
DJT: 9,806.79 – price has closed below this point on the 13th of December.
S&P500: 2,532.69 – a close on the 19th of December at 2,506.96 provides support to a bear market conclusion.
Nasdaq: 6,630.67 – a close on the 19th of December at 6,618.86 provides support to a bear market conclusion.
With all the indices moving now higher, Dow Theory would confirm a bull market if the following highs are made:
DJIA: 26,951.81
DJT: 11,623.58
S&P500: 2,940.91 – a new all time high has been made on the 29th of April 2019.
Nasdaq: 8,133.30 – a new high has been made on 24th of April 2019.
Published @ 10:41 a.m. EST on May 25, 2019.
—
Careful risk management protects your trading account(s).
Follow my two Golden Rules:
1. Always trade with stops.
2. Risk only 1-5% of equity on any one trade.
—
New updates to this analysis are in bold.
My apologies everyone, I’m not able to give you updated hourly charts today. It looks like the main hourly is unfolding as expected so far.
Mind the gaps!
They will tell you all you need to know…
SPX low today right around the 200 day sma, a 78.6% retrace level and a 1.27% extension of the A (or W) down.
Perhaps I have bull eyes but it’s possible this is it for the overall 2 down. I’m watching for buy triggers on the hourly now.
that 12:30 tail candle sure is enticing …
but probably one more here to finish minor 3
Premarket open it looks like SPX will be down hard to open. The next major support is at the 200 day ma. Below that is the lower channel line on the hourly charts. Additional support may come at Fibonacci retracement levels.
I am watching the McClellan Oscillator to go below it lower BB which is currently about -65. This would put us at the May 13th level and set up a potential buy signal.
It seems I can never set my vacations to slow market activity. I am leaving tomorrow (Thursday) morning for a night and two days in the mountain wilderness. The bears have emerged from their winter dens and are on the prowl for food such a young elk. I will be in the area I last spotted a large black bear in 2015. in any event, I am hoping the current downwards action will extend into next week when I can go long.
Have a great day everyone and a wonderful week. For those who cannot get good coffee, my sympathies. I live in the Pacific Northwest of the USA which is an area known for its good coffee.
Hi