
A downwards swing failed to make a new low today. Three out of four short-term Elliott wave counts now remain valid.
Summary: The low of December 2018 is expected to remain intact, and this pullback is expected to be followed by a strong third wave up to new all time highs.
Two scenarios remain possible for the short term:
1. Some sideways movement continues before a final wave down to about 2,722 completes the pullback in two or three weeks time. A target calculated from the potential pennant pattern is about 2,690.
2. A pullback ends this week about 2,740 or 2,722.
The biggest picture, Grand Super Cycle analysis, is here.
Monthly charts were last published here, with video here. There are two further alternate monthly charts here, with video here.
ELLIOTT WAVE COUNTS
The two Elliott wave counts below will be labelled First and Second rather than main and alternate as they may be about of even probability. When the fifth wave currently unfolding on weekly charts may be complete, then these two wave counts will diverge on the severity of the expected following bear market. To see an illustration of this future divergence monthly charts should be viewed.
FIRST WAVE COUNT
WEEKLY CHART
Click chart to enlarge.
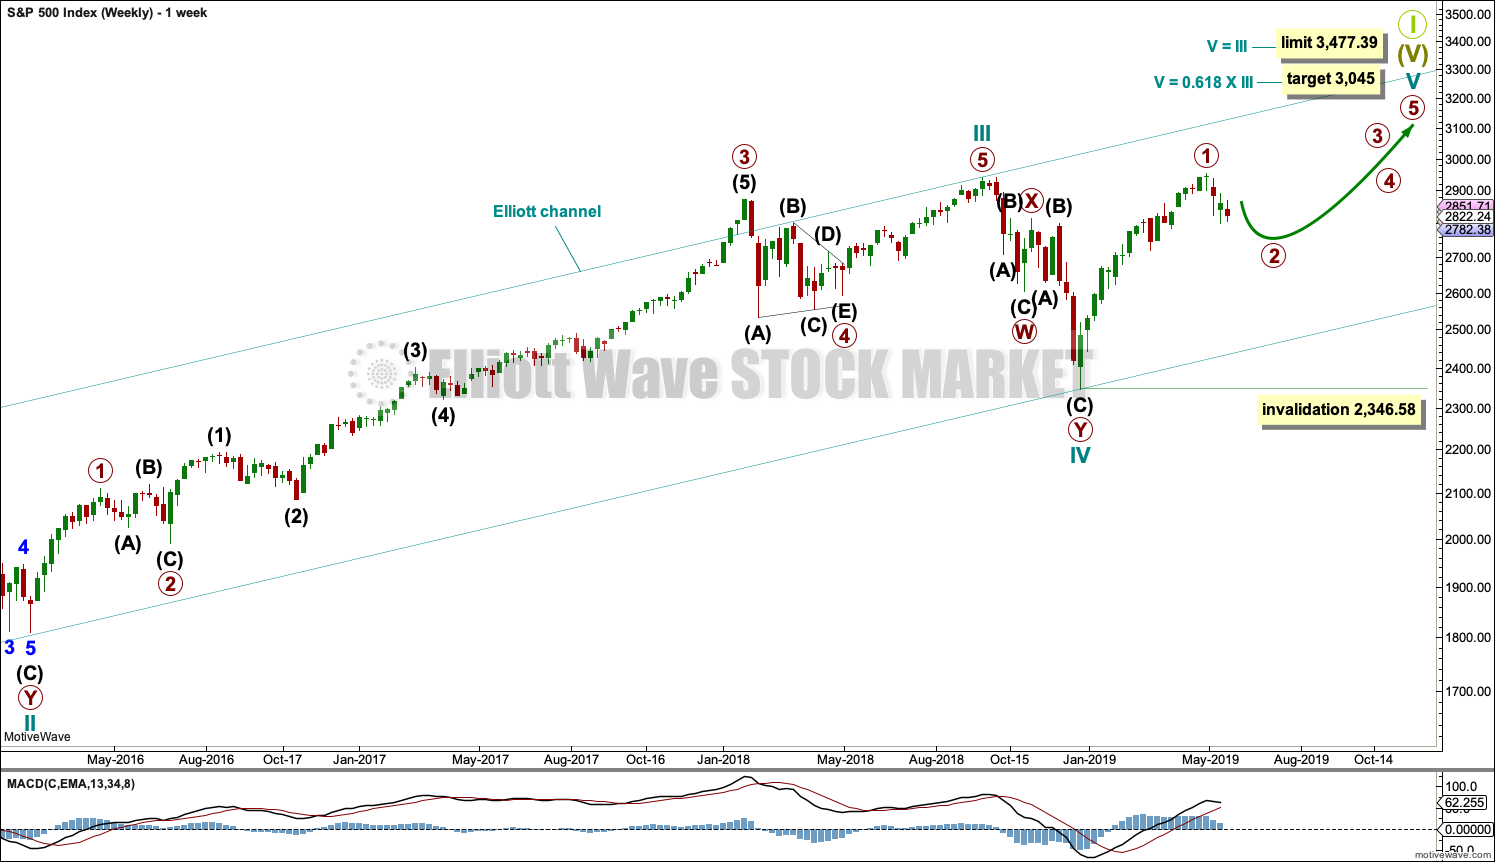
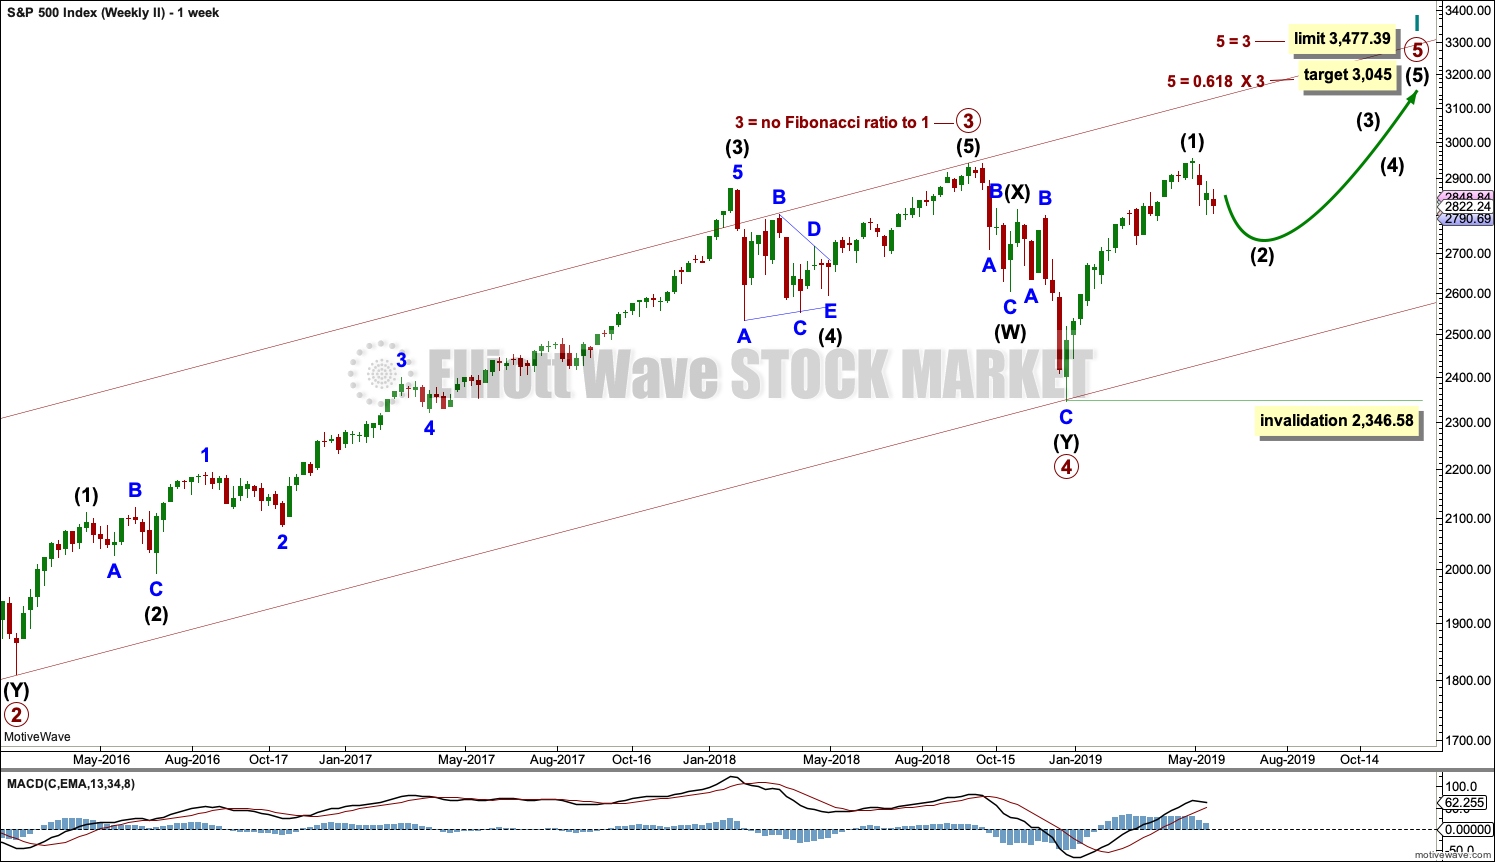
The basic Elliott wave structure consists of a five wave structure up followed by a three wave structure down (for a bull market). This wave count sees the bull market beginning in March 2009 as an incomplete five wave impulse and now within the last fifth wave, which is labelled cycle wave V. This impulse is best viewed on monthly charts. The weekly chart focusses on the end of it.
Elliott wave is fractal. This fifth wave labelled cycle wave V may end a larger fifth wave labelled Super Cycle wave (V), which may end a larger first wave labelled Grand Super Cycle wave I.
The teal Elliott channel is drawn using Elliott’s first technique about the impulse of Super Cycle wave (V). Draw the first trend line from the end of cycle wave I (off to the left of the chart, the weekly candlestick beginning 30th November 2014) to the end of cycle wave III, then place a parallel copy on the end of cycle wave II. This channel perfectly shows where cycle wave IV ended at support. The strongest portion of cycle wave III, the end of primary wave 3, overshoots the upper edge of the channel. This is a typical look for a third wave and suggests the channel is drawn correctly and the way the impulse is counted is correct.
Within Super Cycle wave (V), cycle wave III is shorter than cycle wave I. A core Elliott wave rule states that a third wave may never be the shortest. For this rule to be met in this instance, cycle wave V may not be longer in length than cycle wave III. This limit is at 3,477.39.
A final target is calculated at cycle degree for the impulse to end.
The structure of cycle wave V is focussed on at the daily chart level below.
Within cycle wave V, primary wave 2 may not move beyond the start of primary wave 1 below 2,346.58.
In historic analysis, two further monthly charts have been published that do not have a limit to upwards movement and are more bullish than this wave count. Members are encouraged to consider those possibilities (links below summary) alongside the wave counts presented on a daily and weekly basis.
DAILY CHART
Click chart to enlarge.
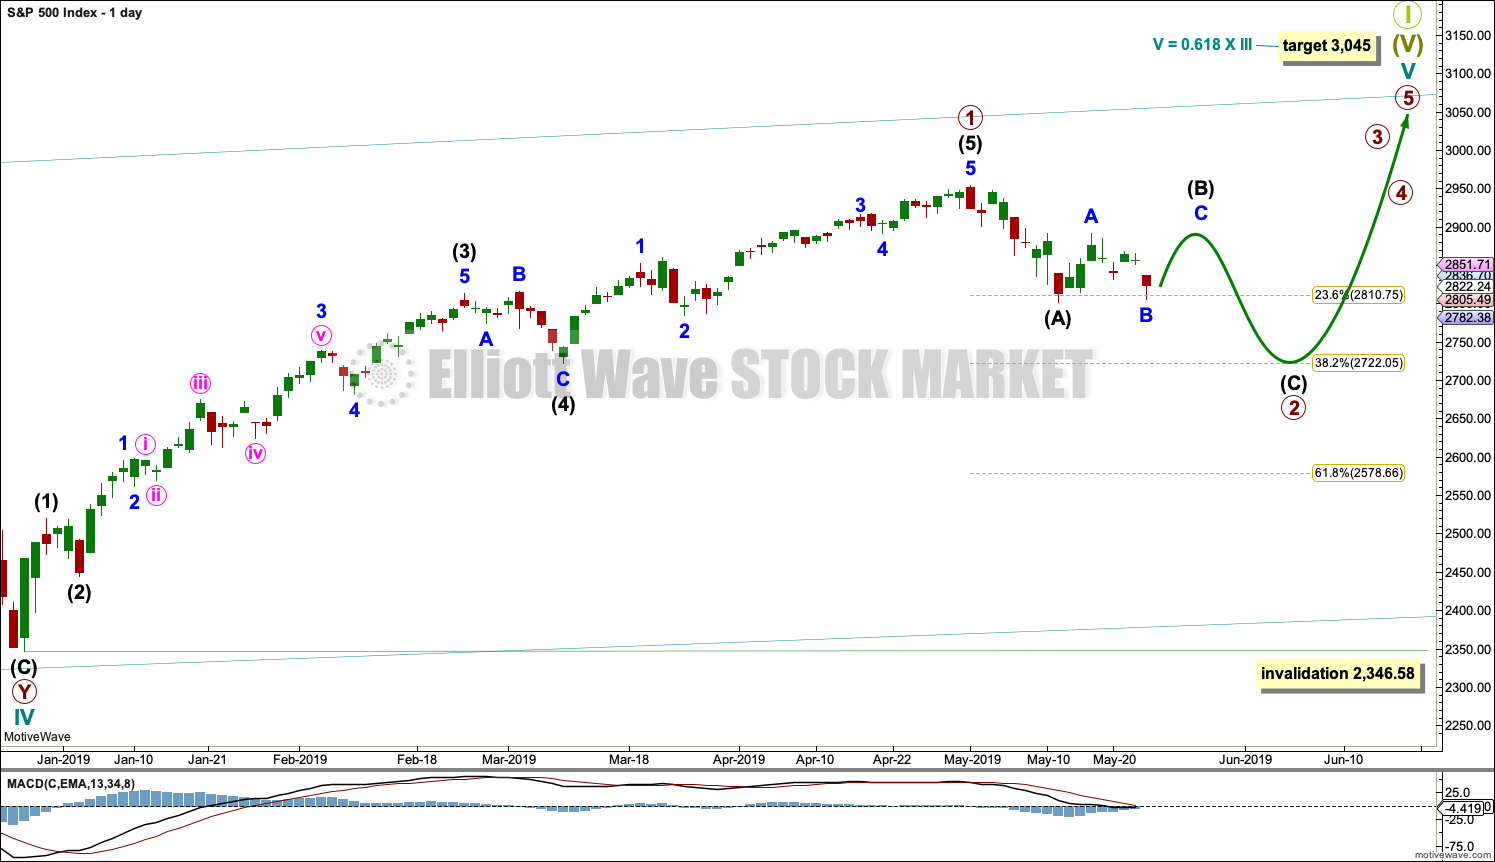
Cycle wave V must subdivide as a five wave motive structure. Within that five wave structure, primary wave 1 may be complete. Primary wave 2 may now continue sideways and / or lower as a zigzag, which may end within another couple of weeks or so. It is also possible that primary wave 2 was over at last week’s low although that scenario has reduced in probability.
Primary wave 3 must move above the end of primary wave 1.
When primary wave 3 is over, then primary wave 4 may be a shallow sideways consolidation that may not move into primary wave 1 price territory below 2,954.13.
Thereafter, primary wave 5 should move above the end of primary wave 3 to avoid a truncation.
Primary wave 2 may not move beyond the start of primary wave 1 below 2,346.58.
Three hourly charts are published today.
FIRST HOURLY CHART
Click chart to enlarge.
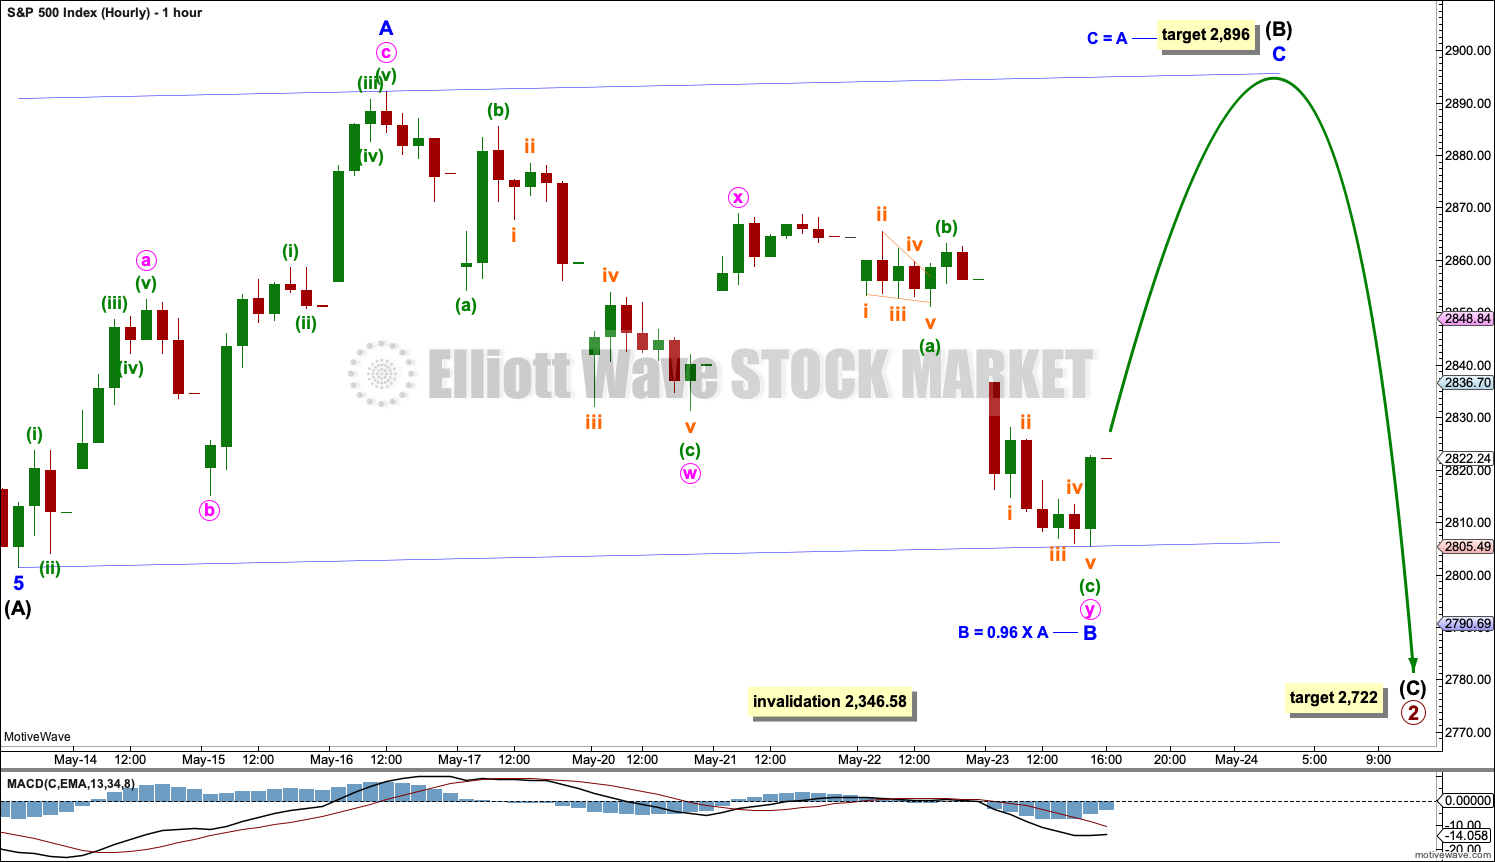
It remains possible that primary wave 2 is incomplete and may be a longer lasting and deeper zigzag. This would have better proportion on the daily and weekly chart.
Intermediate wave (A) subdivides well as a five wave impulse.
This wave count allows for sideways movement for another week to three before a final wave down to complete the pullback labelled primary wave 2.
Intermediate wave (B) may not move beyond the start of intermediate wave (A) above 2,954.01.
Downwards movement within intermediate wave (B) labelled minor wave W has now retraced a minimum 0.9 of minor wave A, so intermediate wave (B) may again be labelled a flat correction because minor wave B within it has met the minimum required length of 0.9 of minor wave A.
This first hourly chart considers the possibility that intermediate wave (B) may be unfolding as a flat. Minor wave A subdivides as a three, and now minor wave B may be a complete three subdividing as a double zigzag. Intermediate wave (B) may be a regular flat correction; these have B waves which are between 0.9 to 1.05 the length of their A waves. Regular flats often fit within trend channels and wave C is usually about equal in length to wave A.
SECOND HOURLY CHART
Click chart to enlarge.
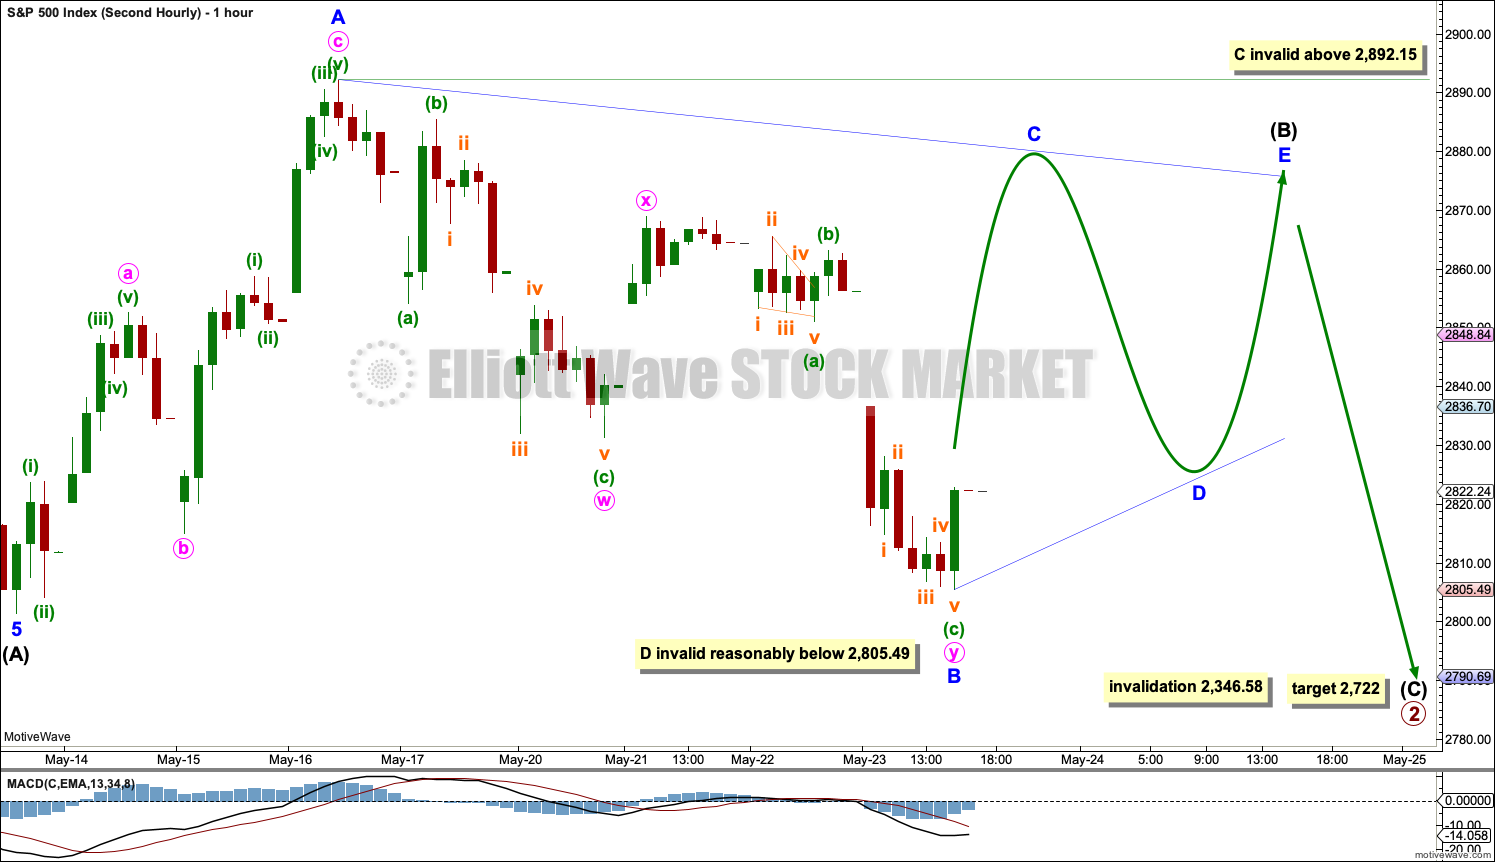
This second hourly chart is identical to the first up to the low labelled intermediate wave (A). Thereafter, it considers a different structure for intermediate wave (B).
Intermediate wave (B) may continue sideways as a regular contracting or regular barrier triangle. For both possibilities, minor wave B today may have continued lower to complete as a double zigzag. Only one of the five triangle sub-waves may subdivide as a multiple, and while wave C most commonly does this sometimes wave B may do so. All remaining sub-waves must now subdivide as single zigzags.
Within a regular contracting triangle (the more common type), minor wave C may not move beyond the end of minor wave A above 2,892.15. Thereafter, minor wave D may not move beyond the end of minor wave B below 2,831.29. Finally, minor wave E may not move above the end of minor wave C.
Within a regular barrier triangle (less common), minor wave C may not move beyond the end of minor wave A above 2,892.15. Thereafter, minor wave D should end about the same level as minor wave B at 2,831.29. A barrier triangle would remain valid as long as the B-D trend line remains essentially flat. This rule is the only Elliott wave rule which involves any degree of subjectivity. Finally, minor wave E may not move above the end of minor wave C.
A triangle may see price move sideways for another one to maybe two or even three weeks.
Elliott wave triangles are tricky structures to label correctly as they unfold, so some flexibility is essential with them. It is possible that labelling of this triangle may need to change again as price continues sideways. It is easy to label an Elliott wave triangle complete before it is so. Patience is required.
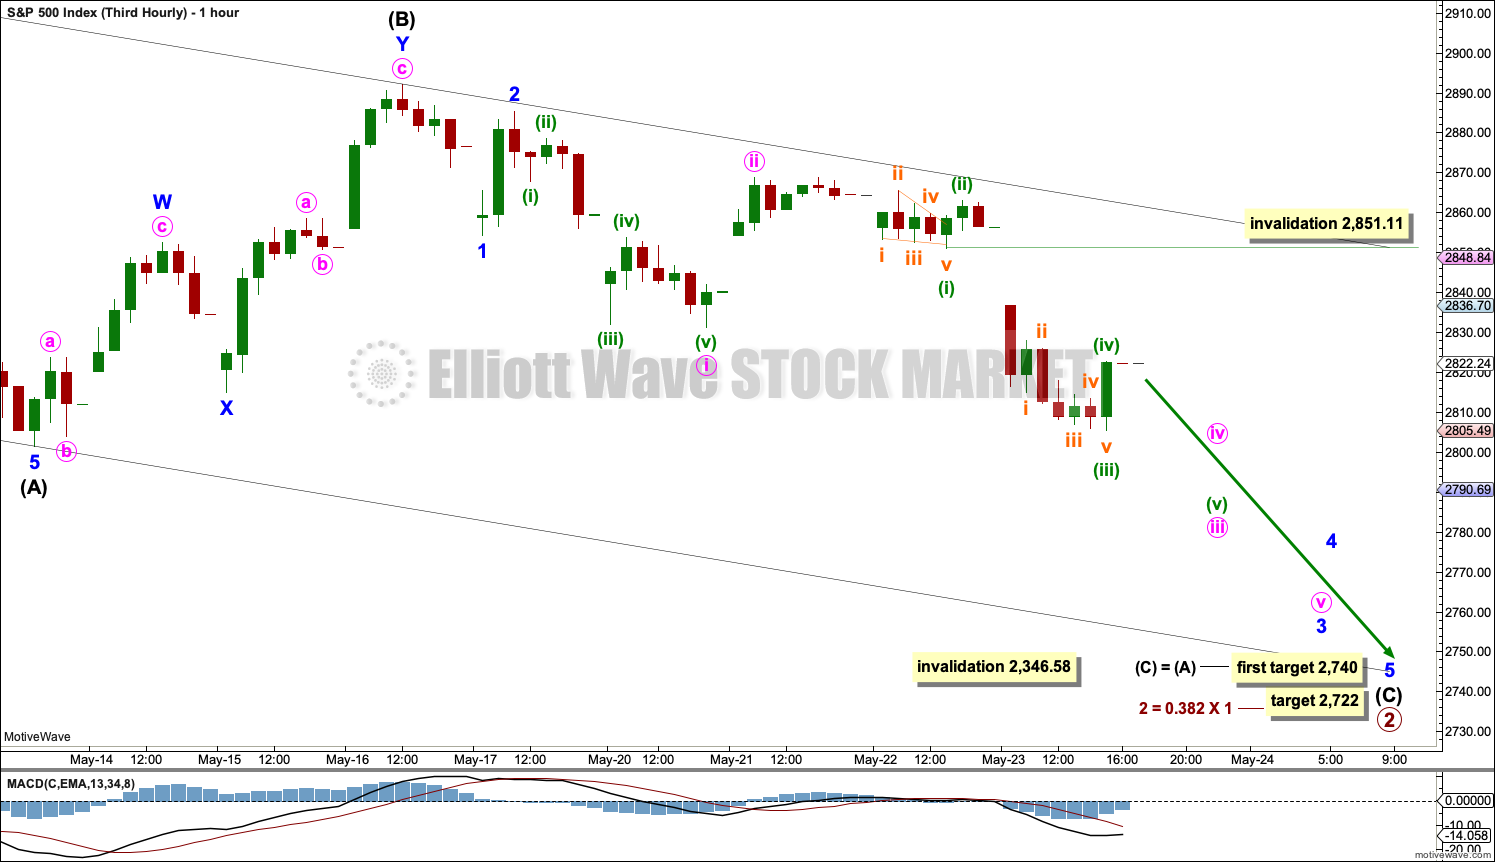
THIRD HOURLY CHART
Click chart to enlarge.
It is possible that primary wave 2 is an incomplete zigzag, and within it intermediate wave (B) is complete. This wave count expects downwards movement this week to complete intermediate wave (C) and in turn complete the zigzag of primary wave 2.
Within intermediate wave (C), minor waves 1 and 2 may now be complete.
Minor wave 3 within intermediate wave (C) may have moved today through the middle strongest portion. This agrees with MACD.
Minuette wave (iv) may not move into minuette wave (i) price territory above 2,851.11.
If intermediate wave (B) is complete, then bounces within intermediate wave (C) should find resistance at the upper edge of the black Elliott channel.
SECOND WAVE COUNT
WEEKLY CHART
Click chart to enlarge.
This weekly chart is identical to the first weekly chart, with the sole exception being the degree of labelling.
This weekly chart moves the degree of labelling for the impulse beginning in March 2009 all down one degree. This difference is best viewed on monthly charts.
The impulse is still viewed as nearing an end; a fifth wave is still seen as needing to complete higher. This wave count labels it primary wave 5.
TECHNICAL ANALYSIS
WEEKLY CHART
Click chart to enlarge. Chart courtesy of et=”_blank”>StockCharts.com.
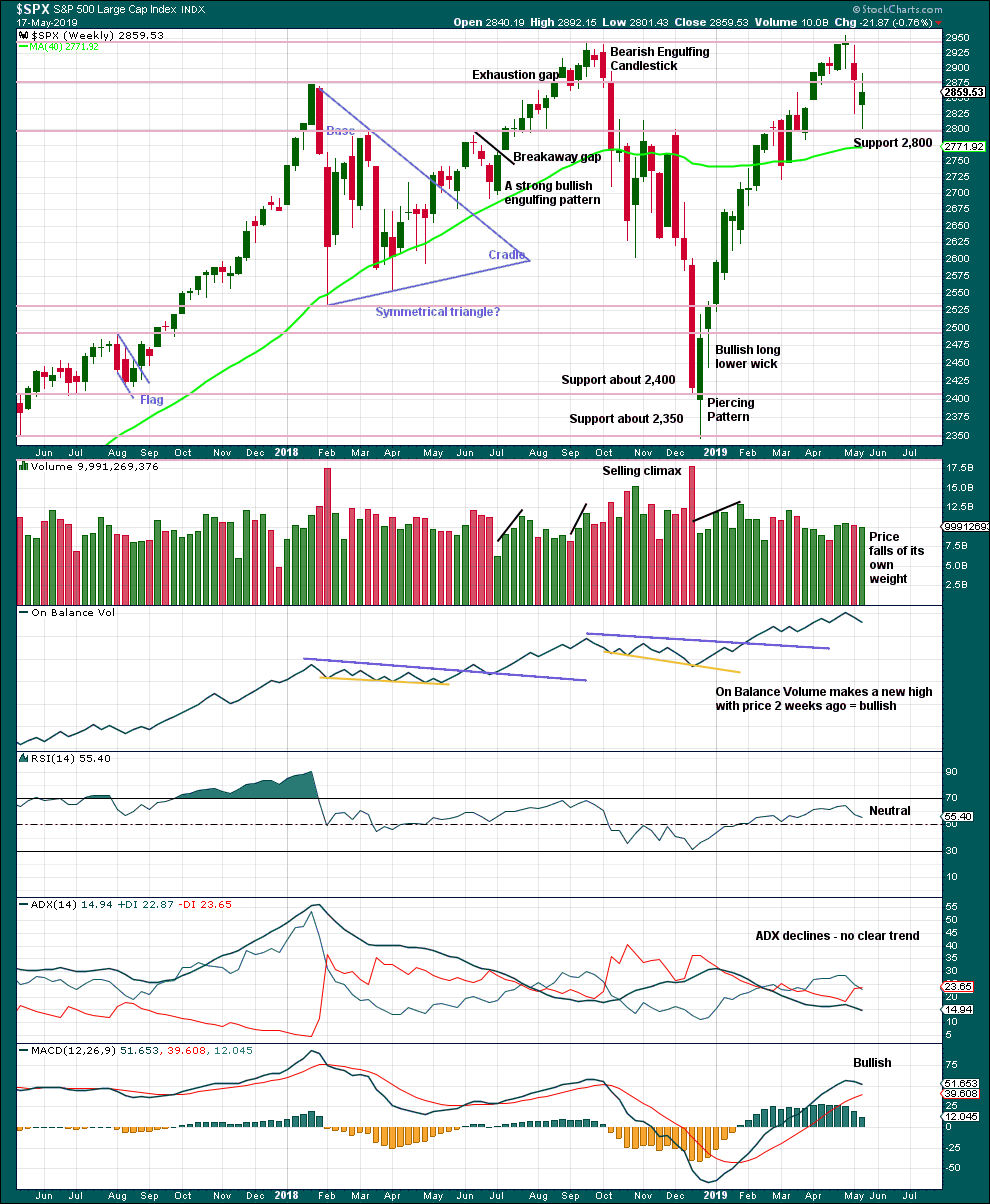
This week looks like a spinning top, although the real body may be too large for a typical spinning top. This puts the trend towards neutral. Support about 2,800 is strong and has so far held this week.
There is an upwards trend from the low in December 2018, a series of higher highs and higher lows with a new all time high on the 30th of April 2019. While the last swing low at 2,785.02 on the 25th of March remains intact, then this view should remain dominant.
The trend is your friend.
DAILY CHART
Click chart to enlarge. Chart courtesy of StockCharts.com.
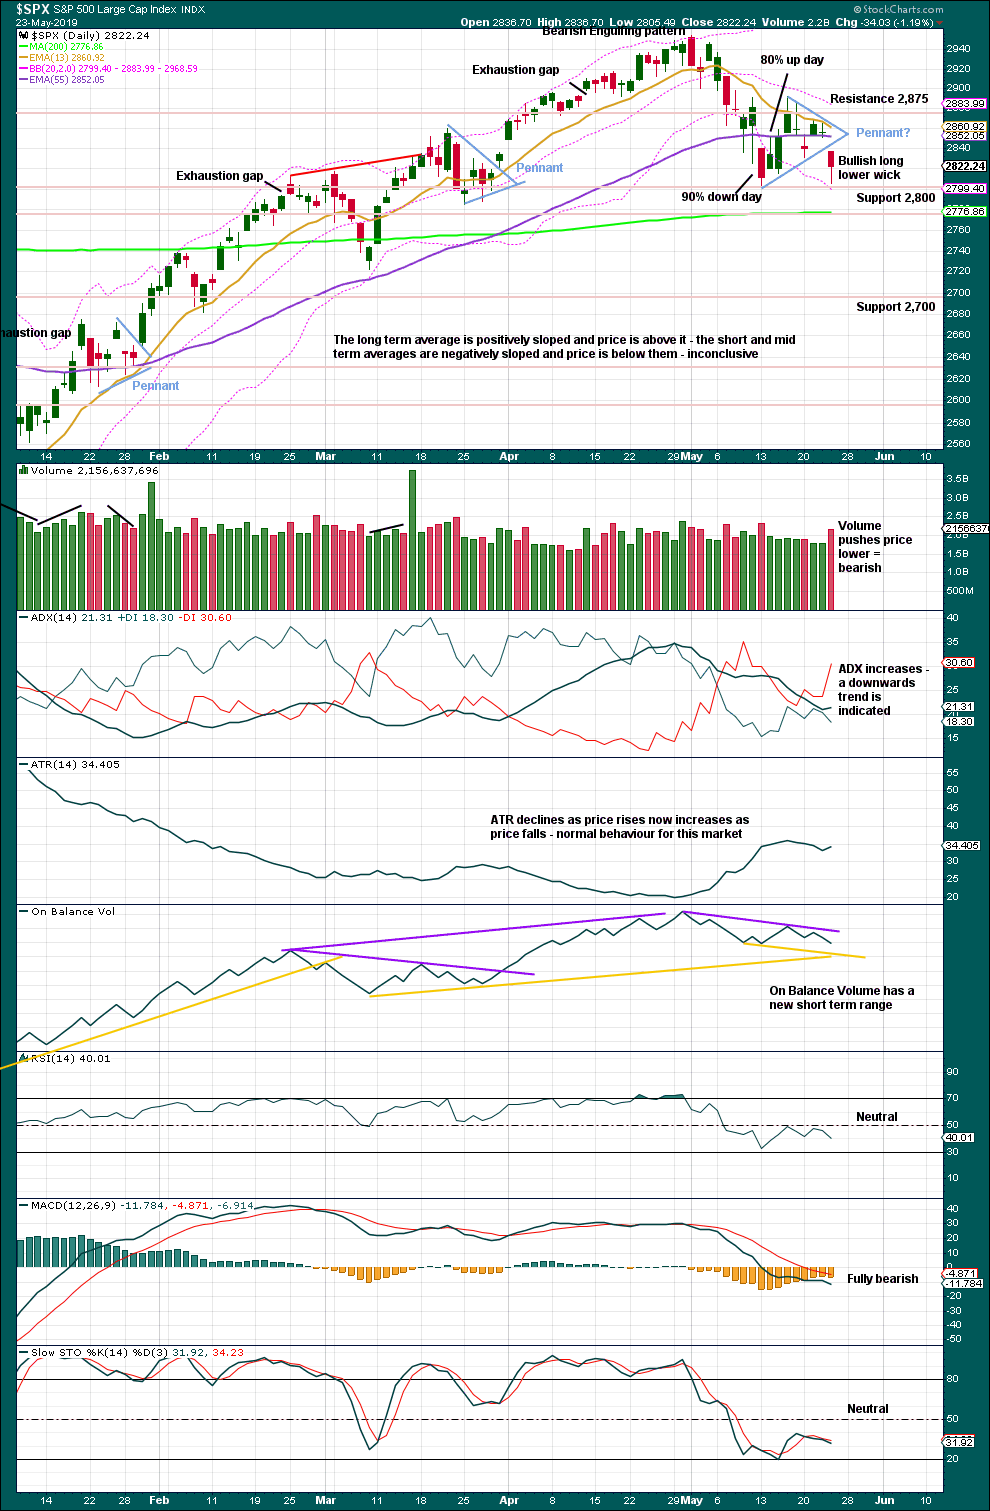
A 90% downwards day at or immediately prior a low followed immediately afterwards by a 90% upwards day is a strong indication of a low in place. The indication is weaker in this case, but the movement is also weaker. The 80% upwards day of the 14th of May shows an almost 180 degree shift in sentiment after the 90% downwards day immediately prior. This is a pattern seen at minor lows. However, upwards movement following the low has not developed strong demand needed to produce a sustained rally. There is now less support for the view that a mid-term low is in place.
The dominant trend is up. Pullbacks in an upwards trend should be used as opportunities to join the trend.
It has been noted before that this market has been rising with light and declining volume at all time frames now for years. A lack of support from volume for upwards movement in the last few sessions is not of a concern in current market conditions.
Watch On Balance Volume carefully this week. A breakout would provide a weak signal that may add a little confidence to the next move from price.
A small pennant pattern may be complete and today may have been a downwards breakout, which has support from volume. The target is about 2,690.
BREADTH – AD LINE
WEEKLY CHART
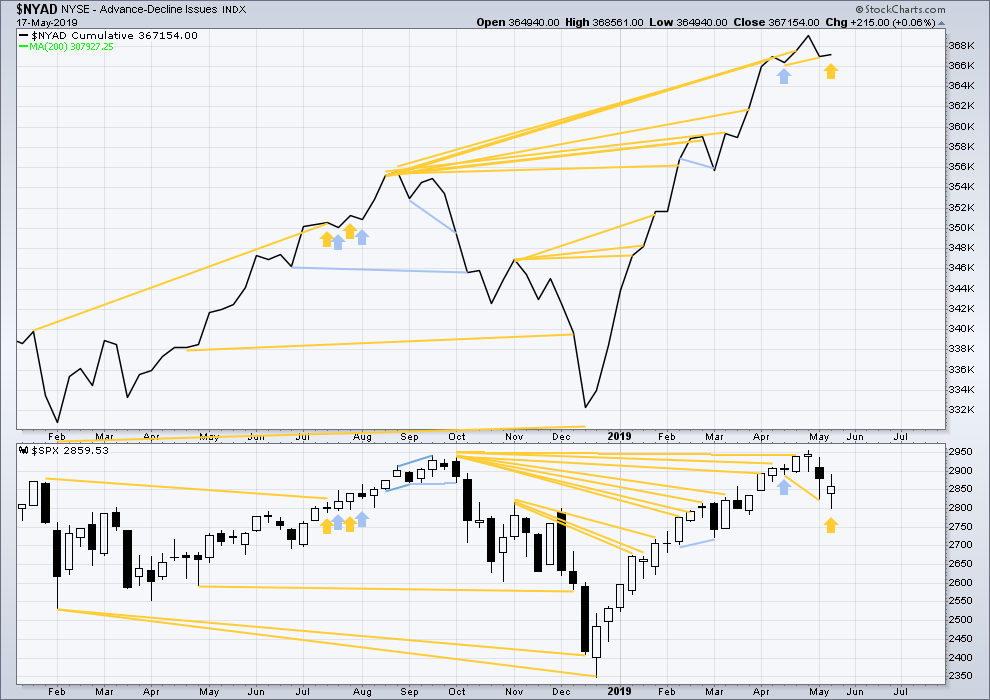
Click chart to enlarge. Chart courtesy of StockCharts.com. So that colour blind members are included, bearish signals
will be noted with blue and bullish signals with yellow.
Every single bear market from the Great Depression and onwards has been preceded by a minimum of 4 months divergence between price and the AD line. With the AD line making a new all time high on the 3rd of May, the end of this bull market and the start of a new bear market must be a minimum of 4 months away, which is the beginning of September 2019.
Last week price has moved lower with a lower low and a lower high, although the candlestick has closed green. The AD line has moved higher. This divergence is bullish and supports the view that a low may now be in place.
Last week all of large, mid and small caps have moved lower. None have made new swing lows below the low of the 25th of March. There is no divergence.
DAILY CHART

Click chart to enlarge. Chart courtesy of StockCharts.com. So that colour blind members are included, bearish signals
will be noted with blue and bullish signals with yellow.
Breadth should be read as a leading indicator.
Mid-term bullish divergence remains and supports the view here that a low may be in place.
Today both price and the AD line moved lower. There is no new short-term divergence.
VOLATILITY – INVERTED VIX CHART
WEEKLY CHART
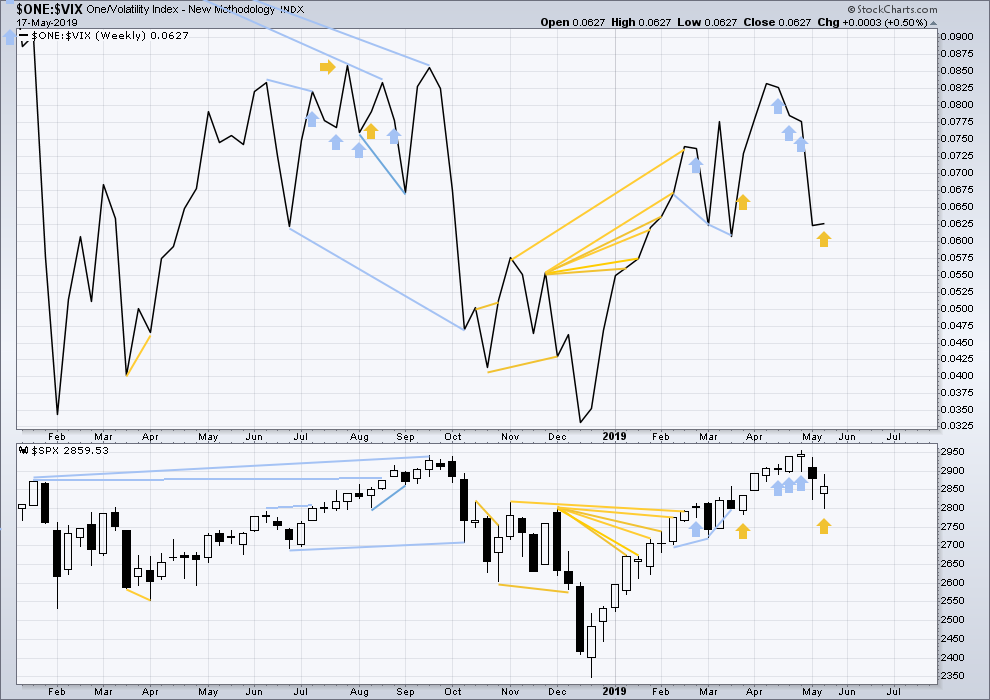
Click chart to enlarge. Chart courtesy of StockCharts.com. So that colour blind members are included, bearish signals
will be noted with blue and bullish signals with yellow.
Three weeks in a row of weekly bearish divergence has now been followed by two reasonable downwards weeks. It may be resolved here, or it may yet be an indication of further downwards movement in price.
Last week price moved lower, but the candlestick has closed green. Inverted VIX has moved higher. This divergence is bullish.
DAILY CHART
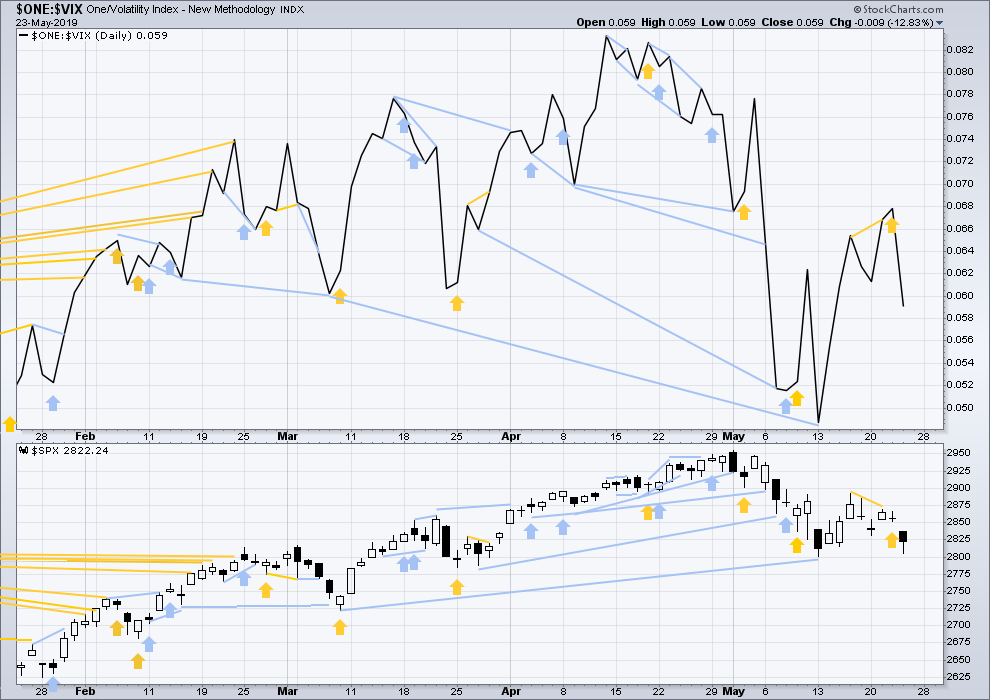
Click chart to enlarge. Chart courtesy of StockCharts.com. So that colour blind members are included, bearish signals
will be noted with blue and bullish signals with yellow.
Bullish divergence noted in yesterday’s analysis (but not given weight) has been followed by downwards movement. It is considered to have failed.
Today both price and inverted VIX have moved lower. There is no new short-term divergence.
DOW THEORY
Dow Theory confirmed a bear market in December 2018. This does not necessarily mean a bear market at Grand Super Cycle degree though; Dow Theory makes no comment on Elliott wave counts. On the 25th of August 2015 Dow Theory also confirmed a bear market. The Elliott wave count sees that as part of cycle wave II. After Dow Theory confirmation of a bear market in August 2015, price went on to make new all time highs and the bull market continued.
DJIA: 23,344.52 – a close on the 19th of December at 23,284.97 confirms a bear market.
DJT: 9,806.79 – price has closed below this point on the 13th of December.
S&P500: 2,532.69 – a close on the 19th of December at 2,506.96 provides support to a bear market conclusion.
Nasdaq: 6,630.67 – a close on the 19th of December at 6,618.86 provides support to a bear market conclusion.
With all the indices moving now higher, Dow Theory would confirm a bull market if the following highs are made:
DJIA: 26,951.81
DJT: 11,623.58
S&P500: 2,940.91 – a new all time high has been made on the 29th of April 2019.
Nasdaq: 8,133.30 – a new high has been made on 24th of April 2019.
Published @ 06:38 p.m. EST.
—
Careful risk management protects your trading account(s).
Follow my two Golden Rules:
1. Always trade with stops.
2. Risk only 1-5% of equity on any one trade.
—
New updates to this analysis are in bold.
Hello everybody. I’m in Houston, which is very exciting for me. They let me in, which was nice, although after the maze of the queue for immigration I was disappointed to not find there was any cheese on offer at the end.
Still, the immigration man did wish me a nice day, although his facial expression did not match his words. It did look like a rather thankless job.
I have slept very well and am making good progress on the end of week analysis. With Friday’s very small range day I do not think you missed much with no end of session update from me.
Great, have wonderful time in US. 🙂
SPY filled the gap, IWM has NOT
Happy for the head fake up, allowed me to exit a UPRO position at a tiny win and get flat there. This market is not healthy (out of this 4 down) yet, obviously. Today “should have” been a run-up day, but popped, stalled, and is now tumbling. 2800 is critical; below that by 10-20 points and watch out below I suspect.
I tried a couple “Dick Diamond” trades with overall losing results, largely I suppose because of the overall market dynamics. AMAT and ANET in particular bit me for losses, while I eeked out very small gains in BLUE and CRON and FLSR. So far my win rate on this “80/20” system is 50/50 overall (3 wins, 3 losers). It should work great on range expansion days (up or down)…but most days aren’t and many days are like today, an initial head fake up…then back down into range. I’ll keep toying with it. If it truly “works” and it’s your primary trading methodology, it’s nice because the vast amount of time you have no money in the market and no exposure. But it has to work reasonably well first.
Kevin….you may wish to take a look at my 2nd comment on yesterday’s analysis if you have not about Dick’s time frame changes and clarity on his options trades.
Note: Dick and his more practiced students strongly suggested that the system worked on any 2 time frame combinations [short term for entry/exit and longer term to keep an eye on mkt. trend for the day] for a short or longer term trade and on most instruments. He did suggest that he was hesitant about the success of it w/Forex.
Good weekend…
Thanks Melanie, I’ll refresh on in on Monday. Off to raft the American River this weekend…happy trails to all!
Dear Melanie,
This morning I read your comments from yesterday. Like the others, I wish to express my condolences and best wishes for you. Last evening I was at a retirement party for my beloved wife of 43 years this July. I cannot even imagine the pain and grief the loss of such a partner will bring. I hope and pray that you find all you need as you make your way in the days, weeks, months and years to come.
Thank you for all the other information you posted. I hope you find the time to continue sharing your insights to the markets and trading tactics / strategies.
Have a great day.
Rodney….thank you for you kind thoughts. 34 years of partnership/marriage for me. Right now, I cannot imagine how I could ever replace my husband. He was 29.5 years older than me and refined, intellectually and culturally. But, I have been ‘blessed’ and honored to have been by his side.
Good weekend to you….
I’m stealing first place today. No, that’s not cheating 🙂
I’m packing up and flying to the other side of the world now. I will not be able to give you an end of session update this Friday.
“See” you all on the other side! (here’s hoping they let me in!)
Good travels. I’m claiming the #2 spot on this one.
Enjoy! 🙂