
Price continues to move sideways. A small pennant pattern may be forming on the daily chart. A target is calculated using the flag pole.
Summary: The low of December 2018 is expected to remain intact, and this pullback is expected to be followed by a strong third wave up to new all time highs.
Three scenarios are possible for the short term:
1. Some sideways movement continues before a final wave down to about 2,722 completes the pullback in two or three weeks time. A target calculated from the potential pennant pattern is about 2,690.
2. A pullback ends this week about 2,740 or 2,722.
3. The pullback is over. Confidence in this view may be had with a new all time high above 2,954.13. The next target would be at 3,033 for another larger consolidation. This target may be met in about a month.
The biggest picture, Grand Super Cycle analysis, is here.
Monthly charts were last published here, with video here. There are two further alternate monthly charts here, with video here.
ELLIOTT WAVE COUNTS
The two Elliott wave counts below will be labelled First and Second rather than main and alternate as they may be about of even probability. When the fifth wave currently unfolding on weekly charts may be complete, then these two wave counts will diverge on the severity of the expected following bear market. To see an illustration of this future divergence monthly charts should be viewed.
FIRST WAVE COUNT
WEEKLY CHART
Click chart to enlarge.
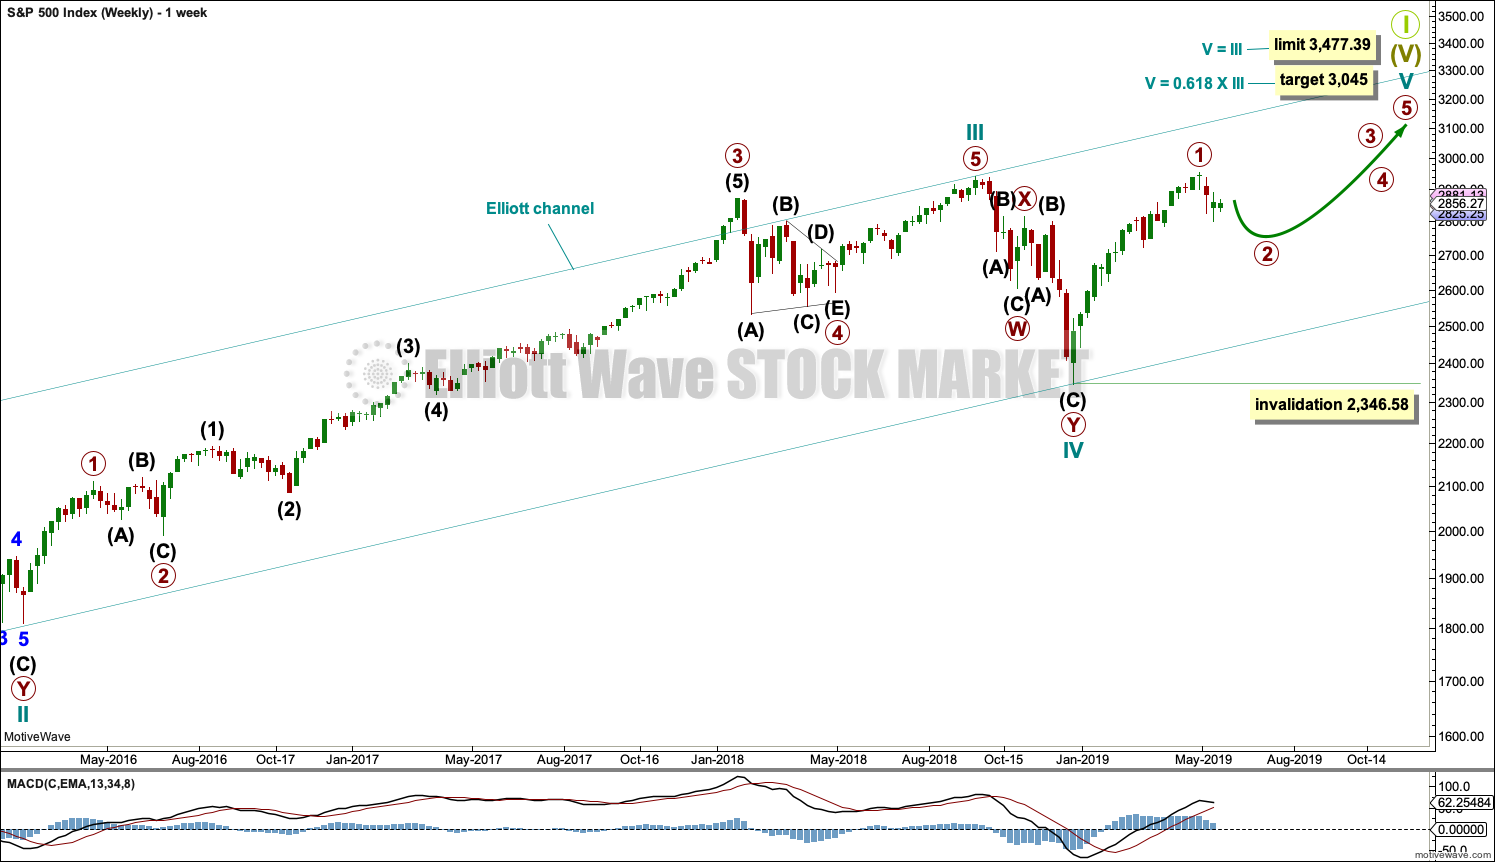
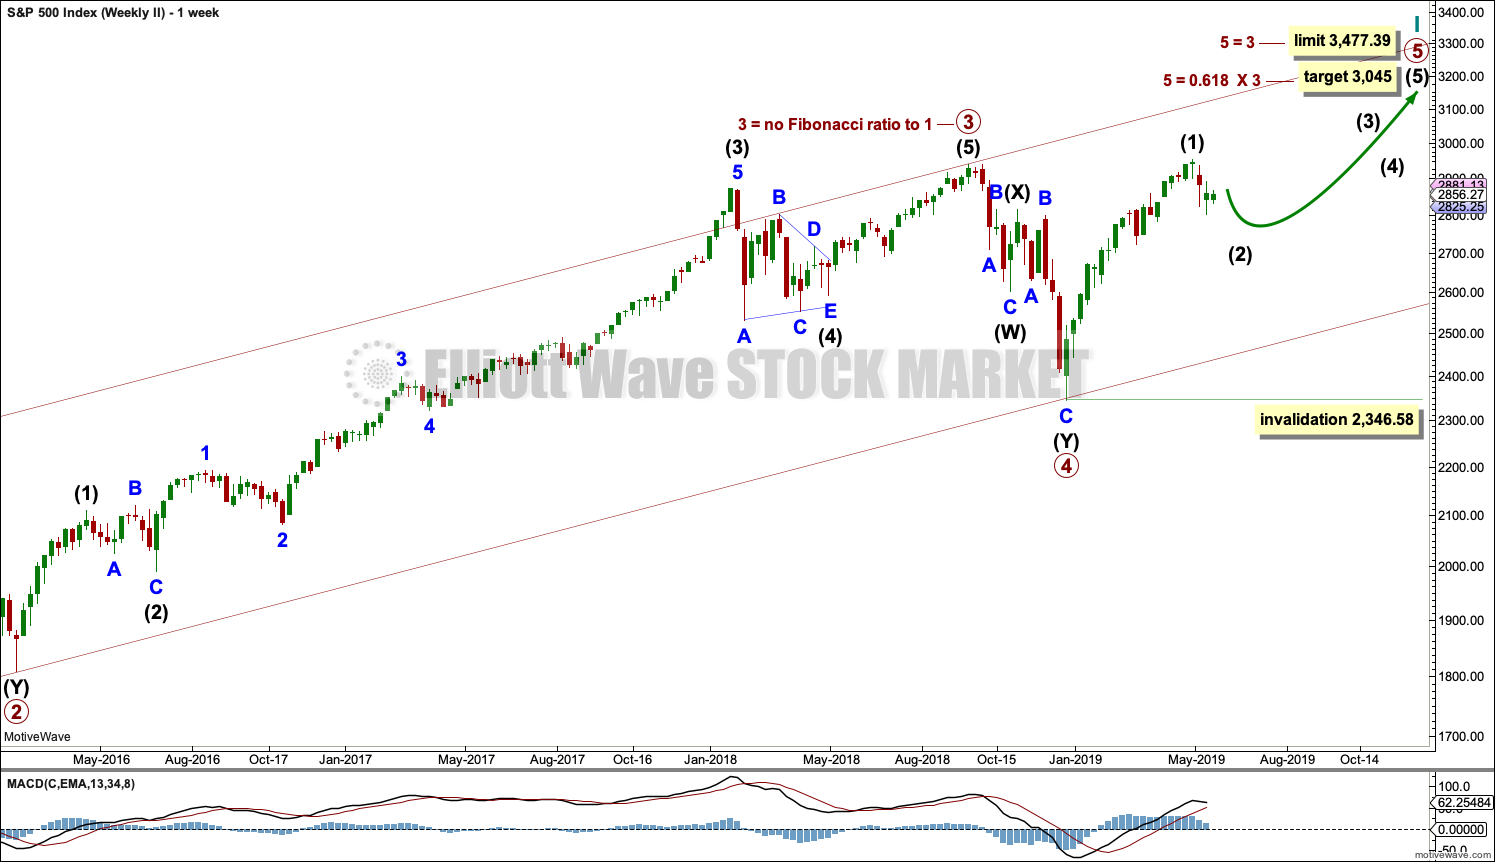
The basic Elliott wave structure consists of a five wave structure up followed by a three wave structure down (for a bull market). This wave count sees the bull market beginning in March 2009 as an incomplete five wave impulse and now within the last fifth wave, which is labelled cycle wave V. This impulse is best viewed on monthly charts. The weekly chart focusses on the end of it.
Elliott wave is fractal. This fifth wave labelled cycle wave V may end a larger fifth wave labelled Super Cycle wave (V), which may end a larger first wave labelled Grand Super Cycle wave I.
The teal Elliott channel is drawn using Elliott’s first technique about the impulse of Super Cycle wave (V). Draw the first trend line from the end of cycle wave I (off to the left of the chart, the weekly candlestick beginning 30th November 2014) to the end of cycle wave III, then place a parallel copy on the end of cycle wave II. This channel perfectly shows where cycle wave IV ended at support. The strongest portion of cycle wave III, the end of primary wave 3, overshoots the upper edge of the channel. This is a typical look for a third wave and suggests the channel is drawn correctly and the way the impulse is counted is correct.
Within Super Cycle wave (V), cycle wave III is shorter than cycle wave I. A core Elliott wave rule states that a third wave may never be the shortest. For this rule to be met in this instance, cycle wave V may not be longer in length than cycle wave III. This limit is at 3,477.39.
A final target is calculated at cycle degree for the impulse to end.
The structure of cycle wave V is focussed on at the daily chart level below.
Within cycle wave V, primary wave 2 may not move beyond the start of primary wave 1 below 2,346.58.
In historic analysis, two further monthly charts have been published that do not have a limit to upwards movement and are more bullish than this wave count. Members are encouraged to consider those possibilities (links below summary) alongside the wave counts presented on a daily and weekly basis.
DAILY CHART
Click chart to enlarge.
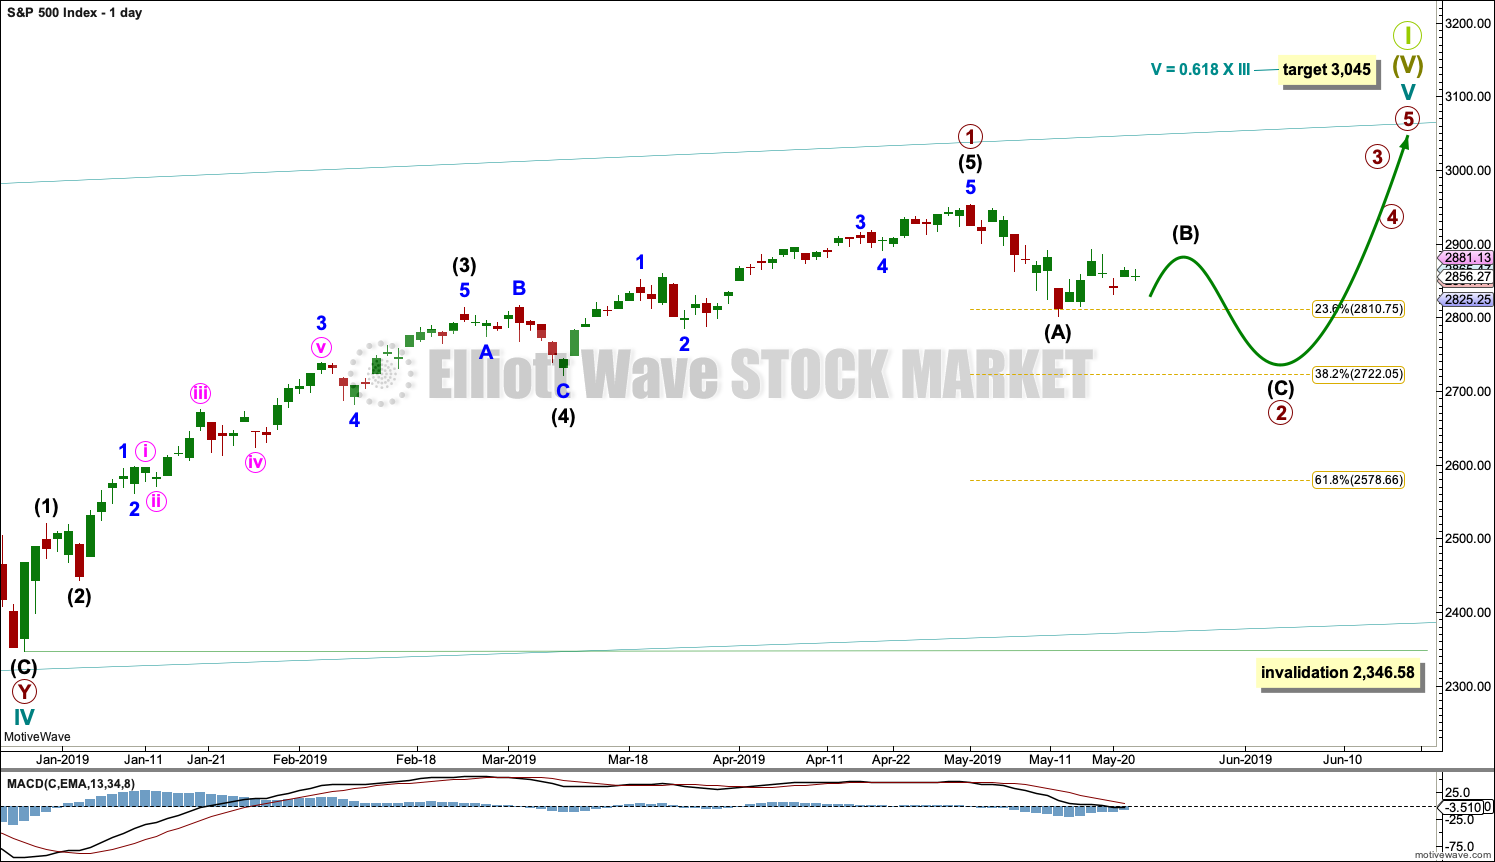
Cycle wave V must subdivide as a five wave motive structure. Within that five wave structure, primary wave 1 may be complete. Primary wave 2 may now continue sideways and / or lower as a zigzag, which may end within another couple of weeks or so. It is also possible that primary wave 2 was over at last week’s low although that scenario has reduced in probability.
Primary wave 3 must move above the end of primary wave 1.
When primary wave 3 is over, then primary wave 4 may be a shallow sideways consolidation that may not move into primary wave 1 price territory below 2,954.13.
Thereafter, primary wave 5 should move above the end of primary wave 3 to avoid a truncation.
Primary wave 2 may not move beyond the start of primary wave 1 below 2,346.58.
Four hourly charts are published.
FIRST HOURLY CHART
Click chart to enlarge.
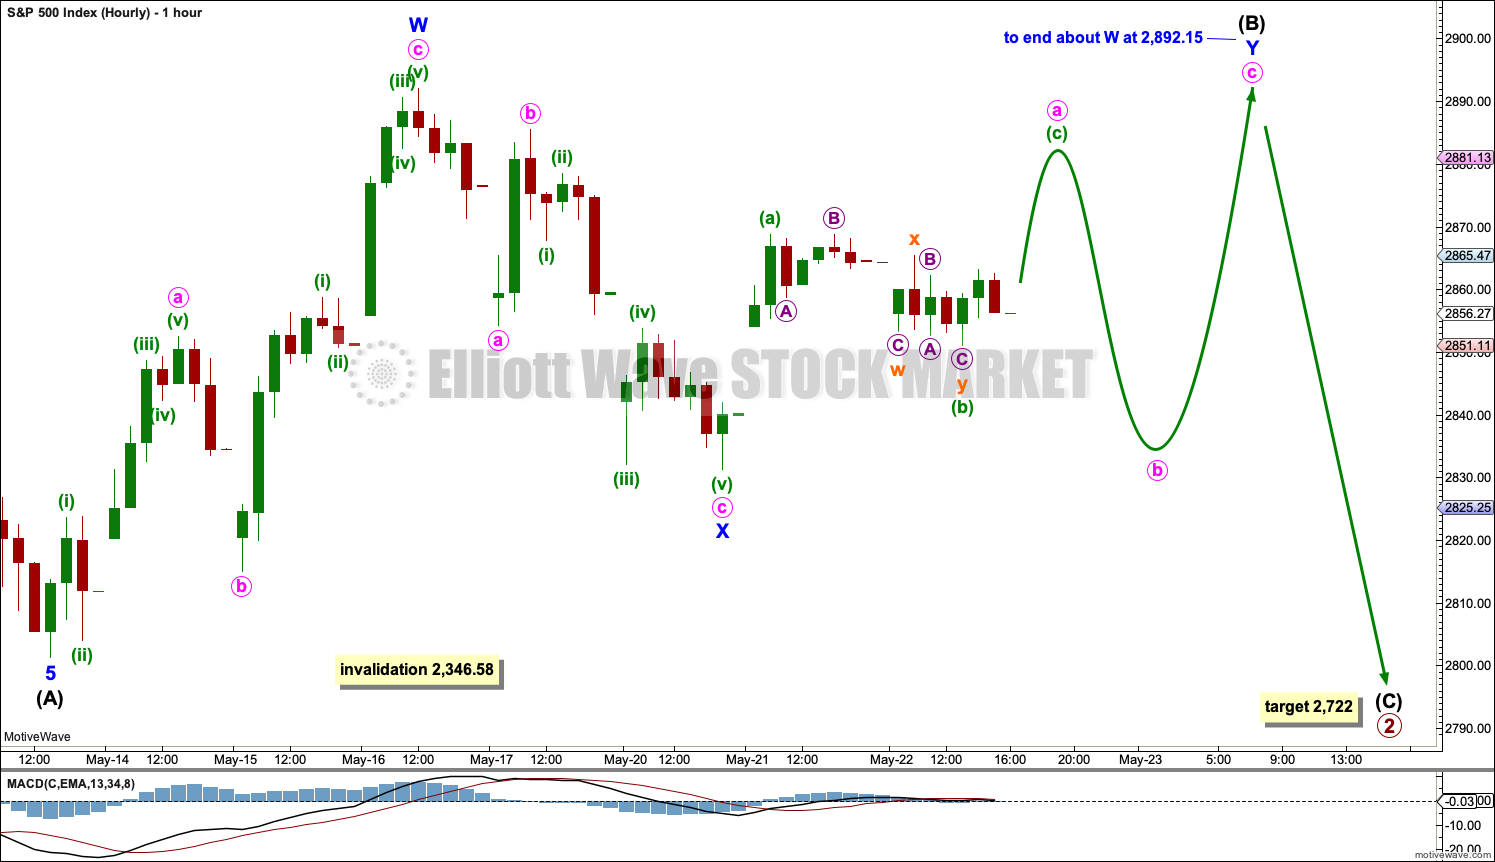
It remains possible that primary wave 2 is incomplete and may be a longer lasting and deeper zigzag. This would have better proportion on the daily and weekly chart.
Intermediate wave (A) subdivides well as a five wave impulse.
This wave count allows for sideways movement for another week to three before a final wave down to complete the pullback labelled primary wave 2.
Intermediate wave (B) may not move beyond the start of intermediate wave (A) above 2,954.01.
Downwards movement within intermediate wave (B) labelled minor wave X did not retrace a minimum 0.9 of minor wave W, so intermediate wave (B) at this stage cannot be labelled a flat correction because minor wave B within it would not have met the minimum required length of 0.9 of minor wave A.
This first hourly chart considers the possibility that intermediate wave (B) may be unfolding as a combination. Minor wave W may be a complete zigzag. Minor wave X may be complete, also subdividing as a zigzag. There is no minimum nor maximum requirement for X waves within combinations. The second structure of minor wave Y would most likely be a flat, but it may also be a triangle.
Within both possibilities of a flat or triangle for minor wave Y, minute wave a must subdivide as a three and would most likely subdivide as a zigzag. So far that structure would be incomplete.
SECOND HOURLY CHART
Click chart to enlarge.
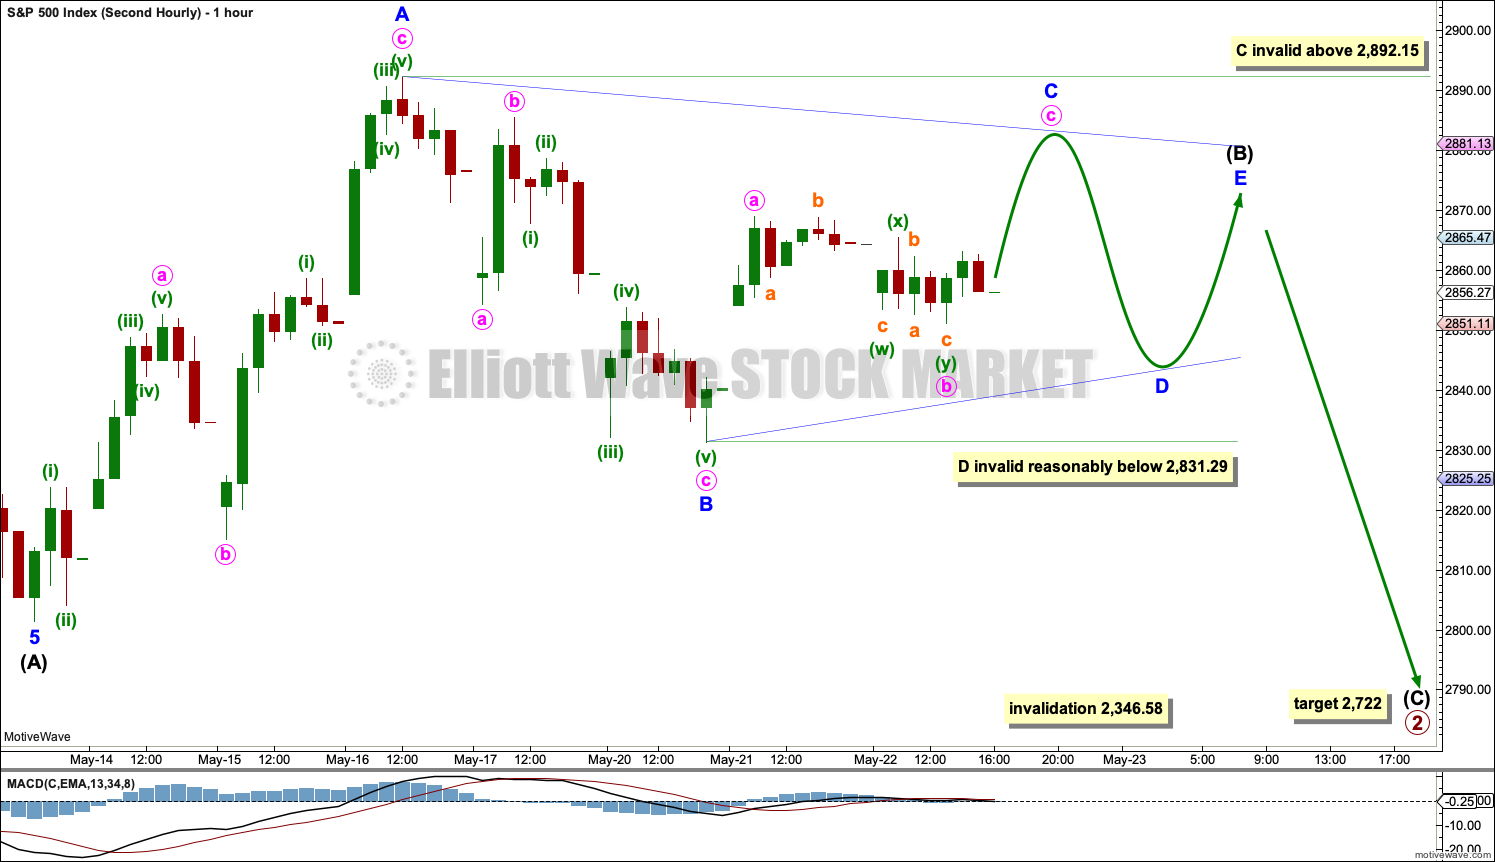
This second hourly chart is identical to the first up to the low labelled intermediate wave (A). Thereafter, it considers a different structure for intermediate wave (B).
Intermediate wave (B) may continue sideways as a regular contracting or regular barrier triangle.
Within a regular contracting triangle (the more common type), minor wave C may not move beyond the end of minor wave A above 2,892.15. Thereafter, minor wave D may not move beyond the end of minor wave B below 2,831.29. Finally, minor wave E may not move above the end of minor wave C.
Within a regular barrier triangle (less common), minor wave C may not move beyond the end of minor wave A above 2,892.15. Thereafter, minor wave D should end about the same level as minor wave B at 2,831.29. A barrier triangle would remain valid as long as the B-D trend line remains essentially flat. This rule is the only Elliott wave rule which involves any degree of subjectivity. Finally, minor wave E may not move above the end of minor wave C.
A triangle may see price move sideways for another one to maybe two or even three weeks.
Elliott wave triangles are tricky structures to label correctly as they unfold, so some flexibility is essential with them. It is possible that labelling of this triangle may need to change as price continues sideways. It is easy to label an Elliott wave triangle complete before it is so. Patience is required.
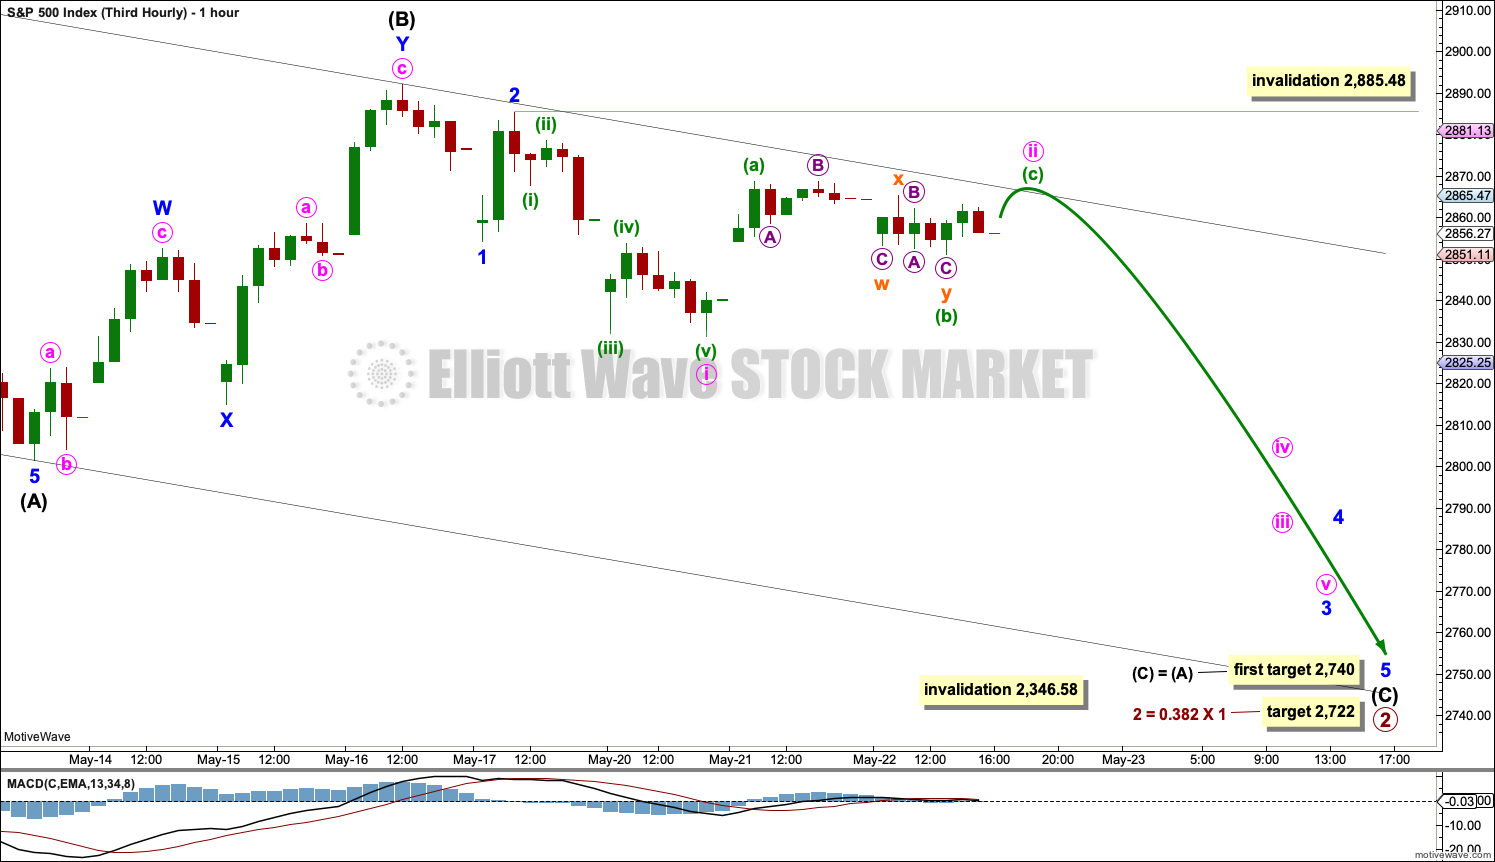
THIRD HOURLY CHART
Click chart to enlarge.
It is possible that primary wave 2 is an incomplete zigzag, and within it intermediate wave (B) is complete. This wave count expects downwards movement this week to complete intermediate wave (C) and in turn complete the zigzag of primary wave 2.
Within intermediate wave (C), minor waves 1 and 2 may now be complete. Within minor wave 3, minute wave i may be complete. Minute wave ii may now need to move higher to complete a zigzag. Within the zigzag, it would be most likely that minuette wave (c) would move above the end of minuette wave (a) to avoid a truncation. This would require minute wave ii to breach the upper edge of the black channel.
Minute wave ii is now longer in duration than minor wave 2 one degree higher. This does not invalidate the wave count, but the disproportion is now beginning to give it the wrong look. This wave count is reducing in probability.
If intermediate wave (B) is complete, then bounces within intermediate wave (C) should find resistance at the upper edge of the black Elliott channel.
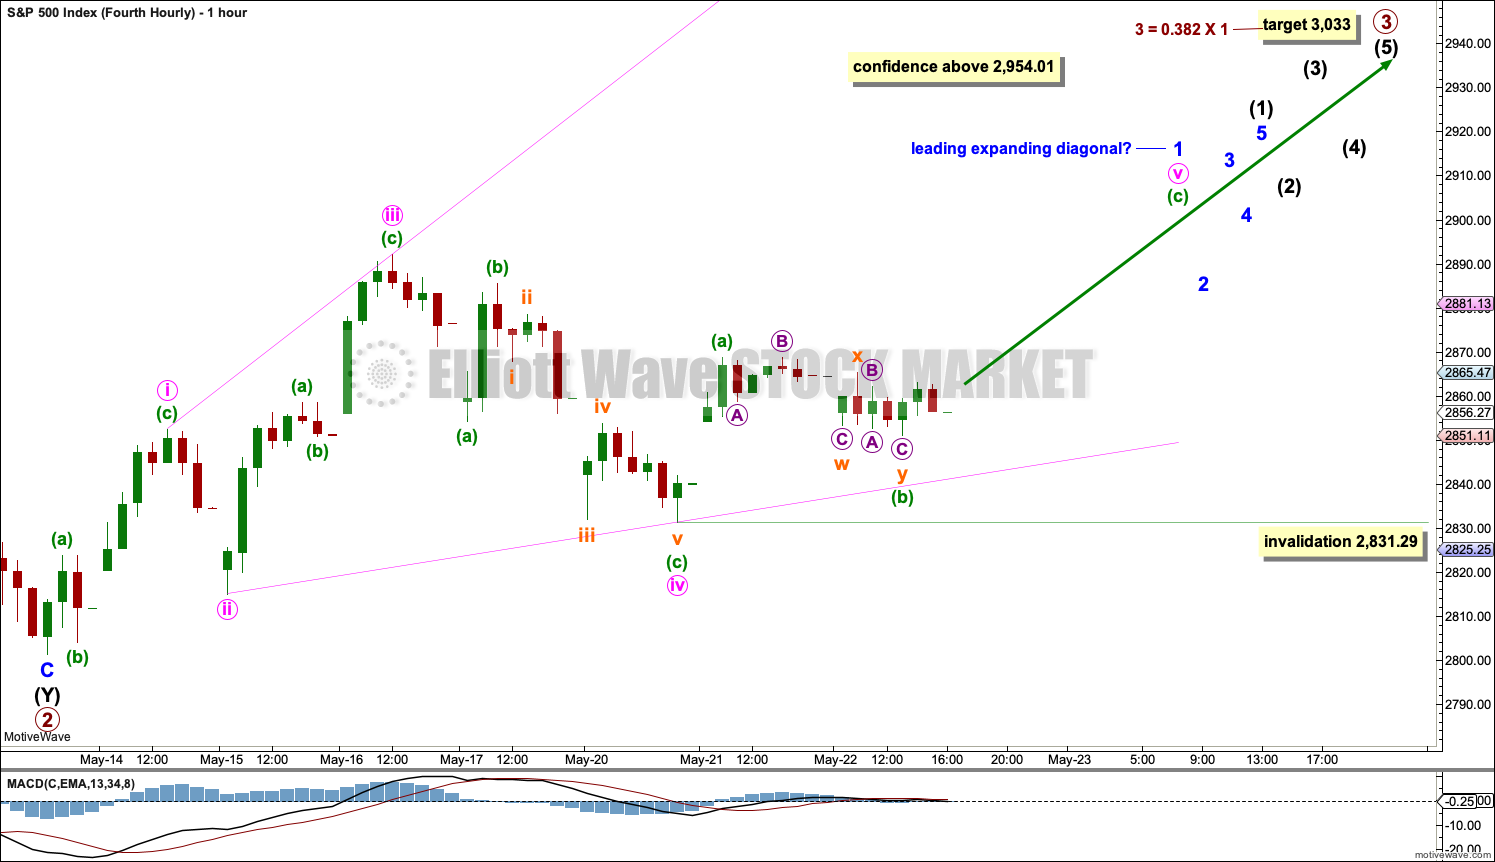
FOURTH HOURLY CHART
Click chart to enlarge.
This fourth hourly chart has some support from Lowry’s data and bullish divergence at the weekly chart level between price and both of the AD line and inverted VIX. However, so far this week upwards movement lacks any development of strong demand to establish a trend, suggesting the market is not yet ready to sustain a strong advance. Support for this wave count from Lowry’s data is declining.
It is possible that primary wave 2 is over as a double zigzag.
If primary wave 3 has begun, then within it intermediate wave (1) may be incomplete. Intermediate wave (1) must subdivide as a five wave motive structure. Within intermediate wave (1), minor wave 1 does not fit as an impulse. It may be unfolding as a diagonal.
There is too much overlapping to see minor wave 1 over at the last high, but this movement does fit as a series of two zigzags. This may be minute waves i, ii and iii of a leading expanding diagonal. However, leading diagonals are not very common structures. It is much more common to see an impulse in a first wave position. Leading expanding diagonals are less common. The probability of this wave count is judged to have a lower probability based upon the structure unfolding upwards and sideways here.
SECOND WAVE COUNT
WEEKLY CHART
Click chart to enlarge.
This weekly chart is identical to the first weekly chart, with the sole exception being the degree of labelling.
This weekly chart moves the degree of labelling for the impulse beginning in March 2009 all down one degree. This difference is best viewed on monthly charts.
The impulse is still viewed as nearing an end; a fifth wave is still seen as needing to complete higher. This wave count labels it primary wave 5.
TECHNICAL ANALYSIS
WEEKLY CHART
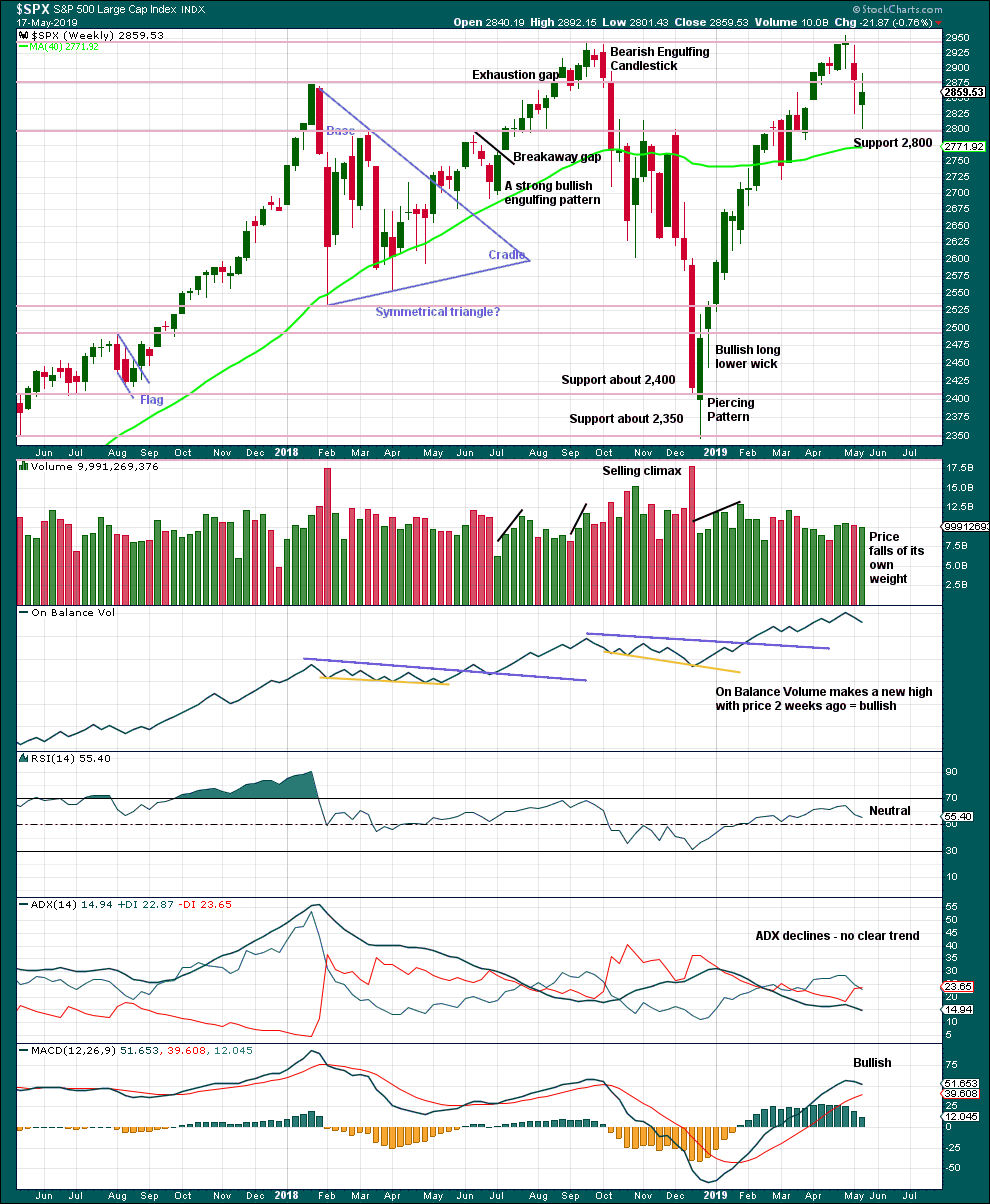
Click chart to enlarge. Chart courtesy of et=”_blank”>StockCharts.com.
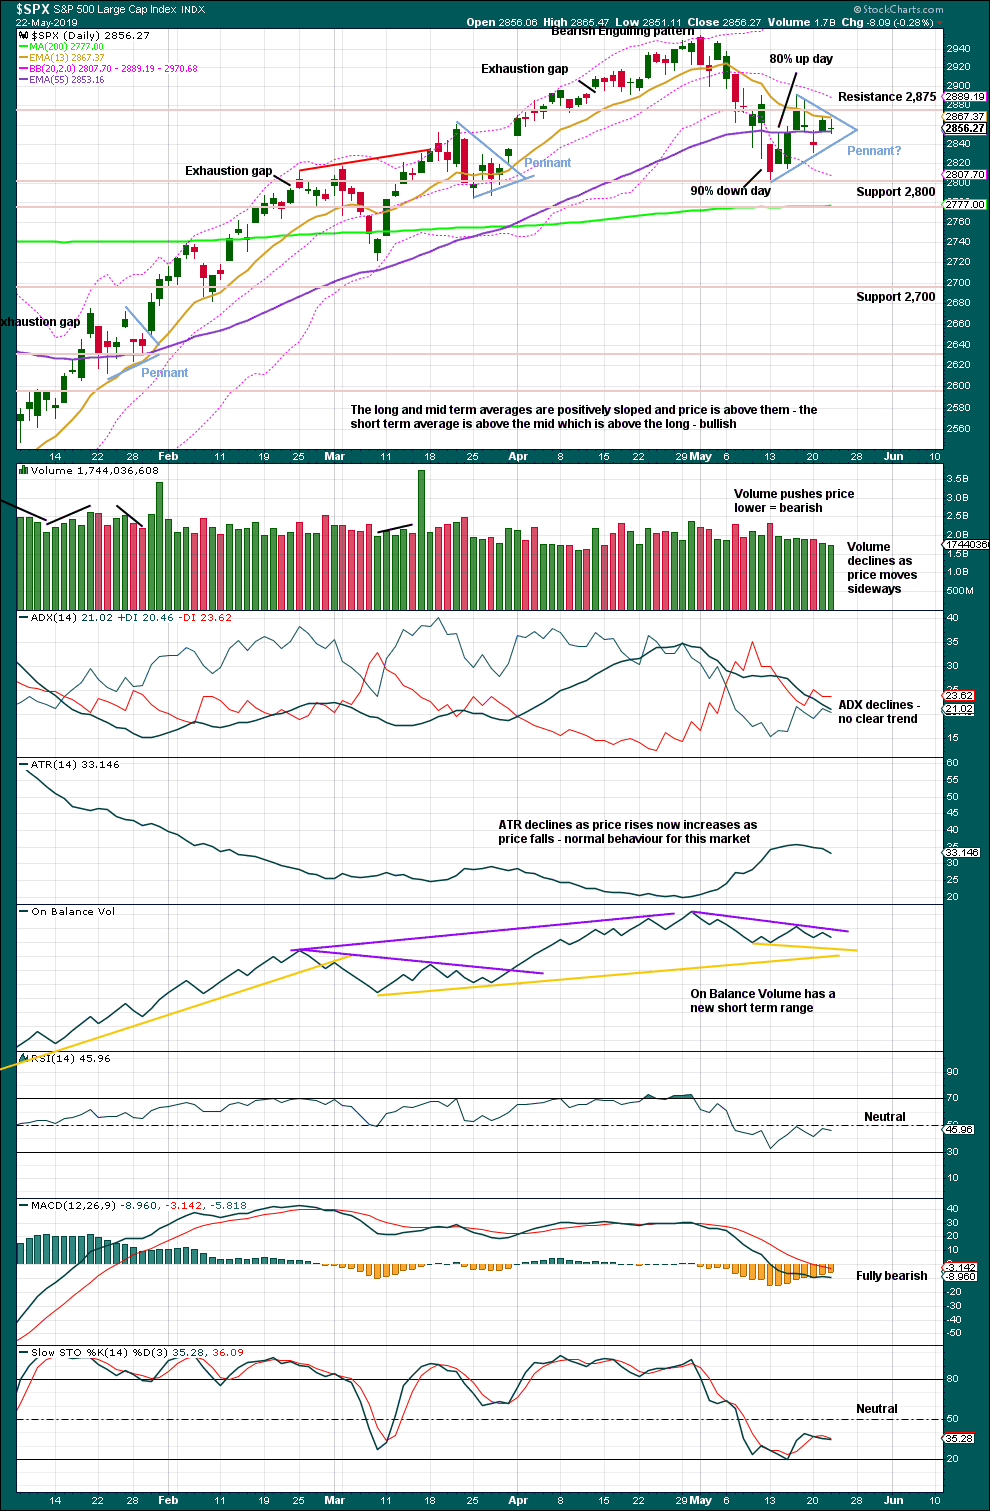
This week looks like a spinning top, although the real body may be too large for a typical spinning top. This puts the trend towards neutral. Support about 2,800 is strong and has so far held this week.
There is an upwards trend from the low in December 2018, a series of higher highs and higher lows with a new all time high on the 30th of April 2019. While the last swing low at 2,785.02 on the 25th of March remains intact, then this view should remain dominant.
The trend is your friend.
DAILY CHART
Click chart to enlarge. Chart courtesy of StockCharts.com.
A 90% downwards day at or immediately prior a low followed immediately afterwards by a 90% upwards day is a strong indication of a low in place. The indication is weaker in this case, but the movement is also weaker. The 80% upwards day of the 14th of May shows an almost 180 degree shift in sentiment after the 90% downwards day immediately prior. This is a pattern seen at minor lows. However, upwards movement following the low has not developed strong demand needed to produce a sustained rally. There is now less support for the view that a mid-term low is in place.
The dominant trend is up. Pullbacks in an upwards trend should be used as opportunities to join the trend.
It has been noted before that this market has been rising with light and declining volume at all time frames now for years. A lack of support from volume for upwards movement in the last few sessions is not of a concern in current market conditions.
Watch On Balance Volume carefully this week. A breakout would provide a weak signal that may add a little confidence to the next move from price.
A small pennant pattern may be forming. Pennants are reliable continuation patterns. The best performing pennants complete within 14 sessions, and so far this one has lasted 7. The target would be about 2,690.
BREADTH – AD LINE
WEEKLY CHART
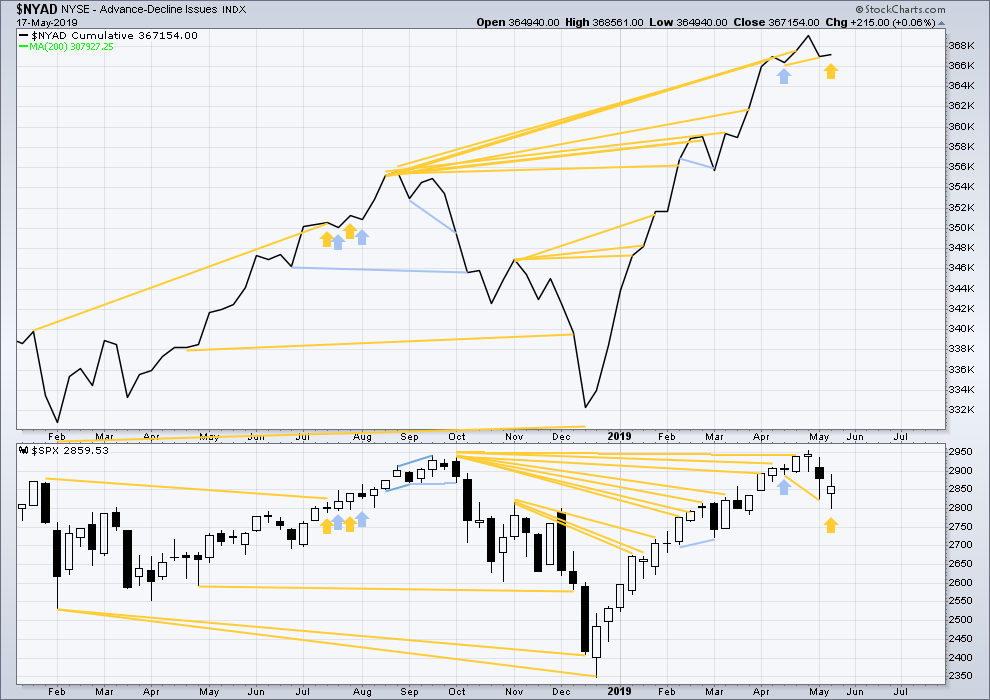
Click chart to enlarge. Chart courtesy of StockCharts.com. So that colour blind members are included, bearish signals
will be noted with blue and bullish signals with yellow.
Every single bear market from the Great Depression and onwards has been preceded by a minimum of 4 months divergence between price and the AD line. With the AD line making a new all time high on the 3rd of May, the end of this bull market and the start of a new bear market must be a minimum of 4 months away, which is the beginning of September 2019.
Last week price has moved lower with a lower low and a lower high, although the candlestick has closed green. The AD line has moved higher. This divergence is bullish and supports the view that a low may now be in place.
Last week all of large, mid and small caps have moved lower. None have made new swing lows below the low of the 25th of March. There is no divergence.
DAILY CHART
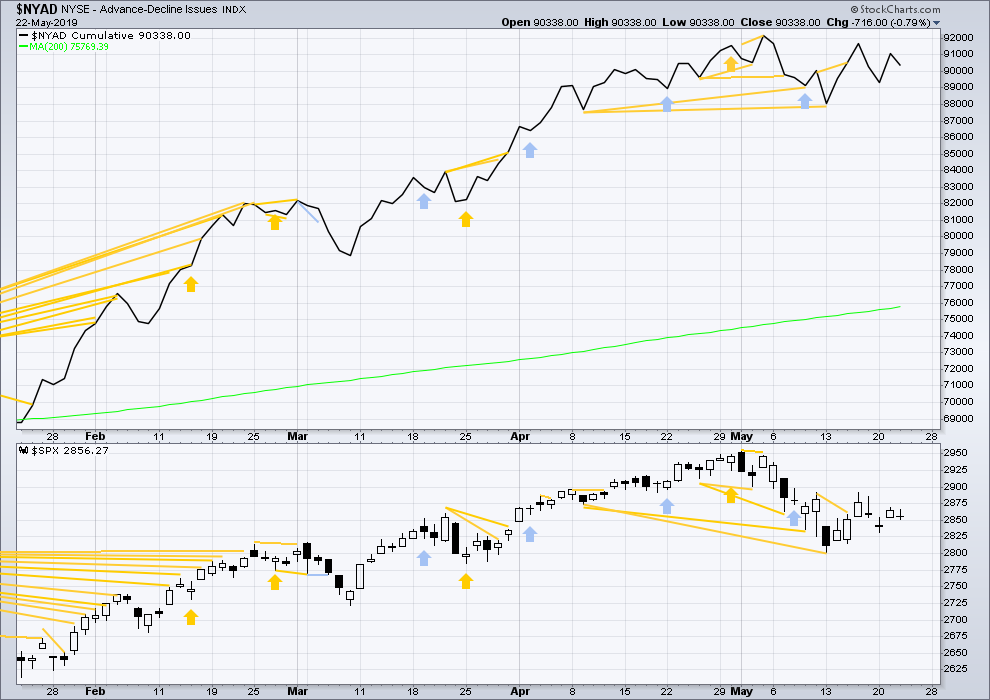
Click chart to enlarge. Chart courtesy of StockCharts.com. So that colour blind members are included, bearish signals
will be noted with blue and bullish signals with yellow.
Breadth should be read as a leading indicator.
Mid-term bullish divergence remains and supports the view here that a low may be in place.
Today both price and the AD line moved lower. There is no new short-term divergence.
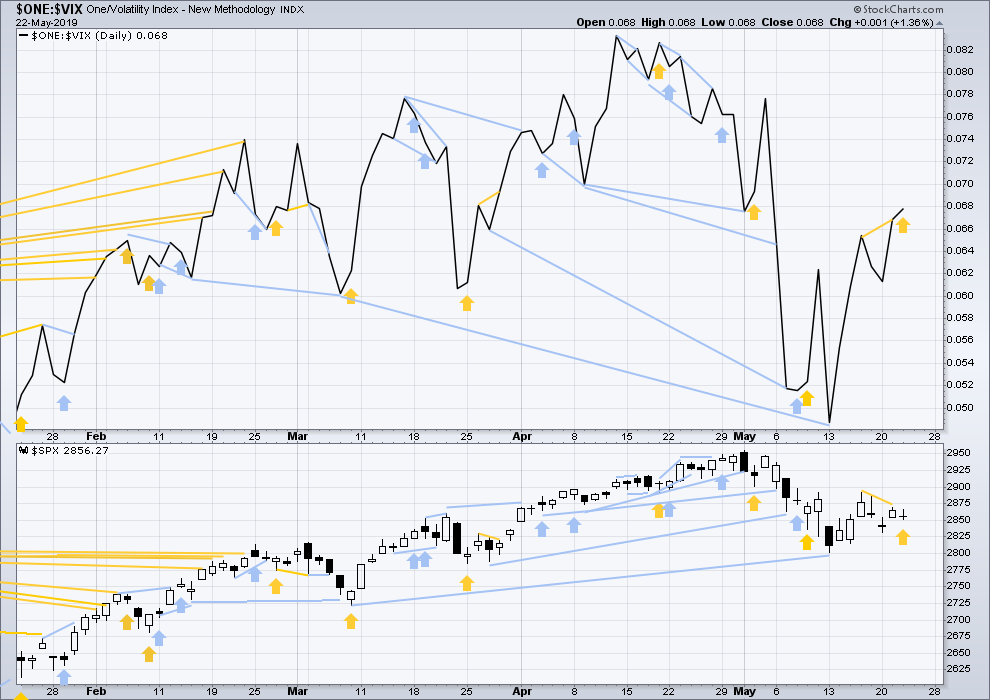
VOLATILITY – INVERTED VIX CHART
WEEKLY CHART
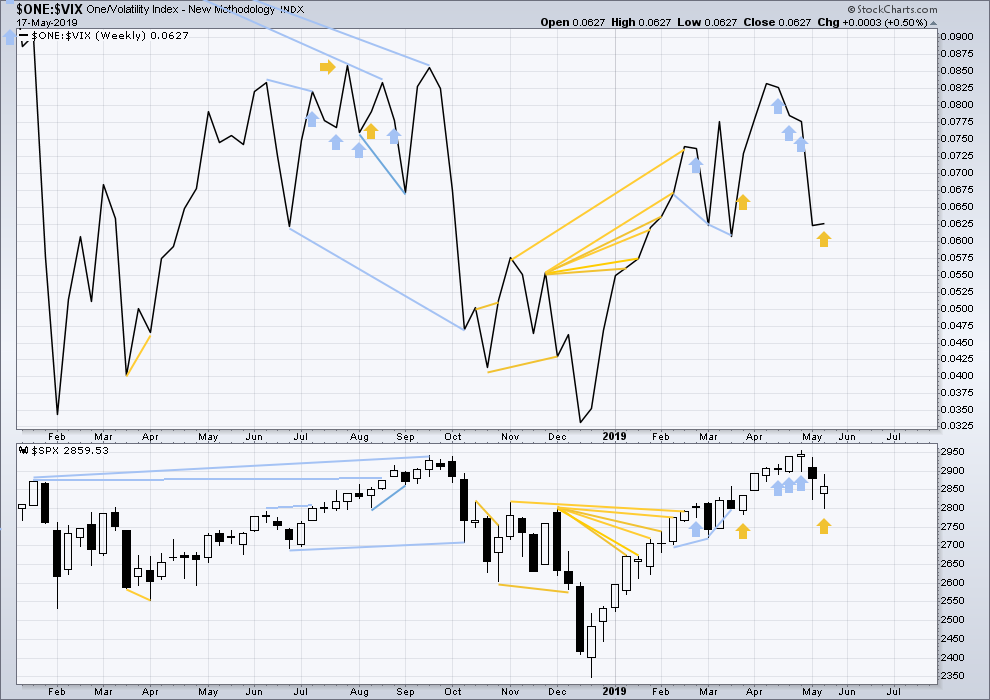
Click chart to enlarge. Chart courtesy of StockCharts.com. So that colour blind members are included, bearish signals
will be noted with blue and bullish signals with yellow.
Three weeks in a row of weekly bearish divergence has now been followed by two reasonable downwards weeks. It may be resolved here, or it may yet be an indication of further downwards movement in price.
Last week price moved lower, but the candlestick has closed green. Inverted VIX has moved higher. This divergence is bullish.
DAILY CHART
Click chart to enlarge. Chart courtesy of StockCharts.com. So that colour blind members are included, bearish signals
will be noted with blue and bullish signals with yellow.
Today price moved lower although the candlestick closed green. Inverted VIX has moved higher. This divergence is bullish for the short term, but it is weak. It will not be given weight in this analysis.
DOW THEORY
Dow Theory confirmed a bear market in December 2018. This does not necessarily mean a bear market at Grand Super Cycle degree though; Dow Theory makes no comment on Elliott wave counts. On the 25th of August 2015 Dow Theory also confirmed a bear market. The Elliott wave count sees that as part of cycle wave II. After Dow Theory confirmation of a bear market in August 2015, price went on to make new all time highs and the bull market continued.
DJIA: 23,344.52 – a close on the 19th of December at 23,284.97 confirms a bear market.
DJT: 9,806.79 – price has closed below this point on the 13th of December.
S&P500: 2,532.69 – a close on the 19th of December at 2,506.96 provides support to a bear market conclusion.
Nasdaq: 6,630.67 – a close on the 19th of December at 6,618.86 provides support to a bear market conclusion.
With all the indices moving now higher, Dow Theory would confirm a bull market if the following highs are made:
DJIA: 26,951.81
DJT: 11,623.58
S&P500: 2,940.91 – a new all time high has been made on the 29th of April 2019.
Nasdaq: 8,133.30 – a new high has been made on 24th of April 2019.
Published @ 07:18 p.m. EST.
—
Careful risk management protects your trading account(s).
Follow my two Golden Rules:
1. Always trade with stops.
2. Risk only 1-5% of equity on any one trade.
—
New updates to this analysis are in bold.
Peter:
I’ve deleted your comment with the Lowry’s image, because that image is most likely is under copy write.
I have however noted it, and I have the image, and I’ll be emailing Lowry’s for clarification because that’s a VERY important point you’ve made.
So thank you.
NP
That’s a VERY interesting chart Peter. Thank you for posting it. *edit: this is from Lowry’s I see. I’d still like to see the price data with AD line for myself to check this.
I’ve simply taken Lowry’s assertion at face value. I can’t go back far enough to see the AD line back in the 1930’s because StockCharts data doesn’t go back that far, so I’ve not been able to confirm it. StockCharts goes back only to 1990. And it’s StockCharts that has the AD line.
That’s really really interesting that there are two bear markets with zero divergence prior between price and the AD line: 1946 and 1976. Very interesting indeed.
HD looks awfully bullish to me. Double bottom on the daily right on a 78.6%. I’ve take a bull debit spread for June.
New hourly chart, this will be the main today.
The requirement for a flat is now met, and so this possibility is back on the table.
The strong bullish engulfing candlestick at todays low here on the hourly chart suggests a low is in at least for the short term. This would be a regular flat because B is >0.9 X A, and 1.05 X A.
Second hourly chart updated:
A triangle is still possible
Third hourly chart updated:
MACD fits so far with minor wave 3, if the middle of minute iii has passed.
Minuette (iv) may not move into minuette (i) price territory.
I cannot resurrect the fourth hourly chart. It will be discarded today.
We’re now down to three.
Yep! 🙂
Okay, I am 100% done looking at “those other guy’s” EW counts. DONE!!! No more!
They’ve been bearish bonds for the last 2 months. Redoing their counts over and over as bonds moved UP, not down. And now, at the end of the rope…bonds blast off even higher as they call for bonds to again “continue the bear trend”.
And nowhere/never have they ever provided a lower probability alternate that shows what is in fact happening.
How they change their count tomorrow on bonds I don’t know, and I don’t care anymore. I’m done being misled/confused by their silly counts.
And let’s not even get started on their “expanding triangle” big picture count on SPX…and I’ve already commented on them wanting $7000 for a course covering the material in a free online book…
DONE!!! Onward and upward, without the confusion they create.
It took me years as well to come to the same decision. They have not received any of my money in years and years.
I only spent a minimal “introductory” amount, fortunately. So my education has been pretty cheap, overall. It’s just shocking that “the big name” puts out such schlocky product. I guess they are full bore corporate and all about marketing and the illusion of value that justifies crazy prices. I read the warnings here in the past…but as usual, we have to experience these things for ourselves, most times.
It is not possible that even the most obtuse could be so consistently wrong.
They are, imho, mis-information/dis-information agents.
Always do the exact OPPOSITE of whatever they predict. I am serious…!
Hi Kevin,
I have not commented here as I have little time. My husband was gravely ill for years and just past.
To the point. I agree w/Verne. I attended Dick Diamond’s class when he was well [2009]. Dick was an excellent trader and a very patient, humble man. Dick offered his class thru EWI, because he taught Prechter how to day trade. I’m guessing Prechter offered him the EWI notoriety and later a platform for an online course which he taught twice before he passed.
Just before I attended Dick’s 4 day class in Orlando, Dick made an ‘under the table’ deal w/me so the class would cost me a bit less. I do not think he was happy w/the mark up Prechter placed on his classes. I believe he ‘ate’ the difference.
There is a lot more to his course than the book. The book was written when Dick was becoming seriously ill. It’s OK, but does not hit on many points. I think he was mainly trying to get across a visual on the charts for people who had taken the course so they could review what correct conditions/set-up should look like before taking a trade based on his system. He mainly traded eminis on the the S&P besides purchasing OTM call options during very low points on the S&P or DJI, using McClellan Osc., etc. He used the Metastock platform. Dick felt it was the most intuitive for his system. I believe that if you spk. w/Metastock- telling them that you have interest in their product and the D. Diamond system, that they would possibly send you to a technician who is familiar w/Dick’s method perhaps allowing you to ask a few questions about the success of his system. Of course, we all know a lot of this is dependent upon the trader. Dick made it very clear during his course that only some 10-15% if lucky will be successful w/his system as w/most.
Anyway….for what its worth, I do believe that Dick was a very good trader AND very honorable. I also agree with you that EWI has huge overhead so everything = OVER priced, and many of their analysts are Not worth their salt. If memory serves me, I paid less than $3500 a 4 day course at the time.
Have a great weekend….
Thank you for your comment, Melanie. And I’m so sorry for your loss. I lost my first wife, the mother if my children, many years ago. I can well imagine how it is for you now.
About DD, I appreciate what I learned from his book. EWI… not so much.
My condolences as well, Melanie. I trust you will find comfort in faith and family in your time of loss.
To Curtis and Kevin,
Thank you Curtis and to this day I am sure it is sometimes still ‘raw’.
About Dick, he changed his time frame shortly before his first online course to 8min. and 30min. He would tell us in class to use a 2.50 tick stop and move up asap to b/e or Get Out if trade not working within a a few minutes. If volatility high use only a few contracts max. and give stop more room.
In the course we received a copy of a live spread sheet w/EOD data we would plug in from WSJ website. It would come back hi-liting the day in green, yellow or red. When Dick saw a succession of Red days and the McClellan Osc and Summation Index read oversold[nos. displayed on spread sheet EOD], he would begin to purchase standard OTM options on SPX Indes. More red, he purchased more. Then the market suddenly turn up, the options would explode and he would close the trade ‘in the heat’. So these were options on the SPX index, not options on SPX futures. Unfortunately, the spread sheet which was very handy was no longer kept up towards his end. I believe it can still be ‘cobbled’ together via WSJ and McClellan’s site.
Dick was conservative. IE: He did not believe in selling naked puts as an example. Saw traders next to him on trade desk in NYC in his early days, ruined by it.
BTW, Tom McClellan has a good correlation article out today on IBD/SPX. Agrees w/Lara’s short term upside call.
See it at his website.
Thanks for sharing that Melanie!
As it turns out, I just used the core “method” (well, one of the 3, though they have lots of overlap) to take HD long for a nice very short ride. Making money on his system requires lots of capital, as you end up typically making 0.2-0.5% (raw stock price movement). I made 0.3% in about 10 minutes. I don’t think you could trade it at the 2 minute level with options profitably as the options spread + commissions would eat you alive on such small price moves.
I will keep working with it, to see if I can indeed get 80% winners consistently.
I am very sorry indeed to hear of your loss Melanie, and I send you a nice big virtual hug.
Can I get one too?! 🙂
Thank you to Lara and Verne. As we all know ‘time will slowly heal’.
I am thankful to have 2 Siberian Forest Cats that I care for and hug everyday! One of them, Boris was 24lbs. and loved my husband. He lost 4lbs. w/my husband’s passing. I’m sure many of you will agree. Animals have emotions much like we do. Boris is adjusting nicely little by little.
Thanks again.
Hi Melanie , I worked for Bob Prechter in the early 90 ‘s . I was an institutional salesman for EWI . I covered Europe . Before the internet , there was Bloomberg , Telerate , Reuters . We sold EWI charts , and info over those services to institutions , banks , and very few individuals . Most of the subscribers to the service were priority traders at banks all over the world , and most were currency traders . The daily institutional services were very expensive , but those banks paid the big bucks . That is about the time EWI started the courses . With big bank and corporate money behind the students, and traders , EWI could get the big bucks for the services , and classes . People from all over the world would fly in , and come to Gainesville GA to learn Elliott counts . It always amazed me . I think EWI can command the premium for its classes because that’s what people will pay . I will say Bob did a remarkable job teaching the world the Elliot wave principle .
AND – I love Laura s work . Big Fan .
I went long RUT today
tight stop..
What’s ur stop Peter
149.5 IWM hourly close
Hmmm…kind of trying to catch the falling knife, isn’t it?
I want to see evidence of a bottom/turn first. Particularly since the most likely EW count on the SPX says this 4 down isn’t over yet.
SPY gap closed
Perfect bounce off the 0.78 ….. so far
According to the third hourly chart (which it would appear price is tracking now), this should be minute iii of minor 3 down action. Hmmm…shouldn’t we see some real momentum here? Not quite what I expect of iii of 3 action. Yet. It just looks like more backing/filling within the overall shadow of the initial A wave down…so far.
May be this is the X complete of intermediate B and now we zigzag up in Y upto 2907, I have hard time believing that we are gonna go below 2800 in May, so range bound for another few days then make a move lower in Jun
or B of the triangle …..
Yep. Maybe… or not. Sitting tight for the moment.
multiple overlapped fibos in the 2810-13 range, well see if that turns this (for a time, anyway).
Check it out!!!
Way to go Curtis. You put me to shame. But I have an excuse, I am fighting diverticulitis again. It is such a s***y experience.
Oh well, here we go at the open to start the next down stroke of this correction.
Oh no Rodney, that’s not good. I’m sorry to hear it.