Price is moving sideways, which fits the first expectation for this week.
Summary: The low of December 2018 is expected to remain intact, and this pullback is expected to be followed by a strong third wave up to new all time highs.
Three scenarios are possible for the short term:
1. Some sideways movement continues before a final wave down to about 2,722 completes the pullback in two or three weeks time.
2. A pullback ends this week about 2,740 or 2,722.
3. The pullback is over. Confidence in this view may be had with a new all time high above 2,954.13. The next target would be at 3,033 for another larger consolidation. This target may be met in about a month.
The biggest picture, Grand Super Cycle analysis, is here.
Monthly charts were last published here, with video here. There are two further alternate monthly charts here, with video here.
ELLIOTT WAVE COUNTS
The two Elliott wave counts below will be labelled First and Second rather than main and alternate as they may be about of even probability. When the fifth wave currently unfolding on weekly charts may be complete, then these two wave counts will diverge on the severity of the expected following bear market. To see an illustration of this future divergence monthly charts should be viewed.
FIRST WAVE COUNT
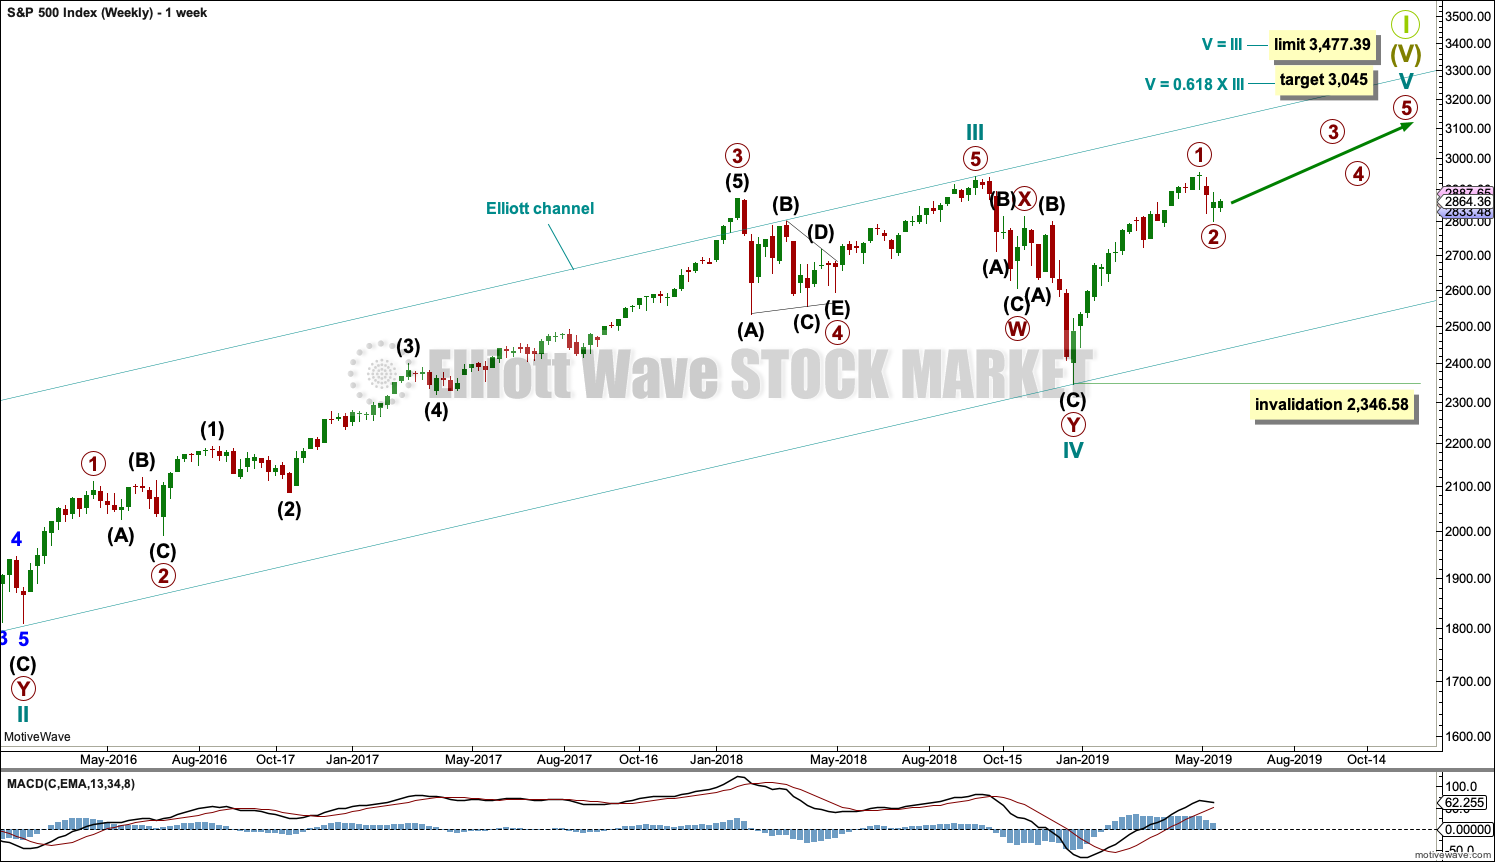
WEEKLY CHART
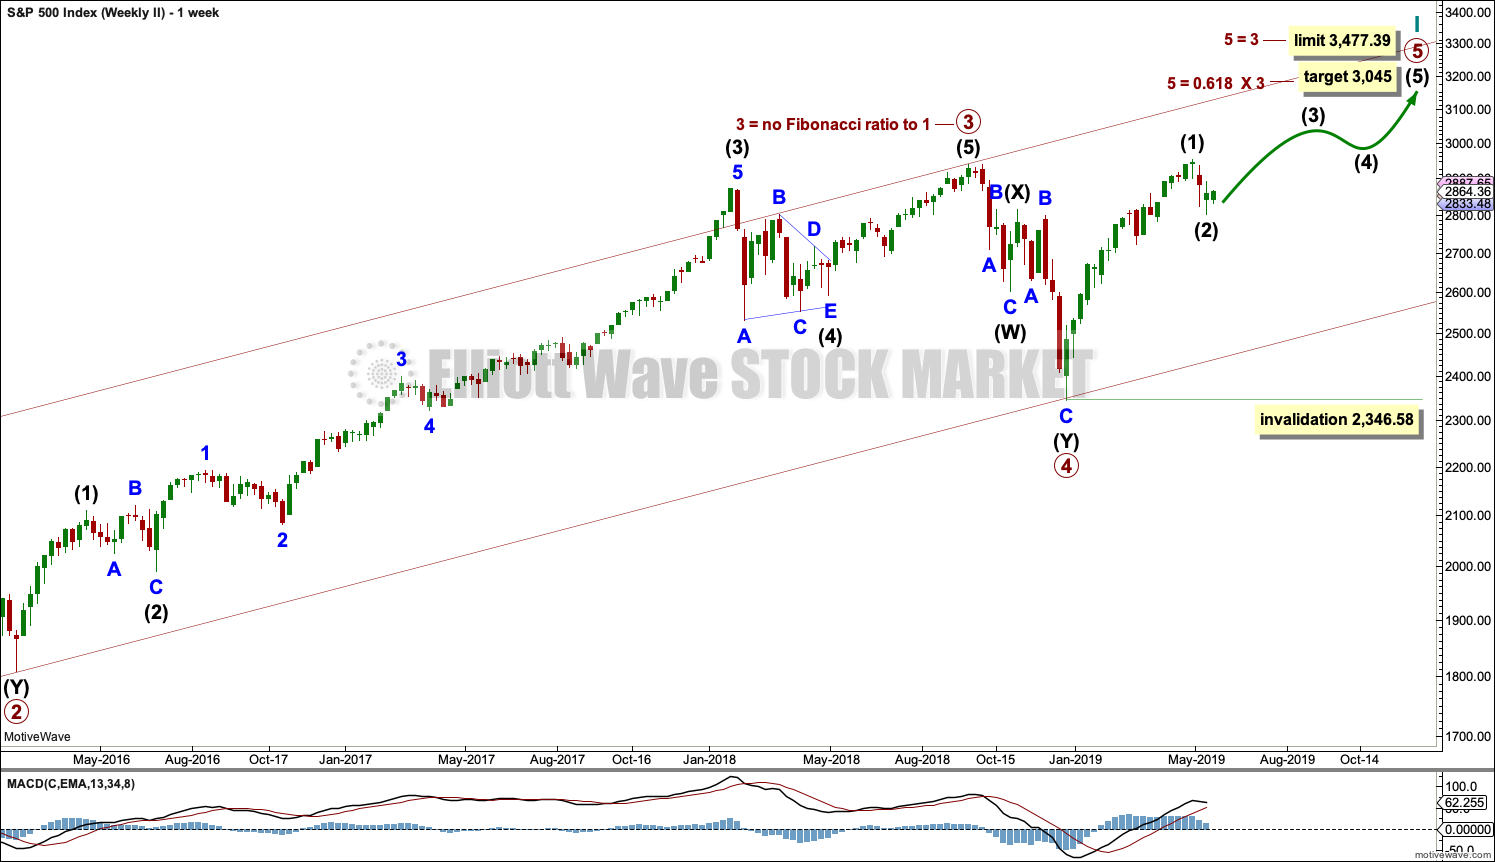
The basic Elliott wave structure consists of a five wave structure up followed by a three wave structure down (for a bull market). This wave count sees the bull market beginning in March 2009 as an incomplete five wave impulse and now within the last fifth wave, which is labelled cycle wave V. This impulse is best viewed on monthly charts. The weekly chart focusses on the end of it.
Elliott wave is fractal. This fifth wave labelled cycle wave V may end a larger fifth wave labelled Super Cycle wave (V), which may end a larger first wave labelled Grand Super Cycle wave I.
The teal Elliott channel is drawn using Elliott’s first technique about the impulse of Super Cycle wave (V). Draw the first trend line from the end of cycle wave I (off to the left of the chart, the weekly candlestick beginning 30th November 2014) to the end of cycle wave III, then place a parallel copy on the end of cycle wave II. This channel perfectly shows where cycle wave IV ended at support. The strongest portion of cycle wave III, the end of primary wave 3, overshoots the upper edge of the channel. This is a typical look for a third wave and suggests the channel is drawn correctly and the way the impulse is counted is correct.
Within Super Cycle wave (V), cycle wave III is shorter than cycle wave I. A core Elliott wave rule states that a third wave may never be the shortest. For this rule to be met in this instance, cycle wave V may not be longer in length than cycle wave III. This limit is at 3,477.39.
A final target is calculated at cycle degree for the impulse to end.
The structure of cycle wave V is focussed on at the daily chart level below.
Within cycle wave V, primary wave 2 may not move beyond the start of primary wave 1 below 2,346.58.
In historic analysis, two further monthly charts have been published that do not have a limit to upwards movement and are more bullish than this wave count. Members are encouraged to consider those possibilities (links below summary) alongside the wave counts presented on a daily and weekly basis.
DAILY CHART
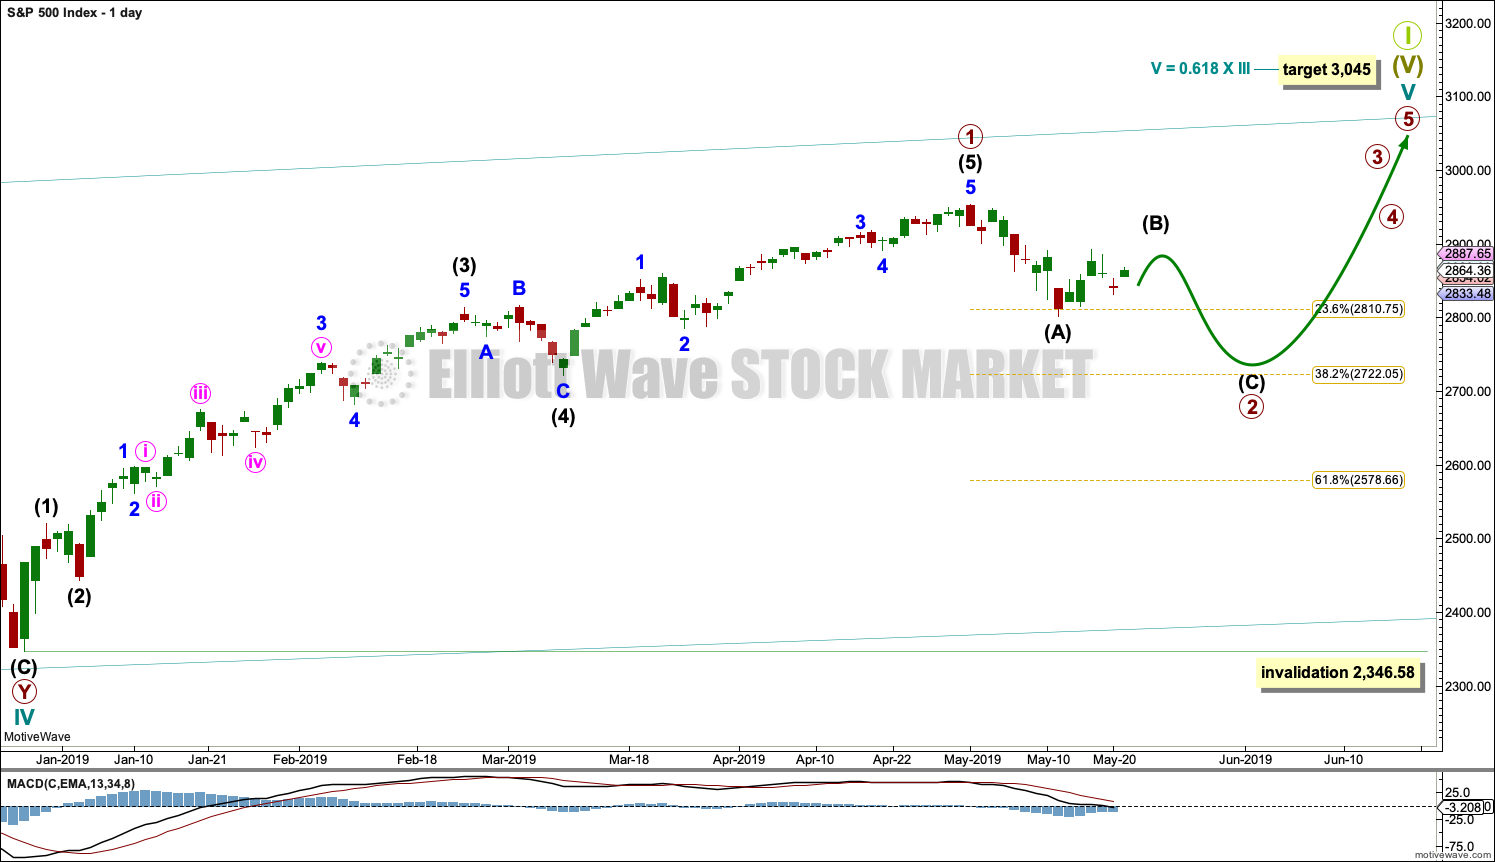
Cycle wave V must subdivide as a five wave motive structure. Within that five wave structure, primary wave 1 may be complete. Primary wave 2 may now continue sideways and / or lower as a zigzag, which may end within another couple of weeks or so. It is also possible that primary wave 2 was over at last week’s low although that scenario has reduced in probability.
Primary wave 3 must move above the end of primary wave 1.
When primary wave 3 is over, then primary wave 4 may be a shallow sideways consolidation that may not move into primary wave 1 price territory below 2,954.13.
Thereafter, primary wave 5 should move above the end of primary wave 3 to avoid a truncation.
Primary wave 2 may not move beyond the start of primary wave 1 below 2,346.58.
Four hourly charts are published.
FIRST HOURLY CHART
It remains possible that primary wave 2 is incomplete and may be a longer lasting and deeper zigzag. This would have better proportion on the daily and weekly chart.
Intermediate wave (A) subdivides well as a five wave impulse.
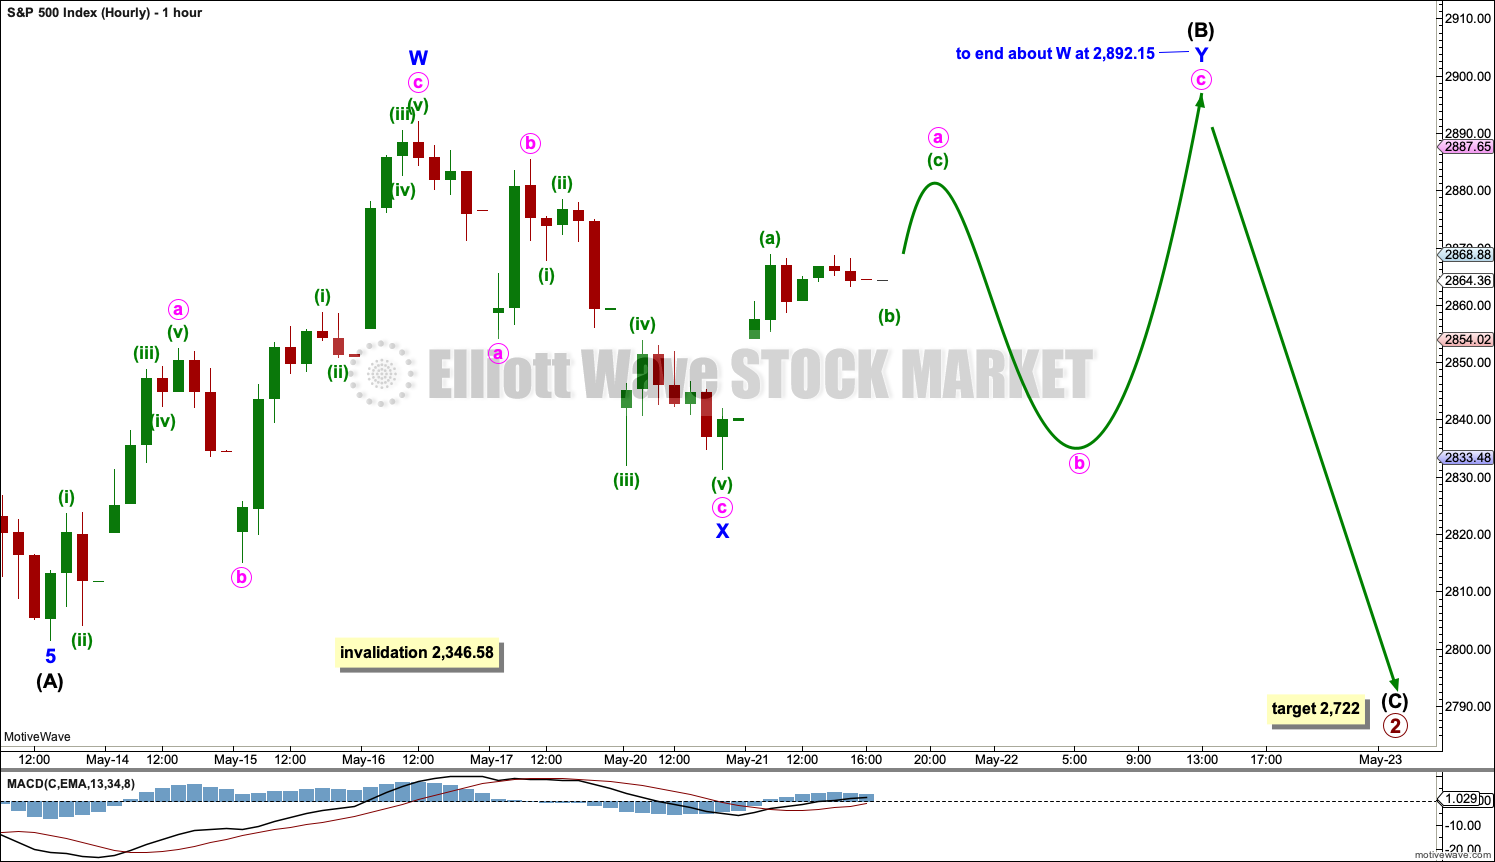
This wave count allows for sideways movement for another week to three before a final wave down to complete the pullback labelled primary wave 2.
Intermediate wave (B) may not move beyond the start of intermediate wave (A) above 2,954.01.
Downwards movement within intermediate wave (B) labelled minor wave X did not retrace a minimum 0.9 of minor wave W, so intermediate wave (B) at this stage cannot be labelled a flat correction because minor wave B within it would not have met the minimum required length of 0.9 of minor wave A.
This first hourly chart now considers the possibility that intermediate wave (B) may be unfolding as a combination. Minor wave W may be a complete zigzag. Minor wave X may be complete at yesterday’s low. There is no minimum nor maximum requirement for X waves within combinations. The second structure of minor wave Y would most likely be a flat, but it may also be a triangle.
SECOND HOURLY CHART
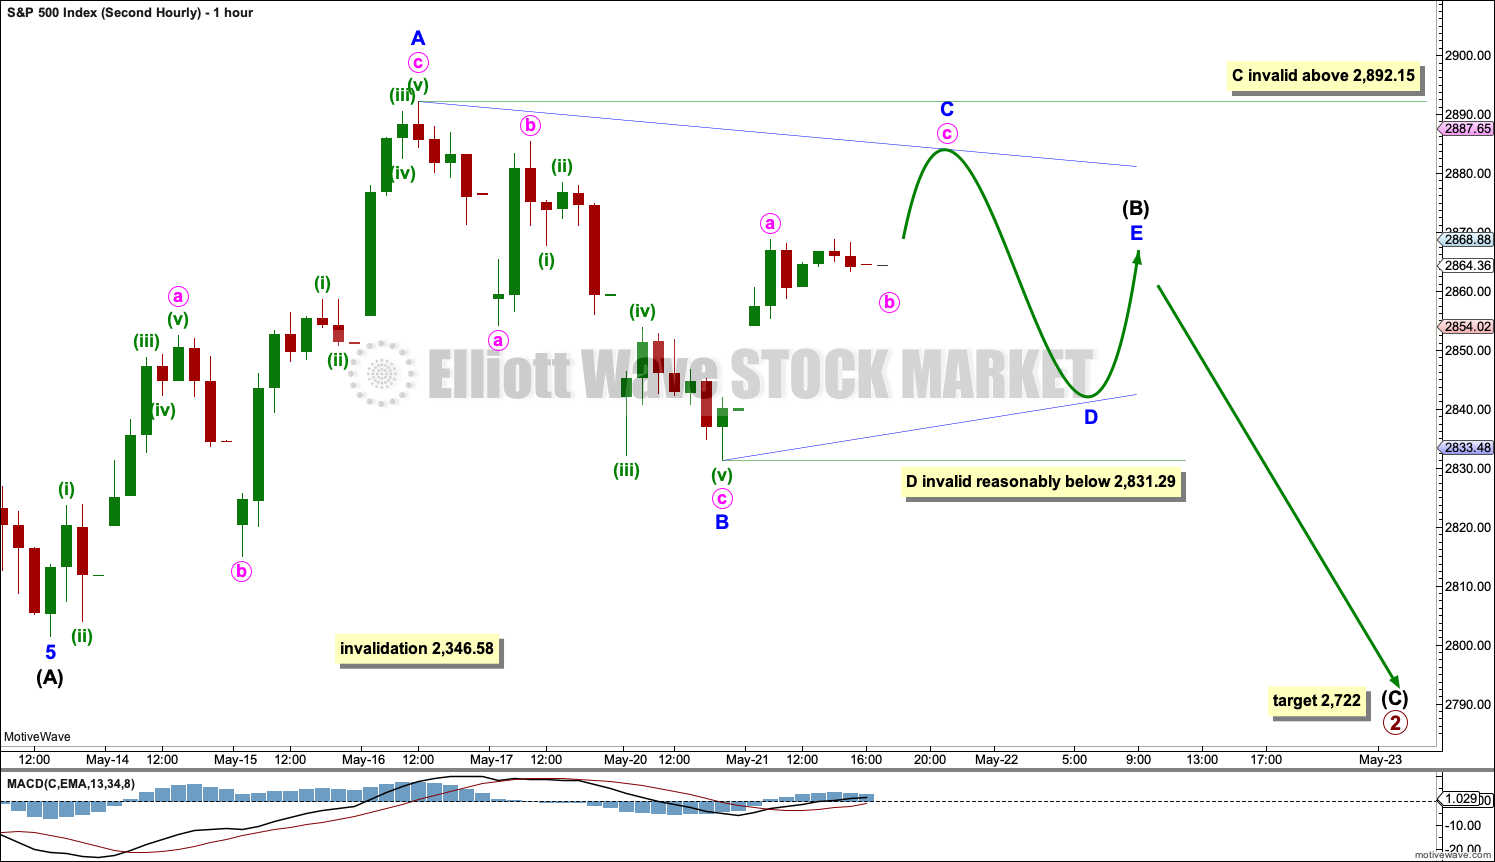
This second hourly chart is identical to the first up to the low labelled intermediate wave (A). Thereafter, it considers a different structure for intermediate wave (B).
Intermediate wave (B) may continue sideways as a regular contracting or regular barrier triangle.
Within a regular contracting triangle (the more common type), minor wave C may not move beyond the end of minor wave A above 2,892.15. Thereafter, minor wave D may not move beyond the end of minor wave B below 2,831.29. Finally, minor wave E may not move above the end of minor wave C.
Within a regular barrier triangle (less common), minor wave C may not move beyond the end of minor wave A above 2,892.15. Thereafter, minor wave D should end about the same level as minor wave B at 2,831.29. A barrier triangle would remain valid as long as the B-D trend line remains essentially flat. This rule is the only Elliott wave rule which involves any degree of subjectivity. Finally, minor wave E may not move above the end of minor wave C.
A triangle may see price move sideways for another one to one and a half weeks.
THIRD HOURLY CHART
This third hourly chart was the second in yesterday’s analysis.
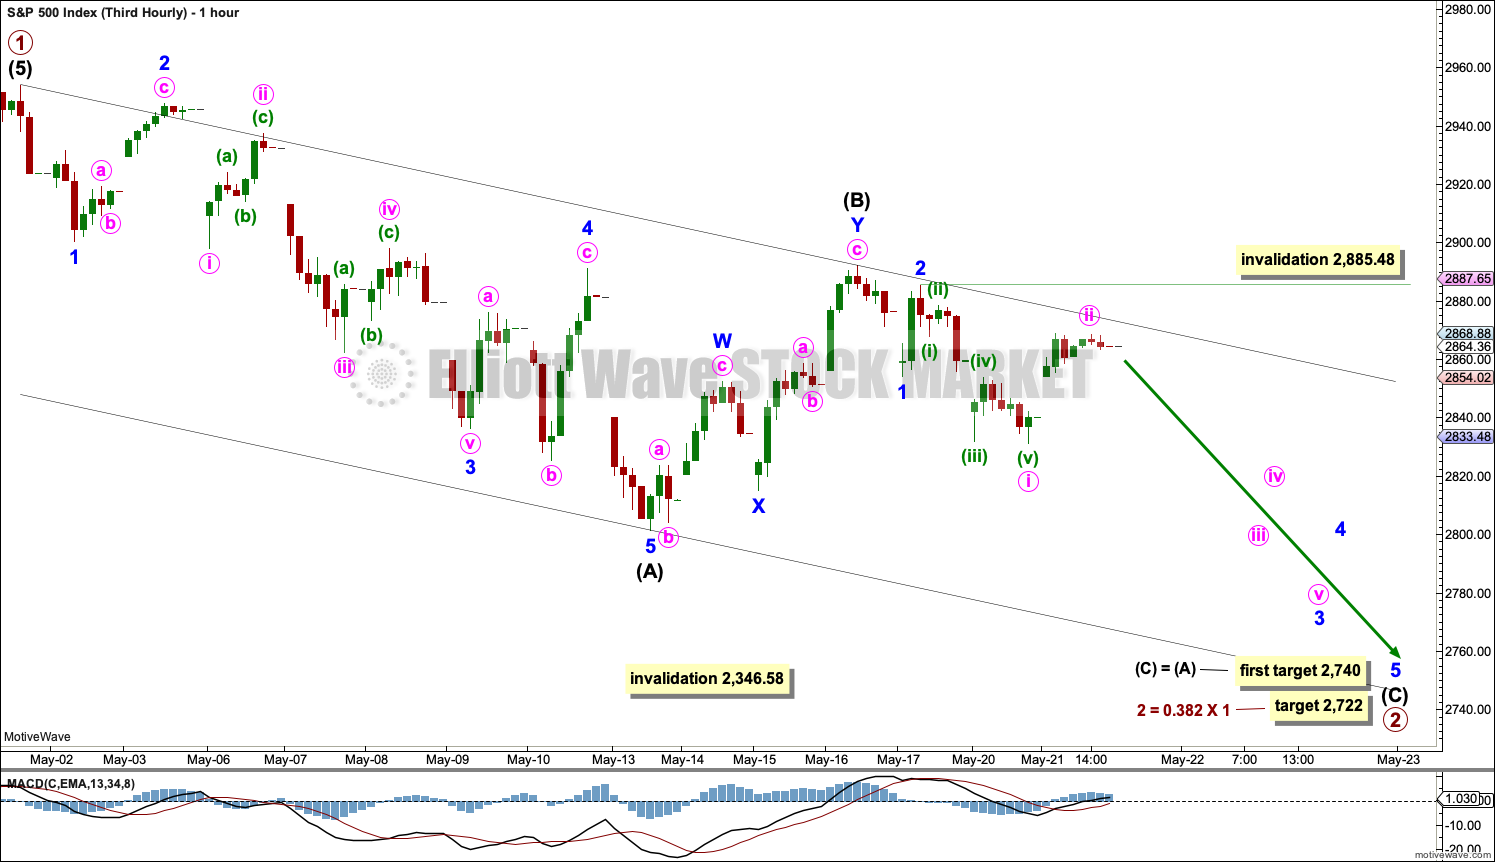
It is possible that primary wave 2 is an incomplete zigzag, and within it intermediate wave (B) is complete. This wave count expects downwards movement this week to complete intermediate wave (C) and in turn complete the zigzag of primary wave 2.
Within intermediate wave (C), minor waves 1 and 2 may now be complete. Within minor wave 3, minute waves i and ii may now be complete.
If intermediate wave (B) is complete, then bounces within intermediate wave (C) should find resistance at the upper edge of the black Elliott channel.
FOURTH HOURLY CHART
This fourth hourly chart was the third in yesterday’s analysis.
This fourth hourly chart has some support from Lowry’s data and bullish divergence at the weekly chart level between price and both of the AD line and inverted VIX.
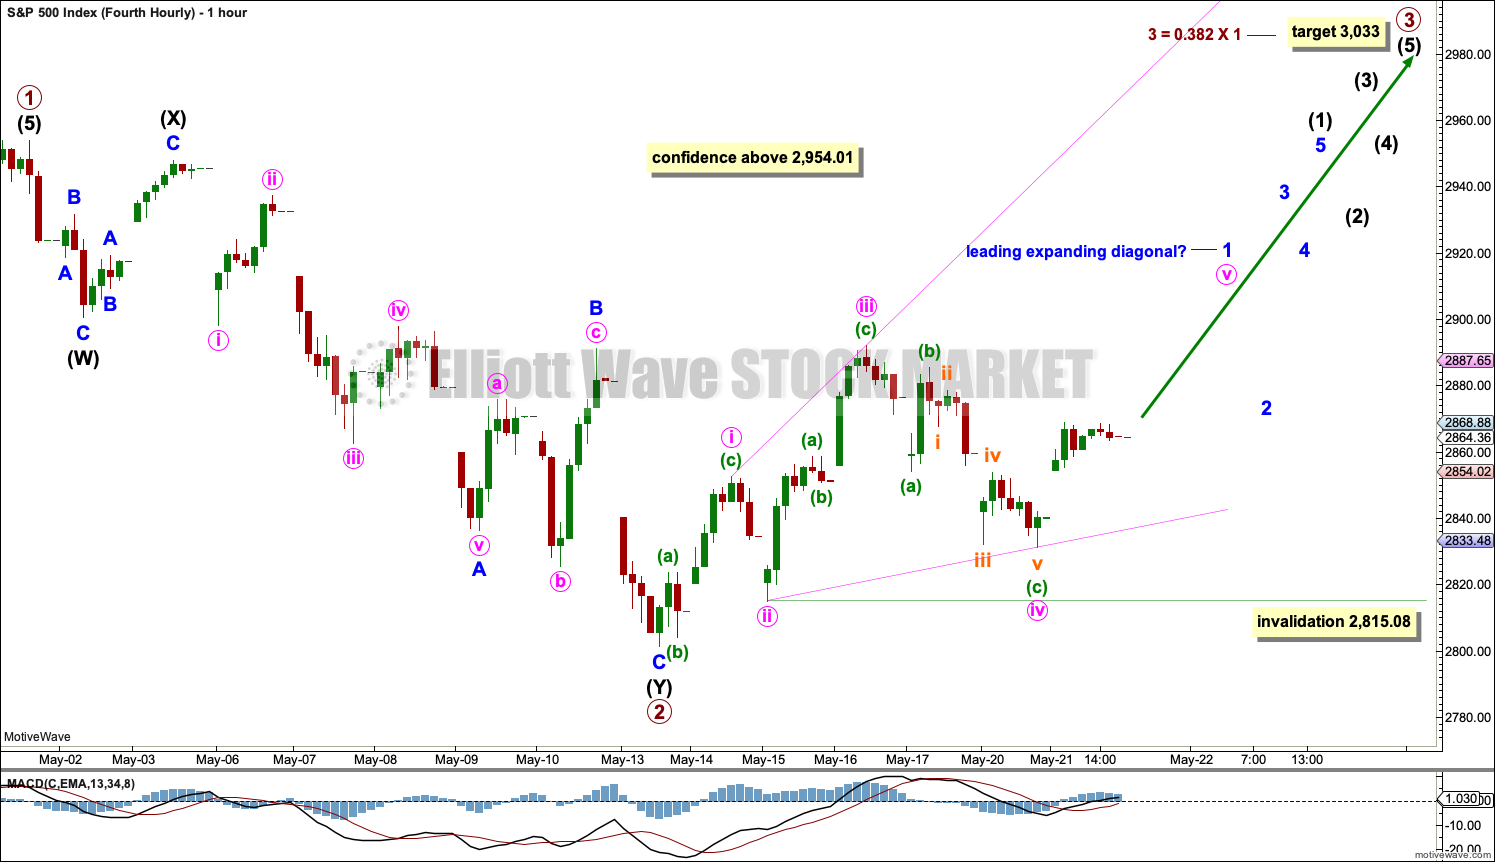
It is possible that primary wave 2 is over as a double zigzag.
If primary wave 3 has begun, then within it intermediate wave (1) may be incomplete. Intermediate wave (1) must subdivide as a five wave motive structure. Within intermediate wave (1), minor wave 1 does not fit as an impulse. It may be unfolding as a diagonal.
There is too much overlapping to see minor wave 1 over at the last high, but this movement does fit as a series of two zigzags. This may be minute waves i, ii and iii of a leading expanding diagonal. However, leading diagonals are not very common structures. It is much more common to see an impulse in a first wave position. Leading expanding diagonals are less common. The probability of this wave count is judged to have a lower probability based upon the structure unfolding upwards and sideways here.
SECOND WAVE COUNT
WEEKLY CHART
This weekly chart is identical to the first weekly chart, with the sole exception being the degree of labelling.
This weekly chart moves the degree of labelling for the impulse beginning in March 2009 all down one degree. This difference is best viewed on monthly charts.
The impulse is still viewed as nearing an end; a fifth wave is still seen as needing to complete higher. This wave count labels it primary wave 5.
TECHNICAL ANALYSIS
WEEKLY CHART
Click chart to enlarge. Chart courtesy of et=”_blank”>StockCharts.com.
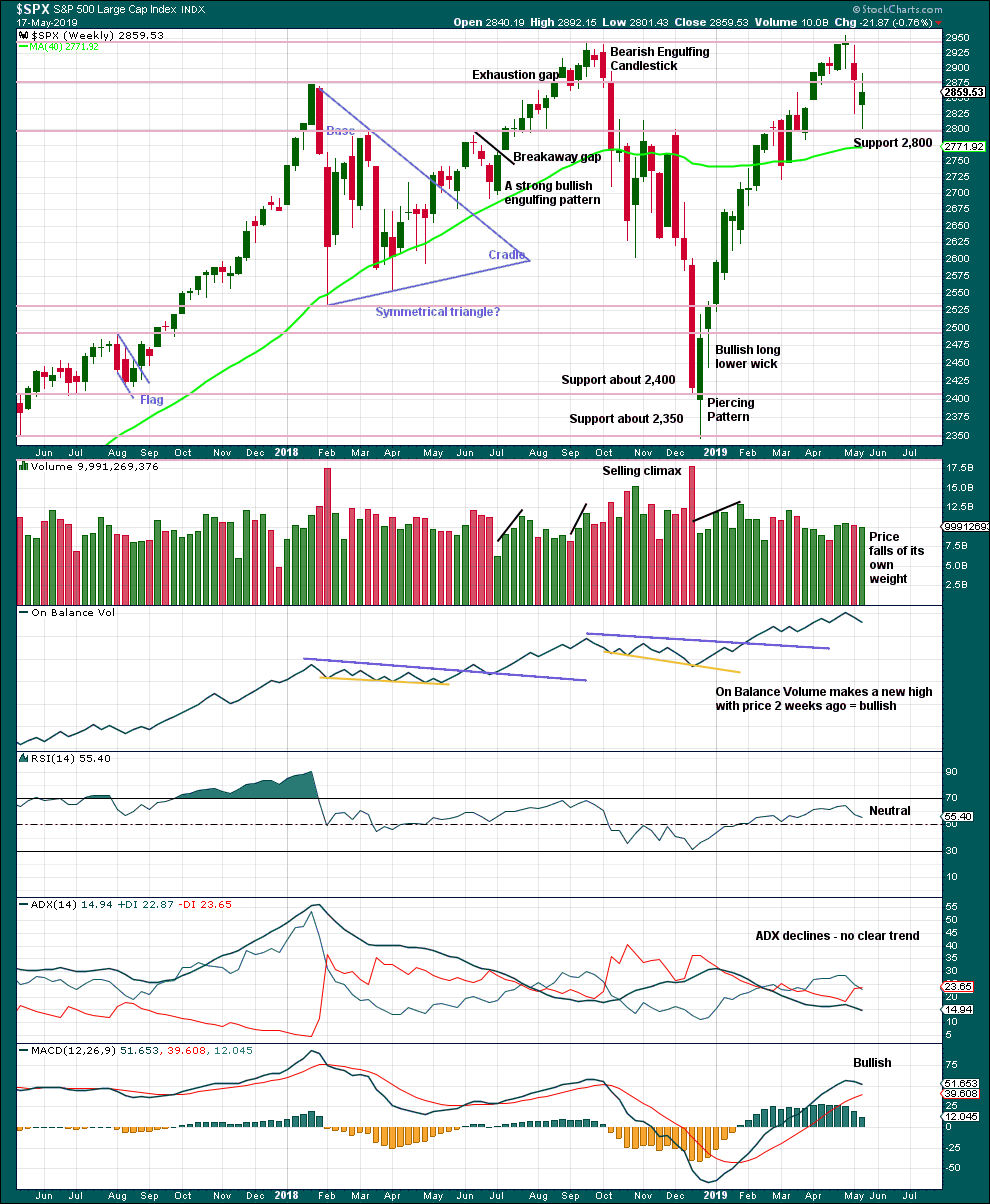
This week looks like a spinning top, although the real body may be too large for a typical spinning top. This puts the trend towards neutral. Support about 2,800 is strong and has so far held this week.
There is an upwards trend from the low in December 2018, a series of higher highs and higher lows with a new all time high on the 30th of April 2019. While the last swing low at 2,785.02 on the 25th of March remains intact, then this view should remain dominant.
The trend is your friend.
DAILY CHART
Click chart to enlarge. Chart courtesy of StockCharts.com.
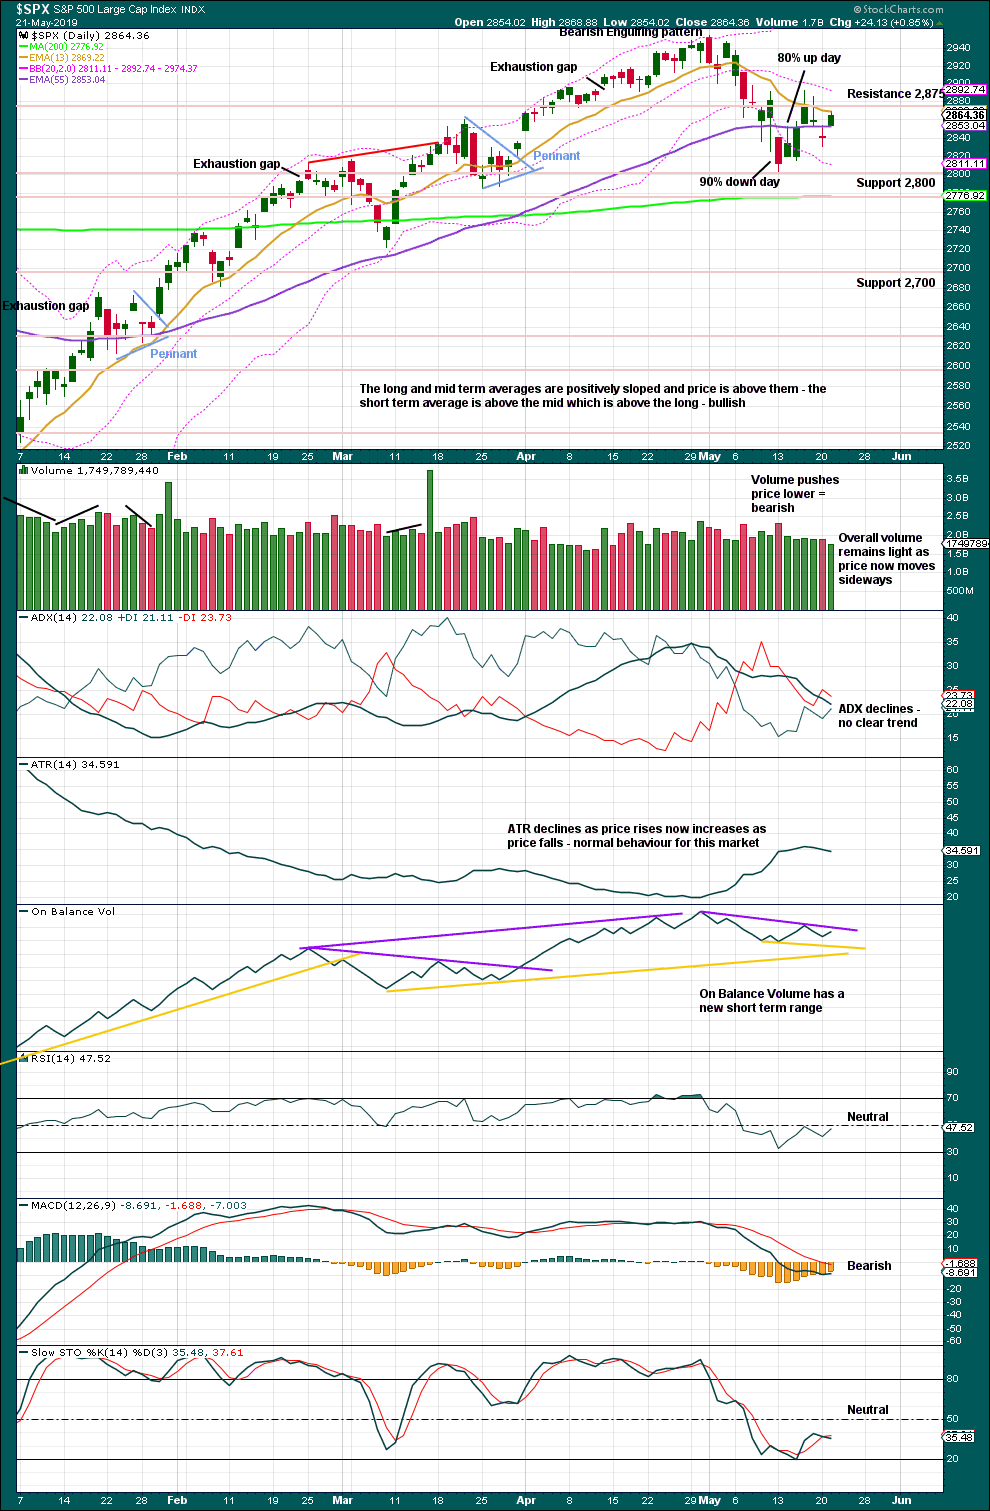
A 90% downwards day at or immediately prior a low followed immediately afterwards by a 90% upwards day is a strong indication of a low in place. The indication is weaker in this case, but the movement is also weaker. The 80% upwards day of the 14th of May shows an almost 180 degree shift in sentiment after the 90% downwards day immediately prior. This is a pattern seen at minor lows. This supports the fourth Elliott wave hourly count.
The dominant trend is up. Pullbacks in an upwards trend should be used as opportunities to join the trend.
It has been noted before that this market has been rising with light and declining volume at all time frames now for years. A lack of support from volume for upwards movement in the last few sessions is not of a concern in current market conditions.
Watch On Balance Volume carefully this week. A breakout would provide a weak signal that may add a little confidence to the next move from price.
BREADTH – AD LINE
WEEKLY CHART
Click chart to enlarge. Chart courtesy of StockCharts.com. So that colour blind members are included, bearish signals
will be noted with blue and bullish signals with yellow.
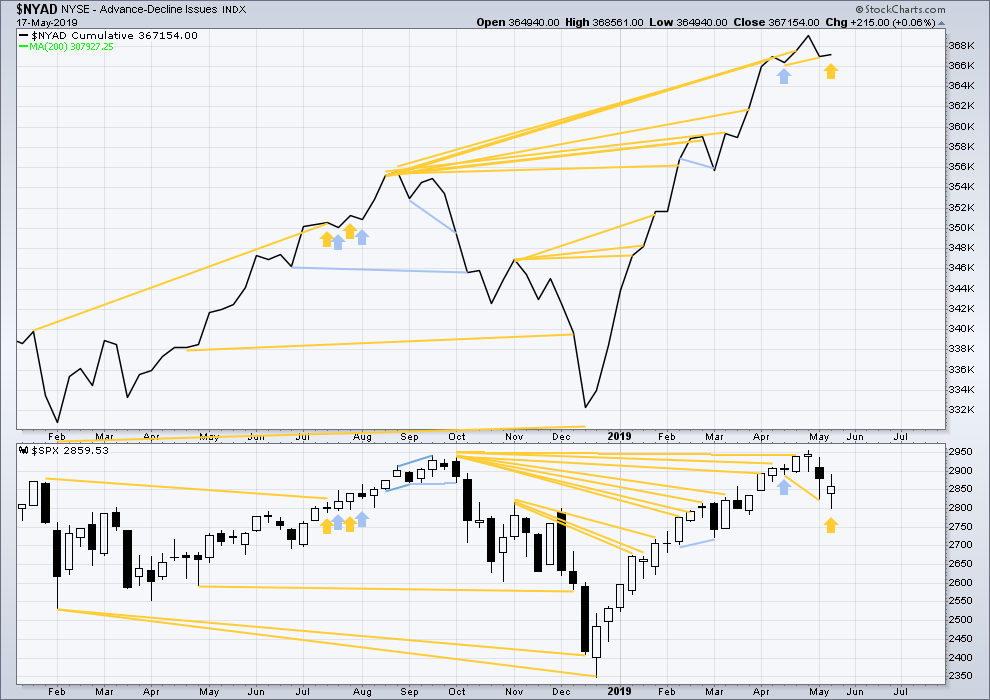
Every single bear market from the Great Depression and onwards has been preceded by a minimum of 4 months divergence between price and the AD line. With the AD line making a new all time high again on the 3rd of May, the end of this bull market and the start of a new bear market must be a minimum of 4 months away, which is the beginning of September 2019 at this time.
Last week price has moved lower with a lower low and a lower high, although the candlestick has closed green. The AD line has moved higher. This divergence is bullish and supports the view that a low may now be in place.
Last week all of large, mid and small caps have moved lower. None have made new swing lows below the low of the 25th of March. There is no divergence.
DAILY CHART
Click chart to enlarge. Chart courtesy of StockCharts.com. So that colour blind members are included, bearish signals
will be noted with blue and bullish signals with yellow.
Breadth should be read as a leading indicator.
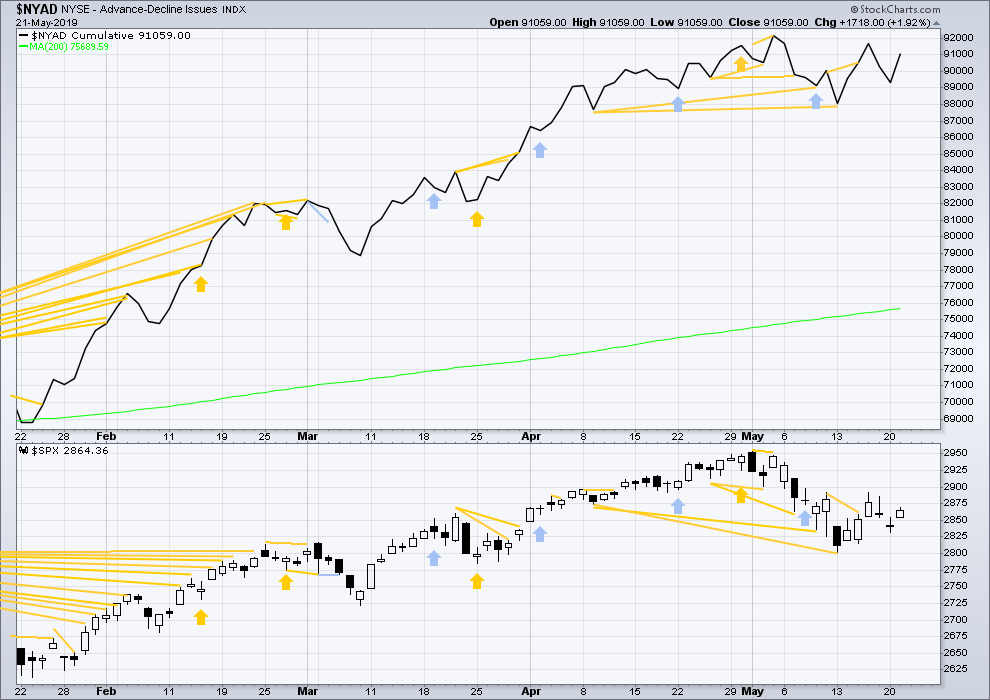
Mid-term bullish divergence remains and supports the view here that a low may be in place.
Today both price and the AD line moved higher. There is no new short-term divergence.
VOLATILITY – INVERTED VIX CHART
WEEKLY CHART
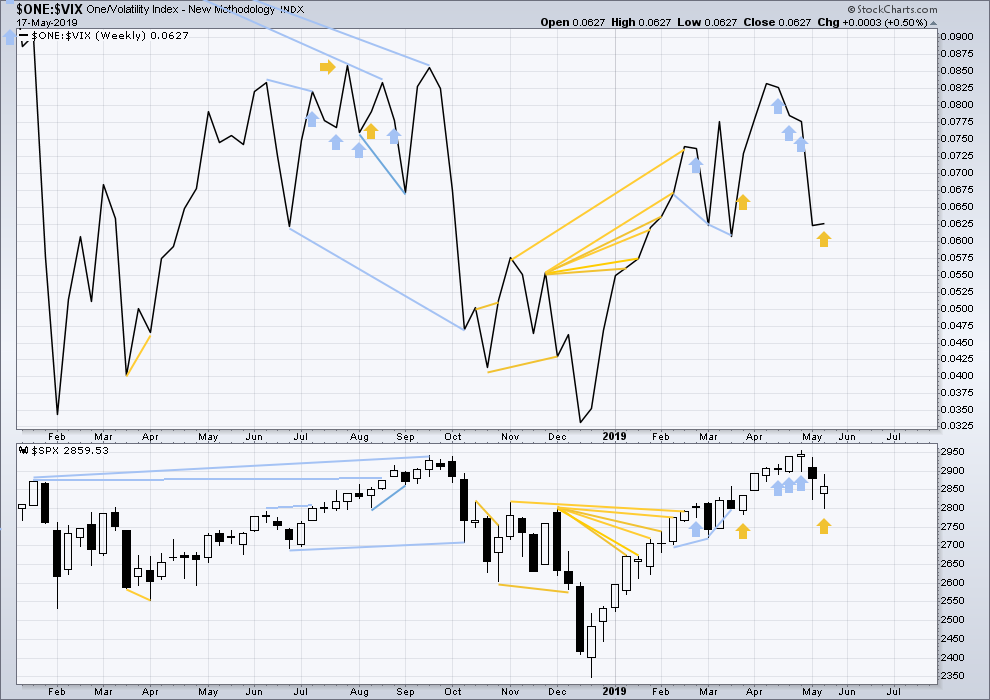
Click chart to enlarge. Chart courtesy of StockCharts.com. So that colour blind members are included, bearish signals
will be noted with blue and bullish signals with yellow.
Three weeks in a row of weekly bearish divergence has now been followed by two reasonable downwards weeks. It may be resolved here, or it may yet be an indication of further downwards movement in price.
Last week price moved lower, but the candlestick has closed green. Inverted VIX has moved higher. This divergence is bullish.
DAILY CHART
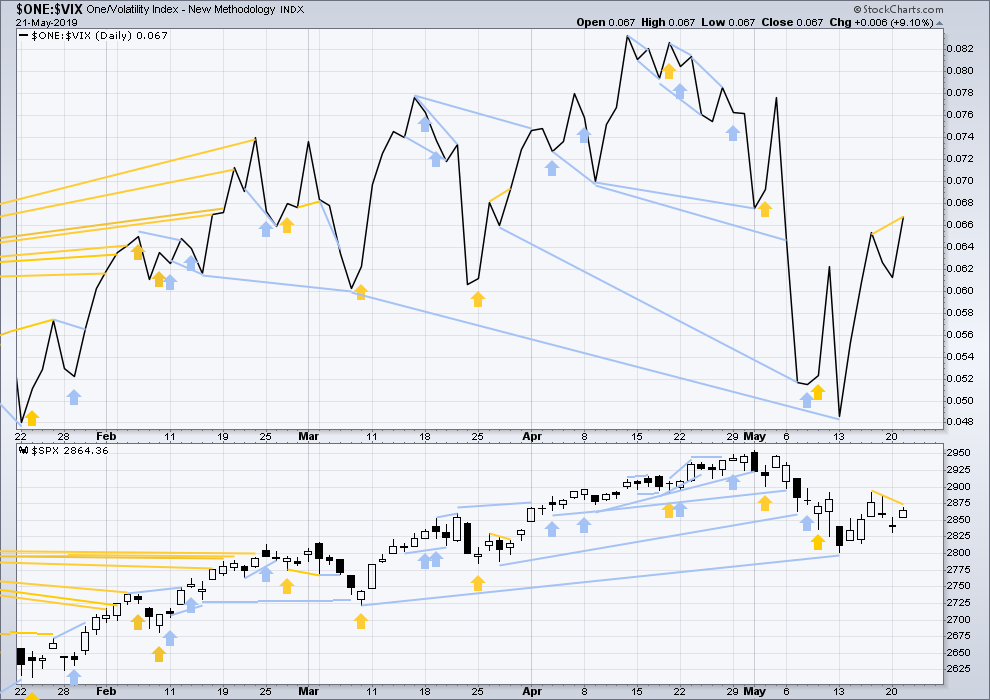
Click chart to enlarge. Chart courtesy of StockCharts.com. So that colour blind members are included, bearish signals
will be noted with blue and bullish signals with yellow.
Today inverted VIX has made a new short-term high above the prior high of the 16th of May, but price has not. This divergence is bullish for the short term, but it will not be given weight in this analysis because divergence is not seen for the AD line.
DOW THEORY
Dow Theory confirmed a bear market in December 2018. This does not necessarily mean a bear market at Grand Super Cycle degree though; Dow Theory makes no comment on Elliott wave counts. On the 25th of August 2015 Dow Theory also confirmed a bear market. The Elliott wave count sees that as part of cycle wave II. After Dow Theory confirmation of a bear market in August 2015, price went on to make new all time highs and the bull market continued.
DJIA: 23,344.52 – a close on the 19th of December at 23,284.97 confirms a bear market.
DJT: 9,806.79 – price has closed below this point on the 13th of December.
S&P500: 2,532.69 – a close on the 19th of December at 2,506.96 provides support to a bear market conclusion.
Nasdaq: 6,630.67 – a close on the 19th of December at 6,618.86 provides support to a bear market conclusion.
With all the indices moving now higher, Dow Theory would confirm a bull market if the following highs are made:
DJIA: 26,951.81
DJT: 11,623.58
S&P500: 2,940.91 – a new all time high has been made on the 29th of April 2019.
Nasdaq: 8,133.30 – a new high has been made on 24th of April 2019.
Published @ 07:08 p.m. EST.
—
Careful risk management protects your trading account(s).
Follow my two Golden Rules:
1. Always trade with stops.
2. Risk only 1-5% of equity on any one trade.
—
New updates to this analysis are in bold.

First hourly chart:
Either this or the second one have the best look so far.
Here minor Y would very likely be a flat. Within a flat, minute a must subdivide as a three, extremely likely to be a zigzag. That’s incomplete.
Second hourly chart:
Intermediate (B) could still be a triangle. Within it now minor C may be a single zigzag. Minor C could also really take its time and complete as a double zigzag.
Third hourly chart
This looks wrong today. For minute ii to be over at the last high, the downwards movement of the last two sessions is too choppy and overlapping. This looks like a B wave, not a first wave.
So to see minute ii continuing now it will have to breach the black channel to avoid a truncation.
Fourth hourly chart:
This one looks okay, but the structure of a leading diagonal is uncommon.
I’m moving the invalidation point up today to the start of minute wave v. Within minute wave v, minuette wave (b) may not move beyond the start of minuette wave (a).
As Verne would put it, SPX is “coiling!” But which way will it snap? I look forward to Lara’s update today.
Looks like it was a triangle?
PLNT has been a monster (50 -> 80 Dec to May), and is in a nice pullback right here and now. A good buy set up should be arriving “soon” on a hit/turn off the 50% or 61.8%.
(I’m bumping my response to Kevin up here into a new comment thread…)
Really interesting observation about the .618 retraces, Kevin. Good eye!
But here’s my problem: even though I have switched to trading mostly ES & NQ, and have managed to grab some nice profits in the off hours, I’m still somewhat suspicious of putting much weight on the wave structures of overnight data due to the incredibly low volume.
I’d welcome any contrary opinions on this.
no argument from me on that. Not at all suggesting it should be the basis of comprehensive EW analysis, I fully trust Lara’s judgement about that. I just like to look/analyze it a little bit because I sometimes see structural elements that aren’t so visible (or maybe not even there) at the day session level only. It “fills in the picture” for me a bit. And it is notable how large of moves we’ve been having in overnight sessions (i.e., “lots of big gaps”).
What my brain wants to see….
Me too.
That looks like a perfectly reasonable wave count Peter S. I am not persuaded by the bullish scenarios. I think 2722 is a very real possibility.
I will be looking to go long down there if it gets there and looks completed. Until then the upside potential has to be limited to under 3100 for a major top. At 2850 I don’t like the risk reward ratio for a longer term play (daily or weekly). From 2850 to 3000 and a new ATH is only a 5% move. But from the low 2700’s, we could see a 10% or 15% unleveraged upside move. That is much better, imo.
That’s the second hourly chart.
But remember my warning about EW triangles. Often invalidated, turns out something else is happening.
Yup!
Agreed. We all know that ES often leads, and then SPX will gap to meet up with it. I think observing Fibs like you do, even including overnight data, can give us some really helpful clues. Thank you, Kevin! Please keep it up!
PS: Of course, on a daily chart basis, ES and SPX are nearly identical. So there’s that…
1… thank you
Looking at /ES hourly with overnight data, this is what I see. And frankly, it’s fibonacci-spooky. The big downmove off the ATH came down just a bit over 61.8% of the previous up leg. It moved up just slightly less than 61.8% of that down move. And came down and turned a smidge over 61.8% of that move (with a double bottom to throw some off the scent). And today went up and slightly turned…exactly at 61.8% of THAT move.
Fibo-magic right there. A sequence of four (ABCD?) almost perfect 61.8% retracements in a row. Amazing.
An E wave down here would hit the 61.8% at 2847. Any significant movement up from there and I’ll be tapping the buy button a little. With a stop just under the turn level.
Thats fantastic!
That bit of information is quite interesting and remarkable, Kevin. From an EW perspective, though, a second wave cannot be a triangle. Perhaps this is not a second wave but rather a fourth.
The overnight action got to with about 0.8 points of the final 61.8% retrace. “E is done”. Yes Rodney, if this is right (doubtful but…) it’s a big triangle 4, as it includes “all” of the correction off the ATH.
We’ll see what happens now. I will watch for buy triggers…
Well i think for triangle wave B has to be around 0.8 of the A, but it’s only 0.618… but it’s incredible
Thanks Kevin
agreed, it’s a stretch to call it a triangle. How about the more generic Verne term, a “coil”.
And now the darn thing is coiling up tighter than…well, you know, tight!!!
There is no rule stating a minimum nor maximum for wave B within a triangle.
My research so far on Gold shows a range of lengths for B waves within triangles from 0.71 to 2.19 (longer than 1 = a running triangle).
Overall, each triangle subwave is almost always longer than 0.618 and the mean depth of wave C is 0.80.
In short, triangle subwaves are usually longer than 0.618 for the structure to have the right look.