
A small range day remains inside last week’s range leaving all three short-term Elliott wave counts unchanged.
Summary: The low of December 2018 is expected to remain intact, and this pullback is expected to be followed by a strong third wave up to new all time highs.
Three scenarios are possible, note that the order of probability has changed:
1. Some sideways movement continues before a final wave down to about 2,722 completes the pullback in two or three weeks time.
2. A pullback ends this week about 2,740 or 2,722.
3. The pullback is over. Confidence in this view may be had with a new all time high above 2,954.13. The next target would be at 3,033 for another larger consolidation. This target may be met in about a month.
The biggest picture, Grand Super Cycle analysis, is here.
Monthly charts were last published here, with video here. There are two further alternate monthly charts here, with video here.
ELLIOTT WAVE COUNTS
The two Elliott wave counts below will be labelled First and Second rather than main and alternate as they may be about of even probability. When the fifth wave currently unfolding on weekly charts may be complete, then these two wave counts will diverge on the severity of the expected following bear market. To see an illustration of this future divergence monthly charts should be viewed.
FIRST WAVE COUNT
WEEKLY CHART
Click chart to enlarge.
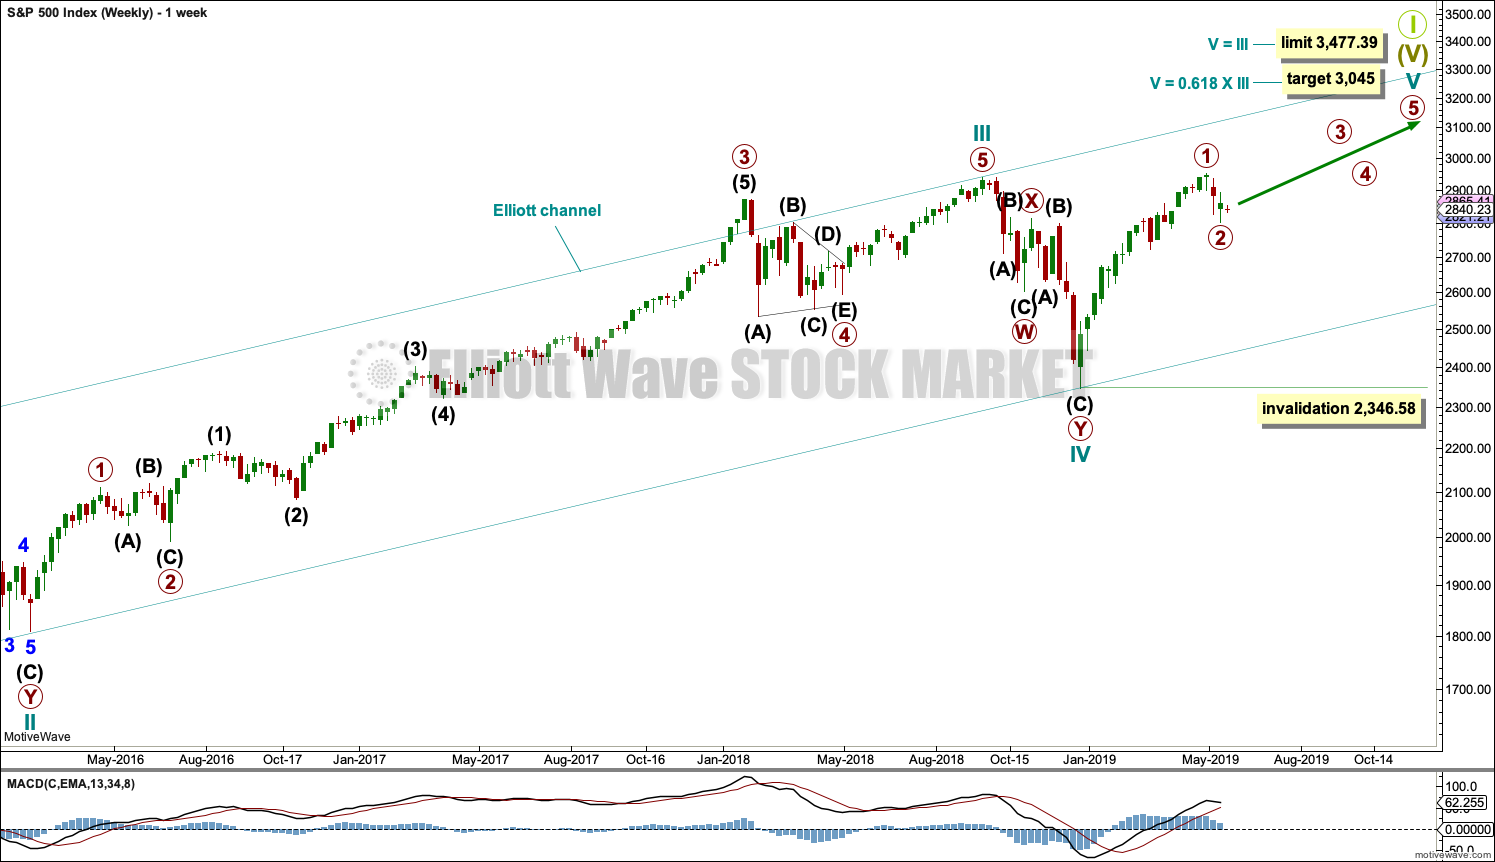
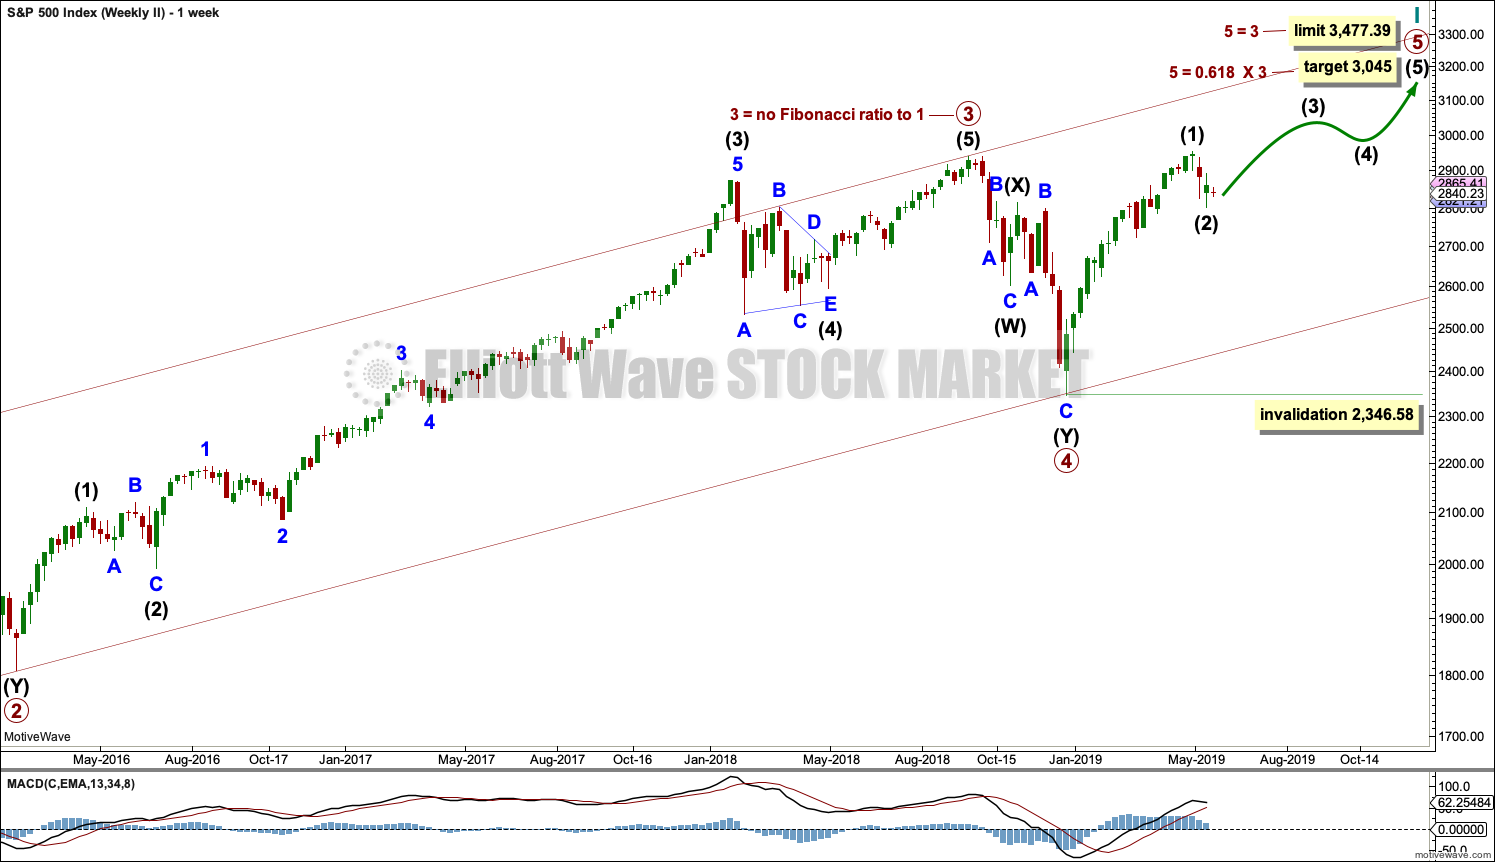
The basic Elliott wave structure consists of a five wave structure up followed by a three wave structure down (for a bull market). This wave count sees the bull market beginning in March 2009 as an incomplete five wave impulse and now within the last fifth wave, which is labelled cycle wave V. This impulse is best viewed on monthly charts. The weekly chart focusses on the end of it.
Elliott wave is fractal. This fifth wave labelled cycle wave V may end a larger fifth wave labelled Super Cycle wave (V), which may end a larger first wave labelled Grand Super Cycle wave I.
The teal Elliott channel is drawn using Elliott’s first technique about the impulse of Super Cycle wave (V). Draw the first trend line from the end of cycle wave I (off to the left of the chart, the weekly candlestick beginning 30th November 2014) to the end of cycle wave III, then place a parallel copy on the end of cycle wave II. This channel perfectly shows where cycle wave IV ended at support. The strongest portion of cycle wave III, the end of primary wave 3, overshoots the upper edge of the channel. This is a typical look for a third wave and suggests the channel is drawn correctly and the way the impulse is counted is correct.
Within Super Cycle wave (V), cycle wave III is shorter than cycle wave I. A core Elliott wave rule states that a third wave may never be the shortest. For this rule to be met in this instance, cycle wave V may not be longer in length than cycle wave III. This limit is at 3,477.39.
A final target is calculated at cycle degree for the impulse to end.
The structure of cycle wave V is focussed on at the daily chart level below.
Within cycle wave V, primary wave 2 may not move beyond the start of primary wave 1 below 2,346.58.
In historic analysis, two further monthly charts have been published that do not have a limit to upwards movement and are more bullish than this wave count. Members are encouraged to consider those possibilities (links below summary) alongside the wave counts presented on a daily and weekly basis.
DAILY CHART
Click chart to enlarge.
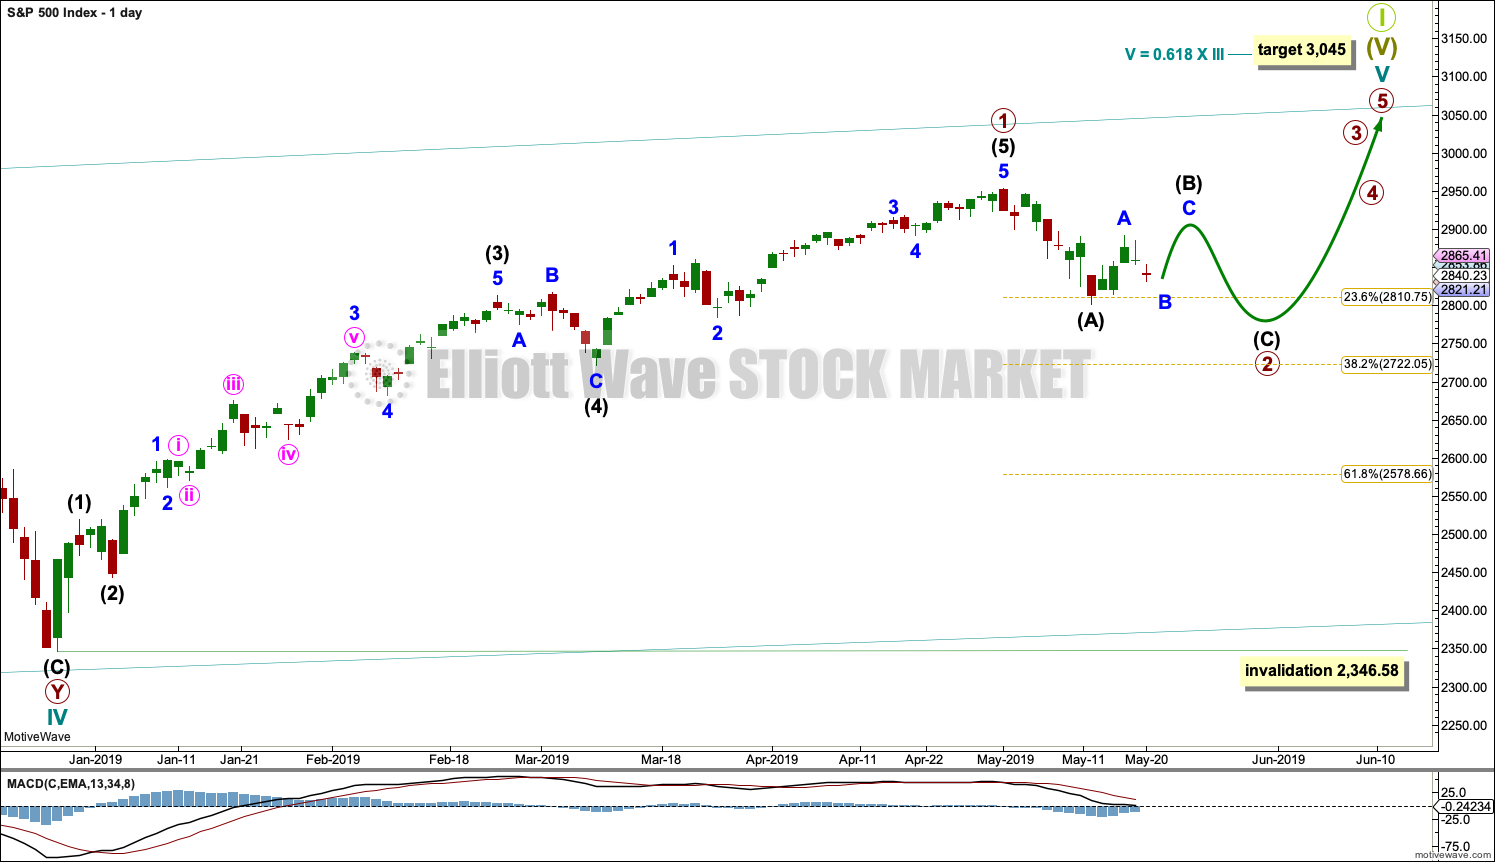
Cycle wave V must subdivide as a five wave motive structure. Within that five wave structure, primary wave 1 may be complete. Primary wave 2 may now continue sideways and / or lower as a zigzag, which may end within another couple of weeks or so. It is also possible that primary wave 2 was over at last week’s low although today that scenario has reduced in probability.
Primary wave 3 must move above the end of primary wave 1.
When primary wave 3 is over, then primary wave 4 may be a shallow sideways consolidation that may not move into primary wave 1 price territory below 2,954.13.
Thereafter, primary wave 5 should move above the end of primary wave 3 to avoid a truncation.
Primary wave 2 may not move beyond the start of primary wave 1 below 2,346.58.
Three hourly charts are published.
FIRST HOURLY CHART
Click chart to enlarge.
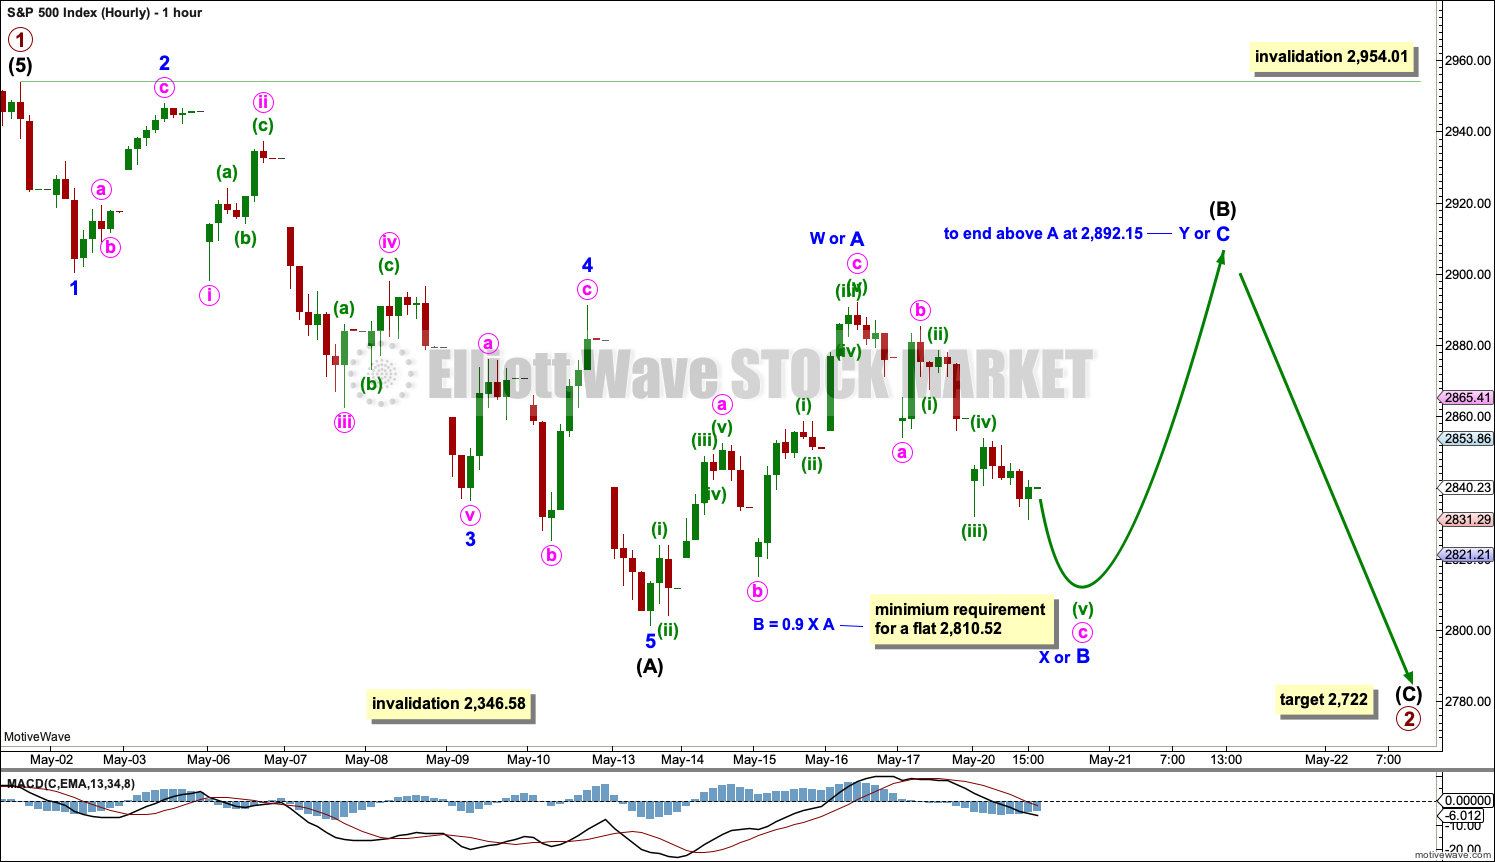
It remains possible that primary wave 2 is incomplete and may be a longer lasting and deeper zigzag. This would have better proportion on the daily and weekly chart.
Intermediate wave (A) subdivides well as a five wave impulse.
This wave count allows for sideways movement for another week to three before a final wave down to complete the pullback labelled primary wave 2.
Intermediate wave (B) may not move beyond the start of intermediate wave (A) above 2,954.01.
Considering the possible structure of intermediate wave (B), it looks like it has begun with a three wave structure higher that is labelled minor wave A or W. When corrections begin with a three wave structure, then a flat, combination or triangle is indicated. All three remain possible for intermediate wave (B).
Flat corrections are fairly common structures for B waves. If intermediate wave (B) is a flat correction, then within it minor wave B must retrace a minimum 0.9 length of minor wave A, which has not yet been met. This requirement would be met with a low at 2,810.52. Minor wave B may make a new low below the start of minor wave A at 2,801.43 as in an expanded flat. Thereafter, minor wave C should end above the end of minor wave A at 2,892.15 to avoid a truncation.
A triangle would be the next likely structure for intermediate wave (B). Within a triangle, minor wave A may now be a complete zigzag. Minor wave B may also be a complete zigzag over at today’s low or it may continue lower tomorrow. A triangle would now expect sideways movement in an ever decreasing range for a few more sessions. Minor wave B may make a new low below the start of minor wave A at 2,801.43 as in a running triangle. Minor wave C may not move beyond the end of minor wave A above 2,892.15. Minor wave D may not move reasonably beyond the end of minor wave B. Minor wave E may not move beyond the end of minor wave C.
Combinations are not as common as flats and triangles. A combination would be labelled minor wave W – X – Y. Minor wave W may be a complete zigzag. Minor wave X may be complete at today’s low, or it may yet move lower. There is no minimum nor maximum requirement for X waves within combinations. The second structure of minor wave Y would most likely be a flat, but it may also be a triangle.
SECOND HOURLY CHART
Click chart to enlarge.
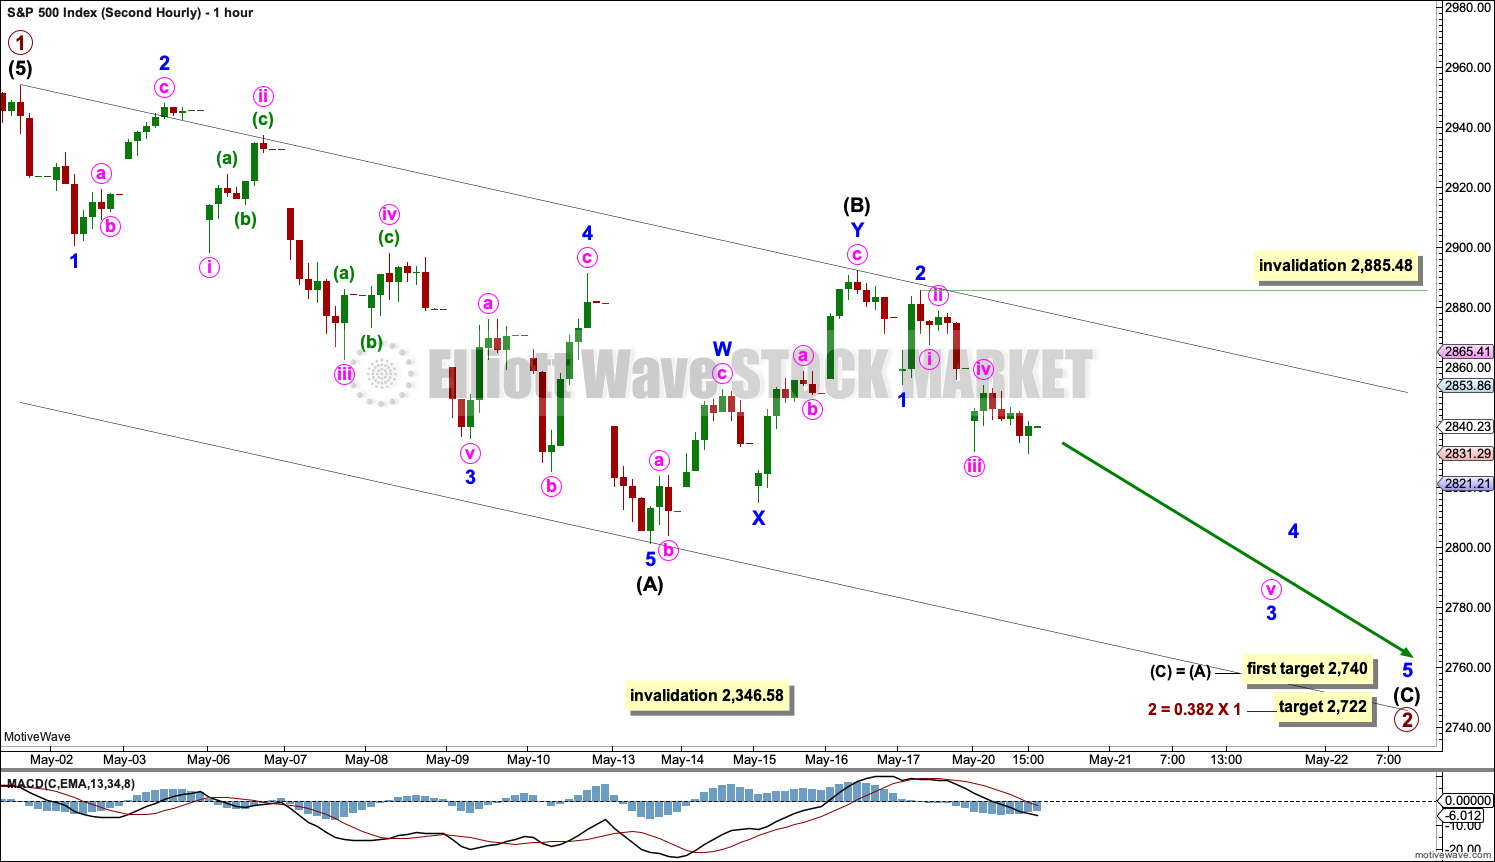
It is possible that primary wave 2 is an incomplete zigzag, and within it intermediate wave (B) is complete. This wave count expects downwards movement this week to complete intermediate wave (C) and in turn complete the zigzag of primary wave 2.
Within intermediate wave (C), minor waves 1 and 2 may now be complete. Within minor wave 3, minute waves i and ii may now be complete.
If intermediate wave (B) is complete, then bounces within intermediate wave (C) should find resistance at the upper edge of the black Elliott channel.
THIRD HOURLY CHART
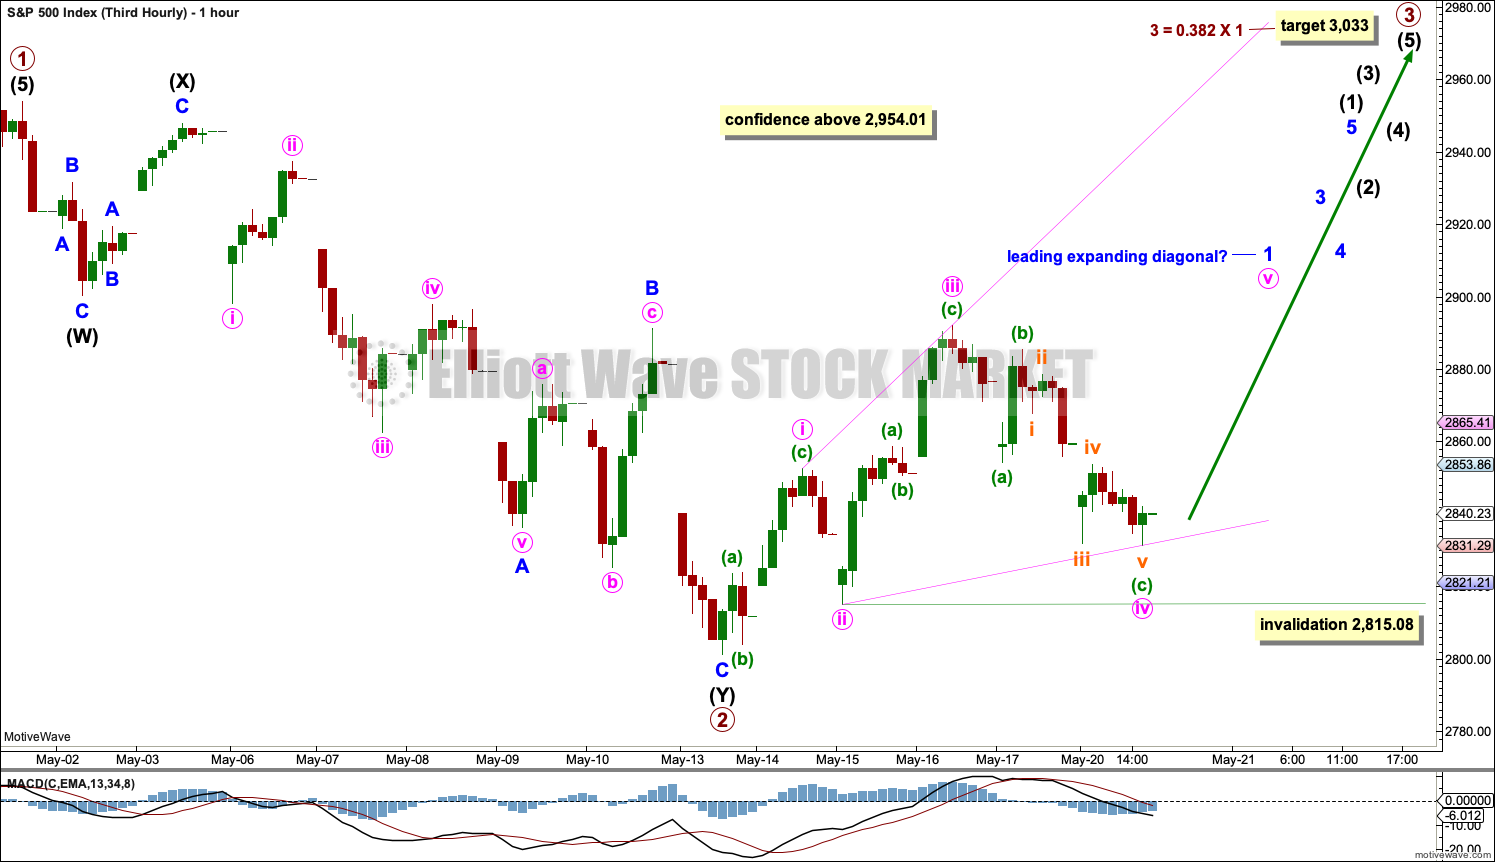
Click chart to enlarge.
This third hourly chart has some support from Lowry’s data and bullish divergence at the weekly chart level between price and both of the AD line and inverted VIX.
It is possible that primary wave 2 is over as a double zigzag.
If primary wave 3 has begun, then within it intermediate wave (1) may be incomplete. Intermediate wave (1) must subdivide as a five wave motive structure. Within intermediate wave (1), minor wave 1 does not fit as an impulse. It may be unfolding as a diagonal.
There is too much overlapping to see minor wave 1 over at the last high, but this movement does fit as a series of two zigzags. This may be minute waves i, ii and iii of a leading expanding diagonal. However, leading diagonals are not very common structures. It is much more common to see an impulse in a first wave position. Leading expanding diagonals are less common. The probability of this wave count today is judged to have a lower probability based upon the structure unfolding upwards and sideways here.
SECOND WAVE COUNT
WEEKLY CHART
Click chart to enlarge.
This weekly chart is identical to the first weekly chart, with the sole exception being the degree of labelling.
This weekly chart moves the degree of labelling for the impulse beginning in March 2009 all down one degree. This difference is best viewed on monthly charts.
The impulse is still viewed as nearing an end; a fifth wave is still seen as needing to complete higher. This wave count labels it primary wave 5.
TECHNICAL ANALYSIS
WEEKLY CHART
Click chart to enlarge. Chart courtesy of et=”_blank”>StockCharts.com.
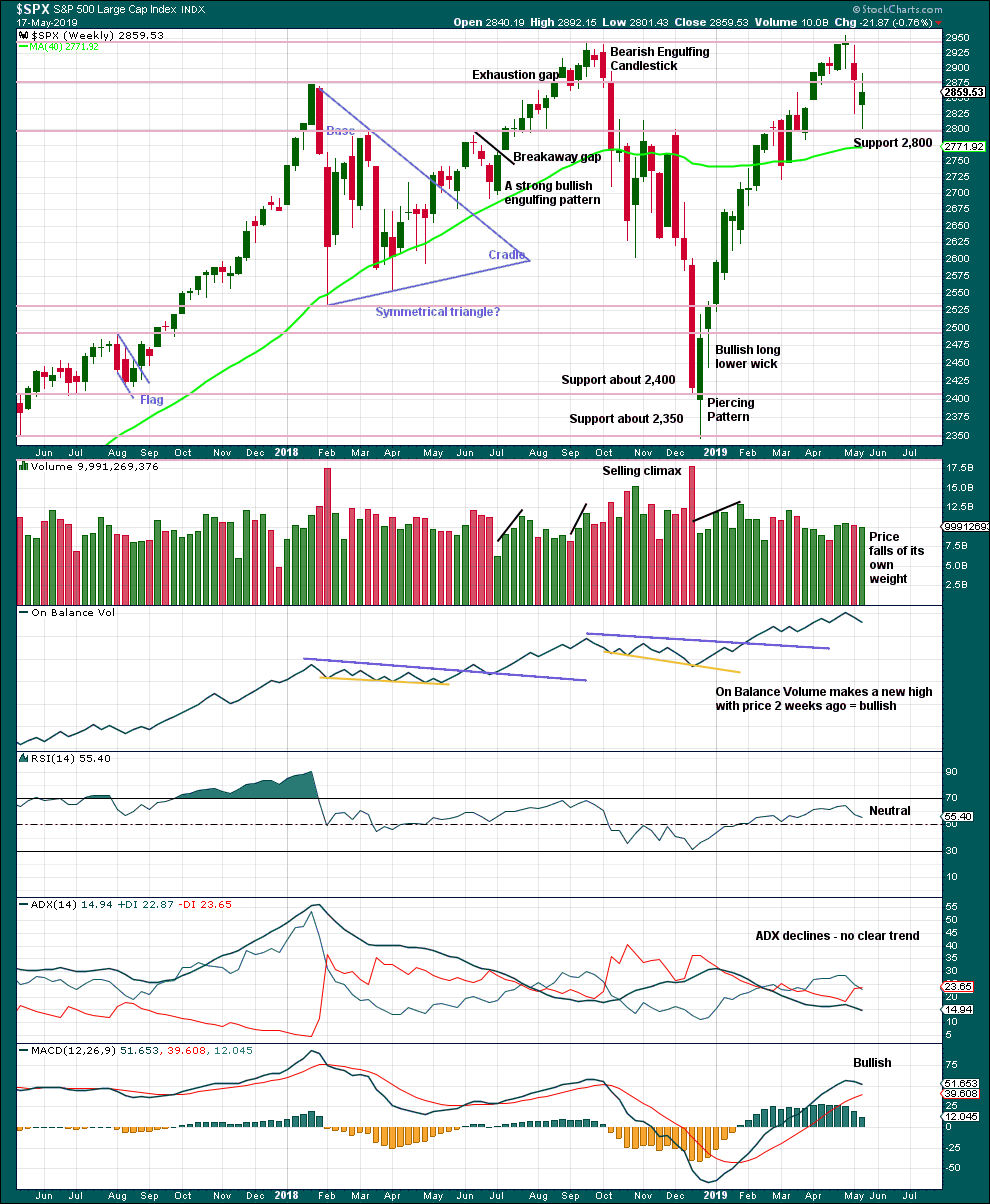
This week looks like a spinning top, although the real body may be too large for a typical spinning top. This puts the trend towards neutral. Support about 2,800 is strong and has so far held this week.
There is an upwards trend from the low in December 2018, a series of higher highs and higher lows with a new all time high on the 30th of April 2019. While the last swing low at 2,785.02 on the 25th of March remains intact, then this view should remain dominant.
The trend is your friend.
DAILY CHART
Click chart to enlarge. Chart courtesy of StockCharts.com.
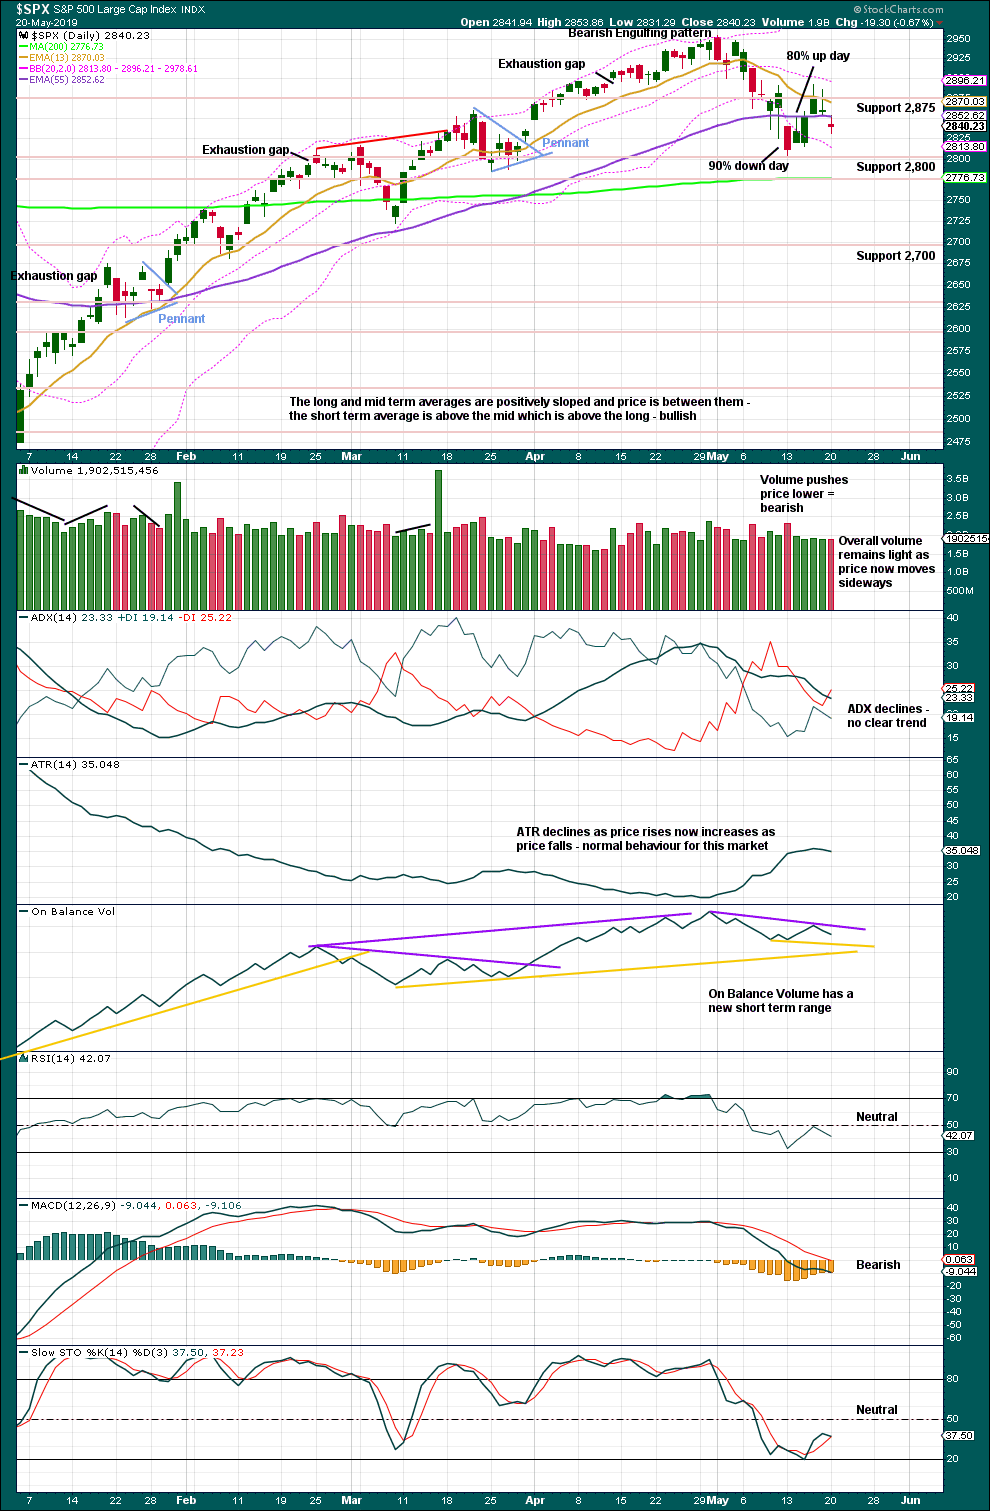
A 90% downwards day at or immediately prior a low followed immediately afterwards by a 90% upwards day is a strong indication of a low in place. The indication is weaker in this case, but the movement is also weaker. The 80% upwards day of the 14th of May shows an almost 180 degree shift in sentiment after the 90% downwards day immediately prior. This is a pattern seen at minor lows. This supports the third Elliott wave hourly count.
The dominant trend is up. Pullbacks in an upwards trend should be used as opportunities to join the trend.
It has been noted before that this market has been rising with light and declining volume at all time frames now for years. A lack of support from volume for upwards movement in the last few sessions is not of a concern in current market conditions.
Watch On Balance Volume carefully this week. A breakout would provide a weak signal that may add a little confidence to the next move from price.
BREADTH – AD LINE
WEEKLY CHART
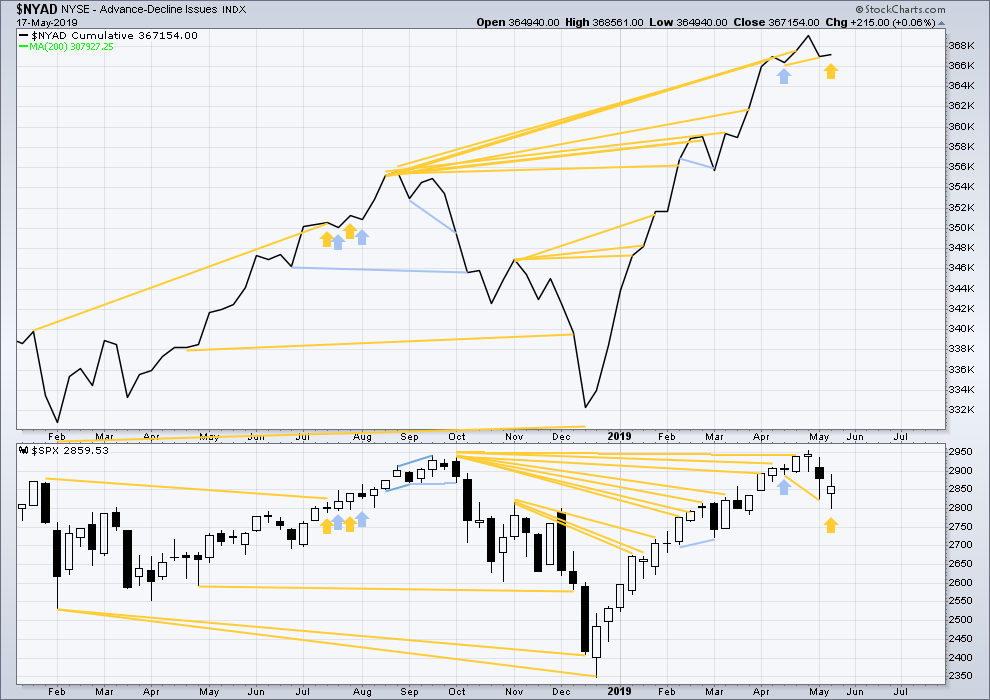
Click chart to enlarge. Chart courtesy of StockCharts.com. So that colour blind members are included, bearish signals
will be noted with blue and bullish signals with yellow.
Every single bear market from the Great Depression and onwards has been preceded by a minimum of 4 months divergence between price and the AD line. With the AD line making a new all time high again last week, the end of this bull market and the start of a new bear market must be a minimum of 4 months away, which is the beginning of September 2019 at this time.
Last week price has moved lower with a lower low and a lower high, although the candlestick has closed green. The AD line has moved higher. This divergence is bullish and supports the view that a low may now be in place.
Last week all of large, mid and small caps have moved lower. None have made new swing lows below the low of the 25th of March. There is no divergence.
DAILY CHART
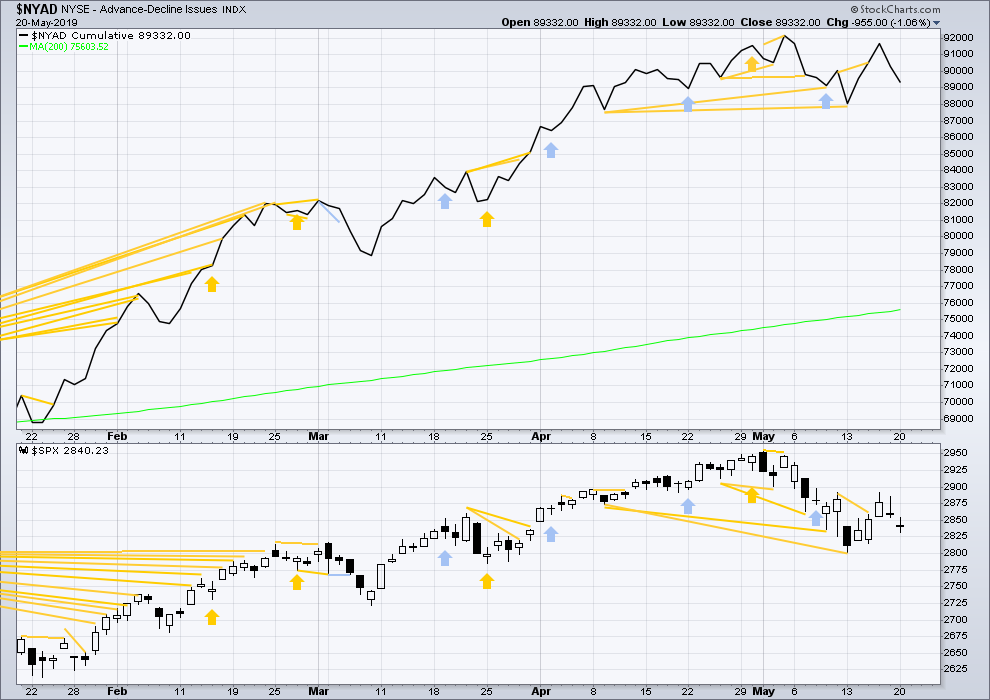
Click chart to enlarge. Chart courtesy of StockCharts.com. So that colour blind members are included, bearish signals
will be noted with blue and bullish signals with yellow.
Breadth should be read as a leading indicator.
Mid-term bullish divergence remains and supports the view here that a low may be in place.
Today both price and the AD line moved lower. There is no new short-term divergence.
VOLATILITY – INVERTED VIX CHART
WEEKLY CHART
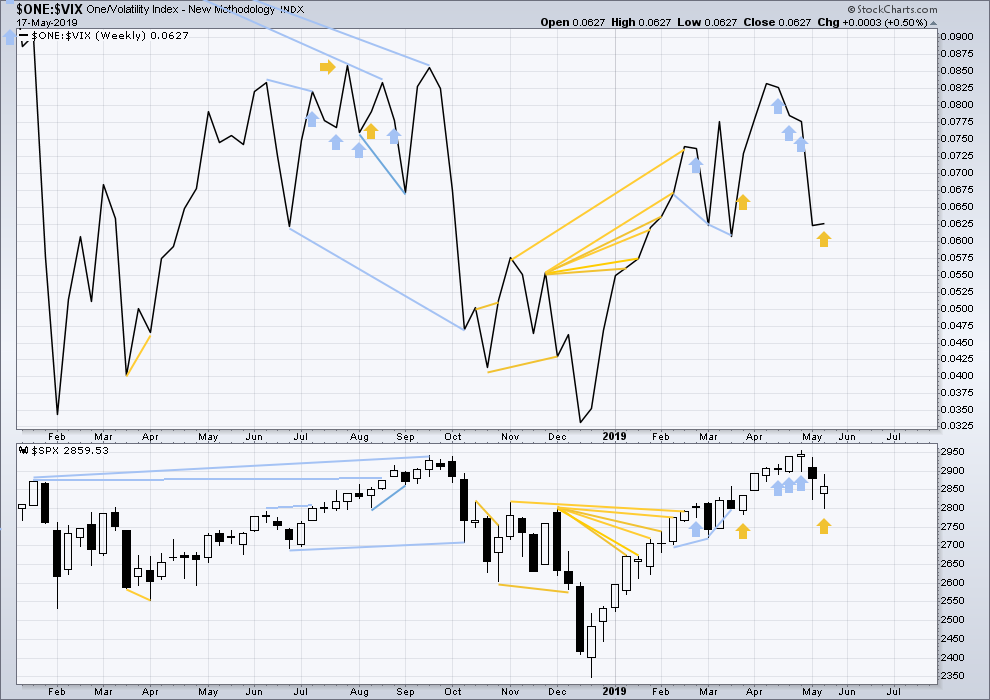
Click chart to enlarge. Chart courtesy of StockCharts.com. So that colour blind members are included, bearish signals
will be noted with blue and bullish signals with yellow.
Three weeks in a row of weekly bearish divergence has now been followed by two reasonable downwards weeks. It may be resolved here, or it may yet be an indication of further downwards movement in price.
Last week price moved lower, but the candlestick has closed green. Inverted VIX has moved higher. This divergence is bullish.
DAILY CHART
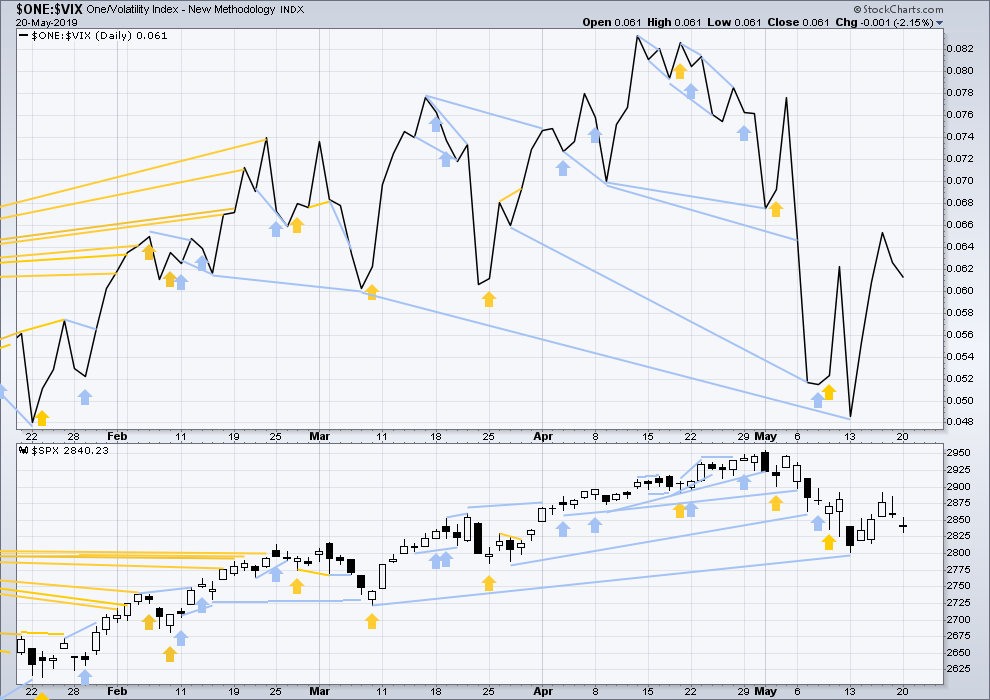
Click chart to enlarge. Chart courtesy of StockCharts.com. So that colour blind members are included, bearish signals
will be noted with blue and bullish signals with yellow.
Today both price and inverted VIX have moved lower. There is no new short-term divergence.
DOW THEORY
Dow Theory confirmed a bear market in December 2018. This does not necessarily mean a bear market at Grand Super Cycle degree though; Dow Theory makes no comment on Elliott wave counts. On the 25th of August 2015 Dow Theory also confirmed a bear market. The Elliott wave count sees that as part of cycle wave II. After Dow Theory confirmation of a bear market in August 2015, price went on to make new all time highs and the bull market continued.
DJIA: 23,344.52 – a close on the 19th of December at 23,284.97 confirms a bear market.
DJT: 9,806.79 – price has closed below this point on the 13th of December.
S&P500: 2,532.69 – a close on the 19th of December at 2,506.96 provides support to a bear market conclusion.
Nasdaq: 6,630.67 – a close on the 19th of December at 6,618.86 provides support to a bear market conclusion.
With all the indices moving now higher, Dow Theory would confirm a bull market if the following highs are made:
DJIA: 26,951.81
DJT: 11,623.58
S&P500: 2,940.91 – a new all time high has been made on the 29th of April 2019.
Nasdaq: 8,133.30 – a new high has been made on 24th of April 2019.
Published @ 10:11 p.m. EST.
—
Careful risk management protects your trading account(s).
Follow my two Golden Rules:
1. Always trade with stops.
2. Risk only 1-5% of equity on any one trade.
—
New updates to this analysis are in bold.
Hi everybody, some info you may need for reference at the end of this Friday session.
Yesterday, quick family decision, Cesar and I bought tickets to fly to Texas. Our flight leaves Friday evening (NZ time) and arrives in the USA late Friday evening.
So I’ll be in the air when the Friday session comes to a close and I will not be able to offer you any comment or update here. Unless of course they have good wifi on the plane, but that’s highly unlikely.
Have a great time in the USA. Hopefully, you have not taken up tornado chasing as a hobby (don’t worry they should be all gone by the time you get here). Crazy weather down south these days.
I have four hourly charts for you this morning. That’s because a B wave may be unfolding, so there’s more than the usual complexity.
In more classic TA terms, price is range bound. 3 of my 4 hourly charts expect a downwards breakout, the last chart expects an upwards breakout but the EW picture for that isn’t looking good.
First hourly chart:
Intermediate (B) does not look like a flat may be unfolding. The minimum 0.9 retracement for minor wave B within it was not met.
It may be a combination: zigzag – X – flat (or less likely triangle).
Now beginning minor wave Y which would most likely be a flat, less likely a triangle. Sideways movement. The purpose of the second structure in a double combination is to take up time and move price sideways. To achieve that purpose it usually ends about the same level as W.
Next hourly chart, this is new. Looking now at the other remaining possible structure for minor wave B, a triangle.
The rules for EW triangles are much more prescriptive than classic triangles. I’ll consider only contracting or barrier triangles, because I think I’ve only ever seen one expanding triangle, they’re too rare to consider.
For both types C may not move above A. Any amount at any time frame above A invalidates the triangle.
Third hourly chart (was the second in published analysis above, today moves into 3rd place)
Intermediate (B) could still be over, intermediate (C) down now should find resistance at the upper edge of the black channel.
Fourth hourly chart (was 3rd in analysis published above, now moves into 4th place)
Primary 2 could be over. But still looking now at a leading expanding diagonal for minor wave 1 to begin the new trend of primary wave 3.
This count has the lowest ranking only because the EW structure it needs to see here is the least common. That’s it.
SPX A/D running 10-1 all session long so far…but not much up ward price action. “interesting…”
where do you get your data from for A/D
I use thinkorswim, and it’s on the marketwatch tab, “index watch”, and you select which index you want the #’s for.
Appears to me the second hourly is now toast, and it’s either the first or the third. Both call for “more up” in the short term. And with this massive A-D staying steady at 10-1 or better…seems likely to me too.
I’m a hip daddy today, bought a tiny amount of bitcoin (via GBTC) and CRON (canadian cannabis). Lol!!! I can get buzzed while I count my bits…
On a bit more serious note, I perceive that bonds might have topped here and initiated another price movement back down. I bought a little TMV (3x bond bear ETF) to try to take advantage of that.
I also re-established a GLD position short with some puts. The E wave down is clear and “should go deeper”.
Maybe that damn evil triangle for intermediate B. Lara mentioned that as next likely structure versus the flat for int B. Seem like we are working minor C now. Time will tell.
“Appears to me the second hourly is now toast”
Not so fast there….
Price remains within the channel, it still looks okay actually.
On the chart posted above you’ll now see why I left the invalidation point where I did.
😉
Curses! Ari, you came out of nowhere to claim the #1 spot. Curses!
It looks like sideways movement for a few days to a week. This will enable nimble traders to get short for the inevitable drop to the low 2700’s.
Haha. I can be sneaky sometimes!