
Both the AD line and VIX at the end of the week give the same signal. In conjunction with Lowry’s data, this indicates a more bullish scenario should be dominant.
The Elliott wave count has a new short to mid-term target.
Summary: The low of December 2018 is expected to remain intact, and this pullback is expected to be followed by a strong third wave up to new all time highs.
Three scenarios are possible at the end of this week (judged in order of probability):
1. The pullback is over. Confidence in this view may be had with a new all time high above 2,954.13. The next target would be at 3,033 for another larger consolidation. This target may be met in about a month.
2. Some sideways movement continues next week before a final wave down to about 2,722 completes the pullback in two or three weeks time.
3. A pullback ends next week about 2,740 or 2,722.
The biggest picture, Grand Super Cycle analysis, is here.
Monthly charts were last published here, with video here. There are two further alternate monthly charts here, with video here.
ELLIOTT WAVE COUNTS
The two Elliott wave counts below will be labelled First and Second rather than main and alternate as they may be about of even probability. When the fifth wave currently unfolding on weekly charts may be complete, then these two wave counts will diverge on the severity of the expected following bear market. To see an illustration of this future divergence monthly charts should be viewed.
FIRST WAVE COUNT
WEEKLY CHART
Click chart to enlarge.
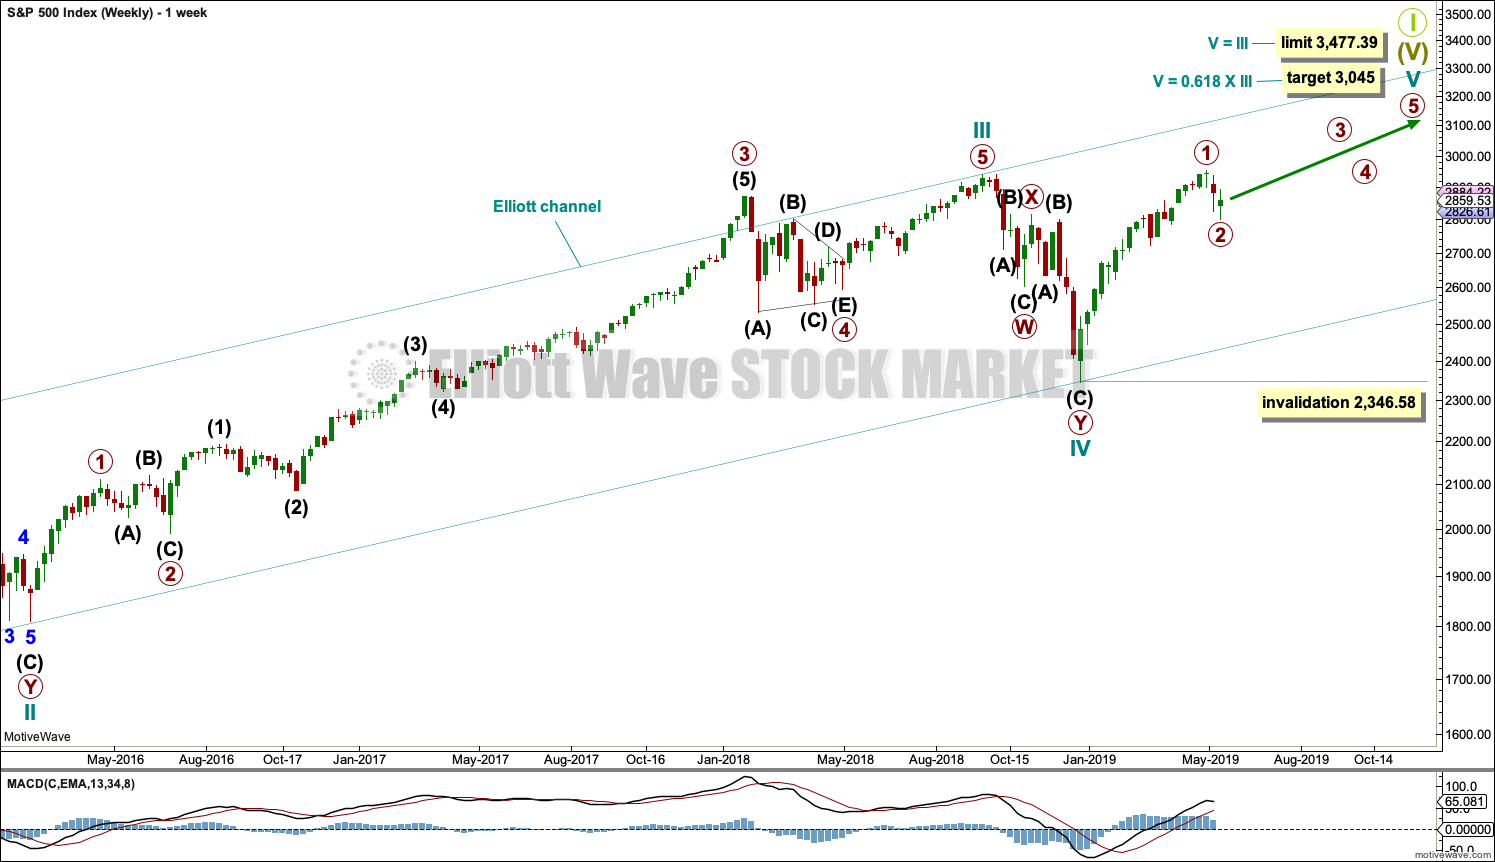
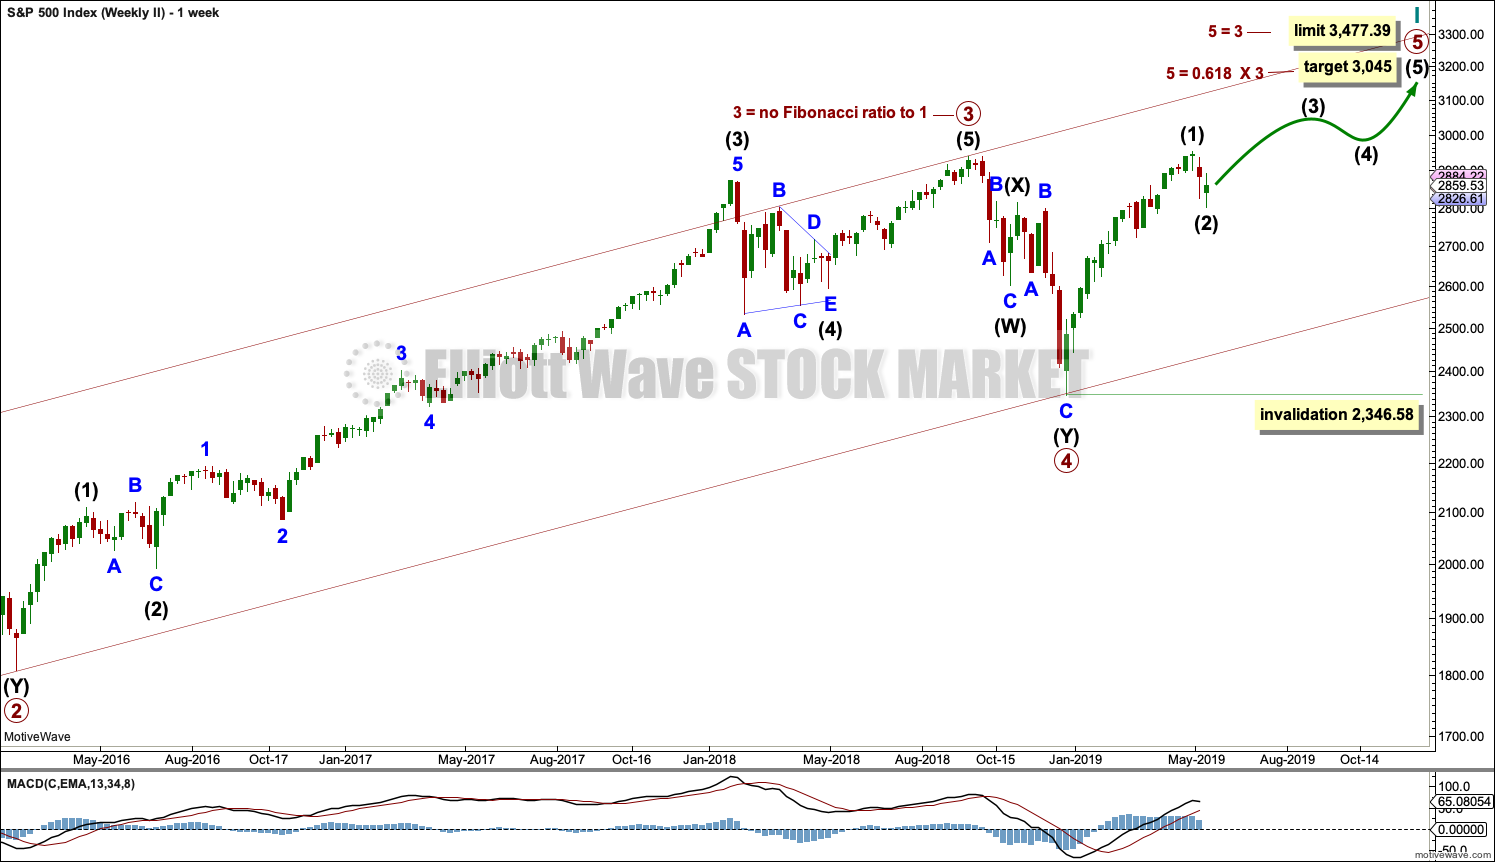
The basic Elliott wave structure consists of a five wave structure up followed by a three wave structure down (for a bull market). This wave count sees the bull market beginning in March 2009 as an incomplete five wave impulse and now within the last fifth wave, which is labelled cycle wave V. This impulse is best viewed on monthly charts. The weekly chart focusses on the end of it.
Elliott wave is fractal. This fifth wave labelled cycle wave V may end a larger fifth wave labelled Super Cycle wave (V), which may end a larger first wave labelled Grand Super Cycle wave I.
The teal Elliott channel is drawn using Elliott’s first technique about the impulse of Super Cycle wave (V). Draw the first trend line from the end of cycle wave I (off to the left of the chart, the weekly candlestick beginning 30th November 2014) to the end of cycle wave III, then place a parallel copy on the end of cycle wave II. This channel perfectly shows where cycle wave IV ended at support. The strongest portion of cycle wave III, the end of primary wave 3, overshoots the upper edge of the channel. This is a typical look for a third wave and suggests the channel is drawn correctly and the way the impulse is counted is correct.
Within Super Cycle wave (V), cycle wave III is shorter than cycle wave I. A core Elliott wave rule states that a third wave may never be the shortest. For this rule to be met in this instance, cycle wave V may not be longer in length than cycle wave III. This limit is at 3,477.39.
A final target is calculated at cycle degree for the impulse to end.
The structure of cycle wave V is focussed on at the daily chart level below.
Within cycle wave V, primary wave 2 may not move beyond the start of primary wave 1 below 2,346.58.
In historic analysis, two further monthly charts have been published that do not have a limit to upwards movement and are more bullish than this wave count. Members are encouraged to consider those possibilities (links below summary) alongside the wave counts presented on a daily and weekly basis.
DAILY CHART
Click chart to enlarge.
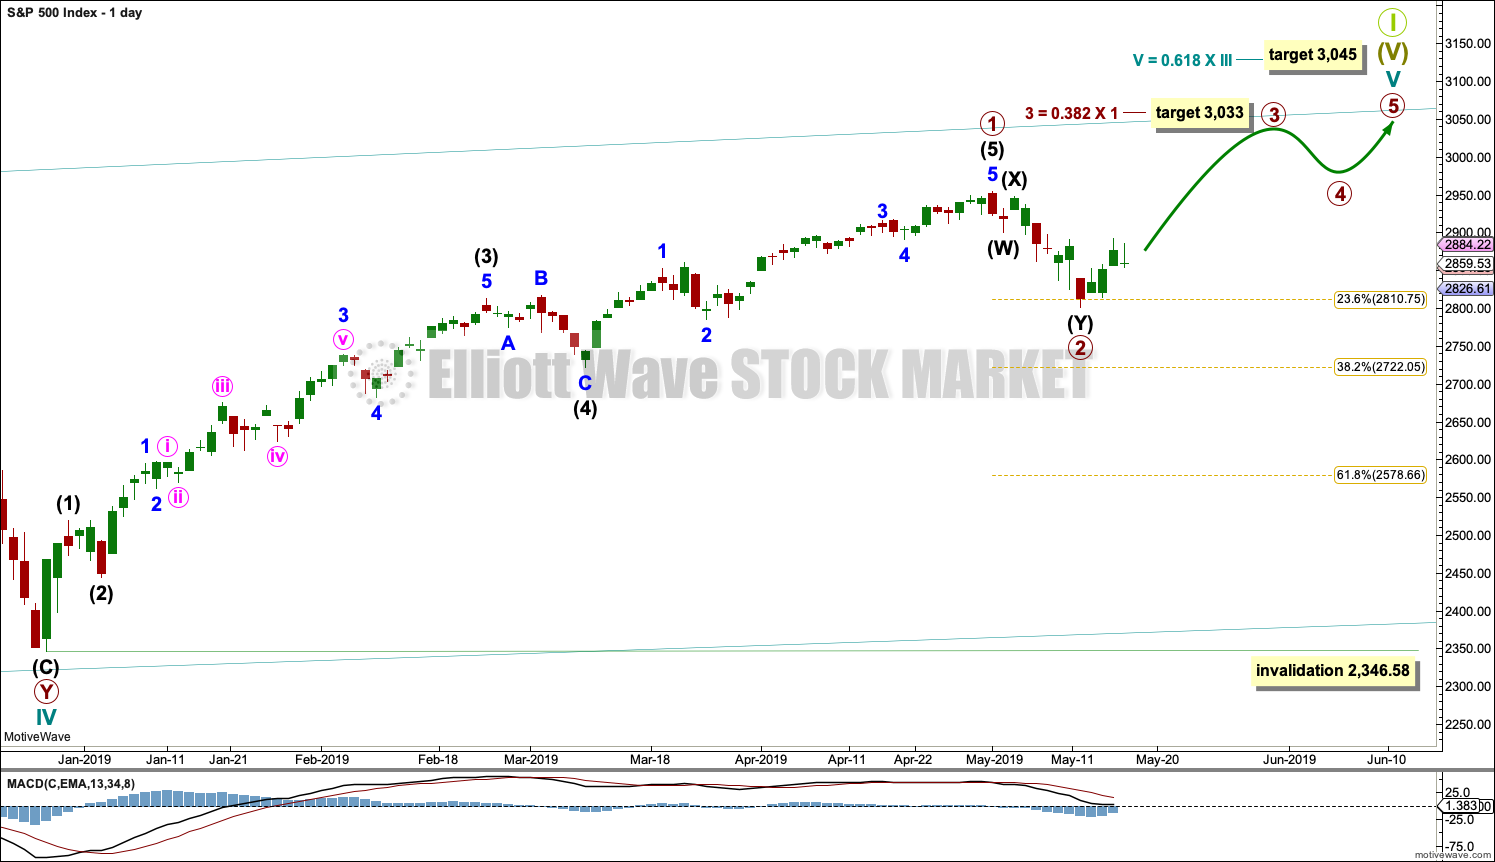
Cycle wave V must subdivide as a five wave motive structure. Within that five wave structure, primary waves 1 and now 2 may be complete. Primary wave 2 may have ended this week as a relatively brief and shallow double zigzag. Double zigzags are fairly common corrective structures.
A new all time high would add confidence to this wave count.
Primary wave 3 must move above the end of primary wave 1. A target is calculated for primary wave 3 that fits with the higher target for cycle wave V to end.
When primary wave 3 is over, then primary wave 4 may be a shallow sideways consolidation that may not move into primary wave 1 price territory below 2,954.13.
Thereafter, primary wave 5 should move above the end of primary wave 3 to avoid a truncation.
At the end of this week, it remains possible that primary wave 2 may not be over and may continue lower. Primary wave 2 may not move beyond the start of primary wave 1 below 2,346.58.
Three hourly charts are published at the end of this week.
FIRST HOURLY CHART
Click chart to enlarge.
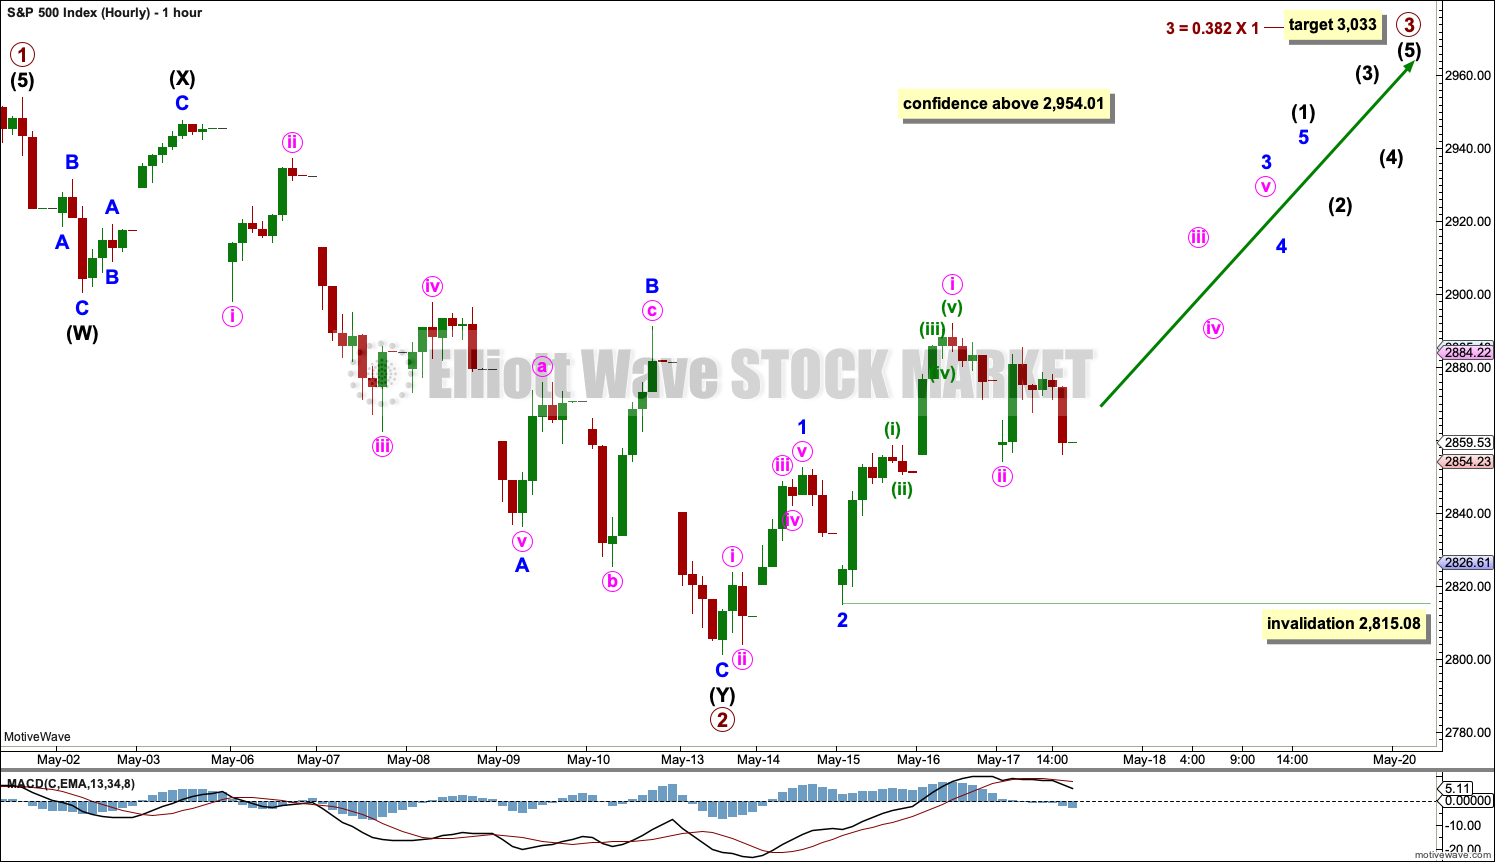
This first hourly chart has some support from Lowry’s data and bullish divergence at the weekly chart level between price and both of the AD line and inverted VIX.
It is possible that primary wave 2 is over as a double zigzag.
If primary wave 3 has begun, then within it intermediate wave (1) may be incomplete. Intermediate wave (1) must subdivide as a five wave motive structure. Within intermediate wave (1), minor waves 1 and 2 may be complete.
Minor wave 3 may only subdivide as a five wave impulse, and within it minute wave ii may not move beyond the start of minute wave i below 2,815.08.
During this bull run, which began in December 2018, we have been surprised by brief and shallow corrections. I do not want us to be surprised again.
SECOND HOURLY CHART
Click chart to enlarge.
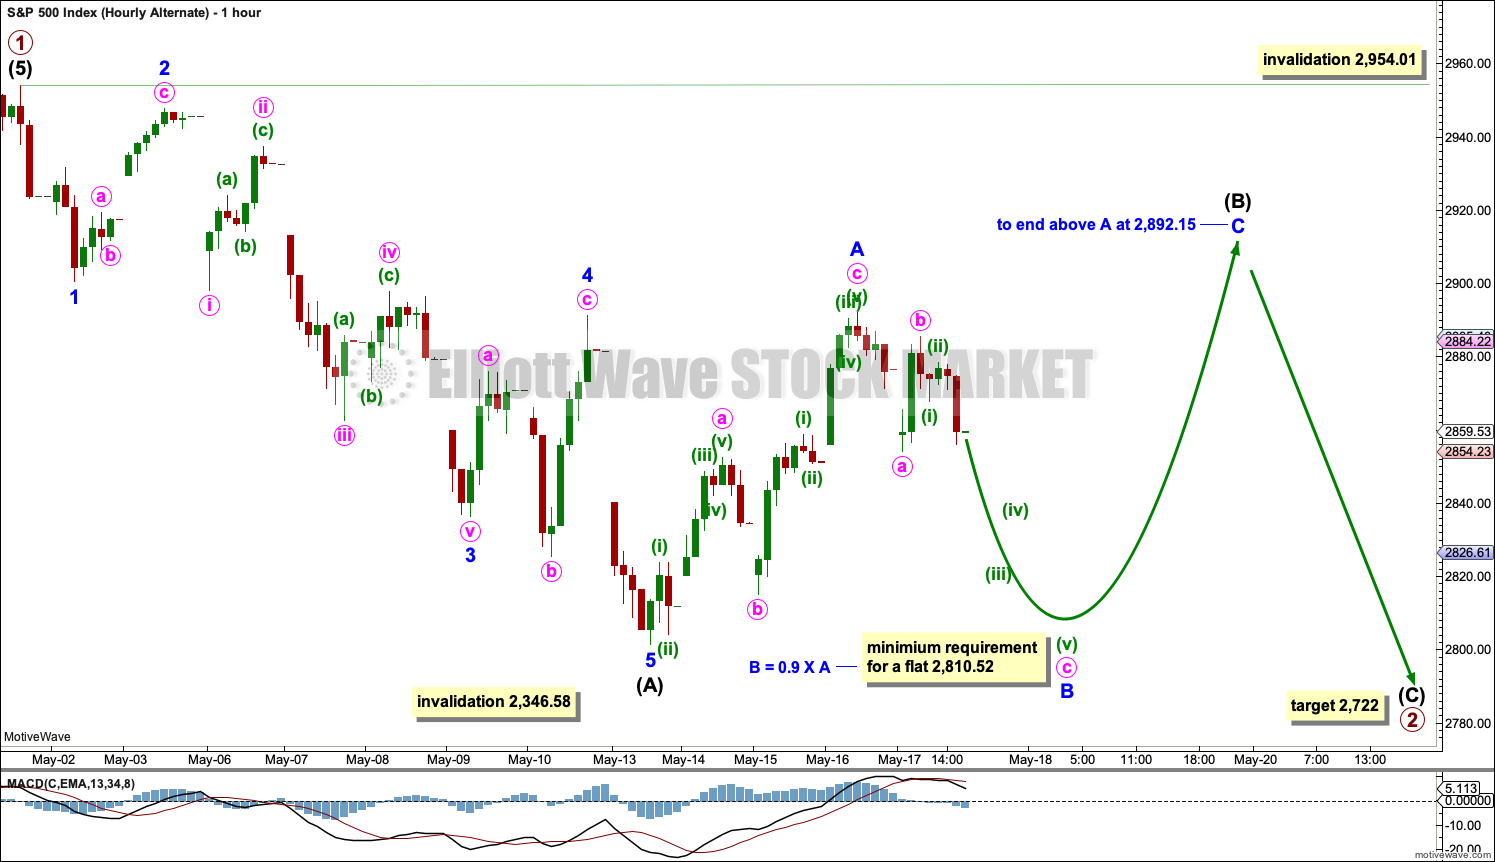
It remains possible that primary wave 2 is incomplete and may be a longer lasting and deeper zigzag. This would have better proportion on the daily and weekly chart.
Intermediate wave (A) subdivides well as a five wave impulse. Intermediate wave (B) may be an incomplete flat correction (these are very common structures for B waves).
This wave count allows for sideways movement for another week to three before a final wave down to complete the pullback labelled primary wave 2.
Intermediate wave (B) may not move beyond the start of intermediate wave (A) above 2,954.01.
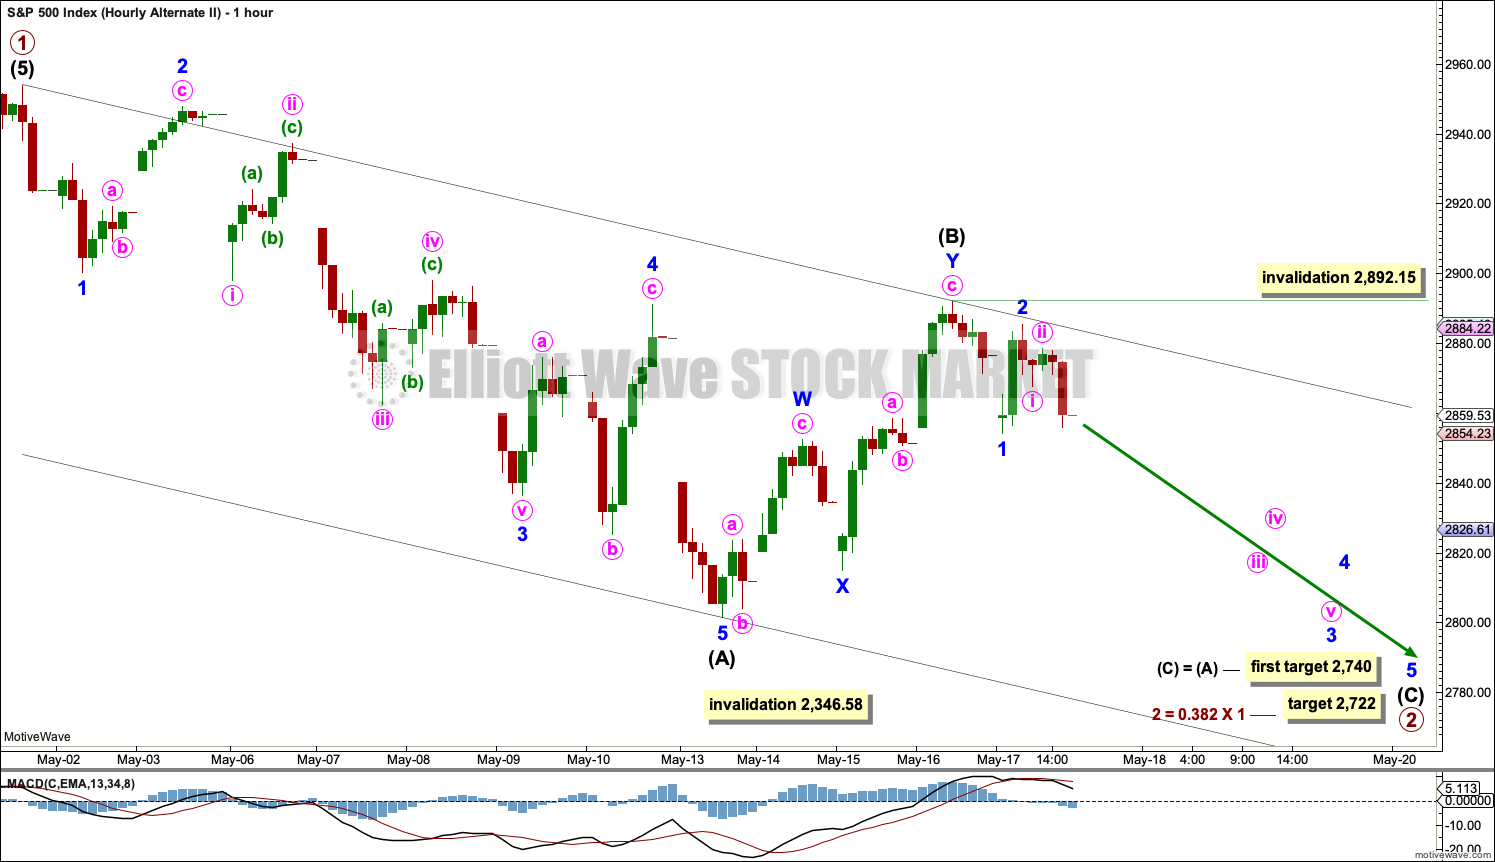
THIRD HOURLY CHART
Click chart to enlarge.
It is also possible that primary wave 2 is an incomplete zigzag, and within it intermediate wave (B) is complete. This wave count expects downwards movement next week to complete intermediate wave (C) and in turn complete the zigzag of primary wave 2.
Within intermediate wave (C), minor wave 2 may not move beyond the start of minor wave 1 above 2,892.15.
SECOND WAVE COUNT
WEEKLY CHART
Click chart to enlarge.
This weekly chart is identical to the first weekly chart, with the sole exception being the degree of labelling.
This weekly chart moves the degree of labelling for the impulse beginning in March 2009 all down one degree. This difference is best viewed on monthly charts.
The impulse is still viewed as nearing an end; a fifth wave is still seen as needing to complete higher. This wave count labels it primary wave 5.
TECHNICAL ANALYSIS
WEEKLY CHART
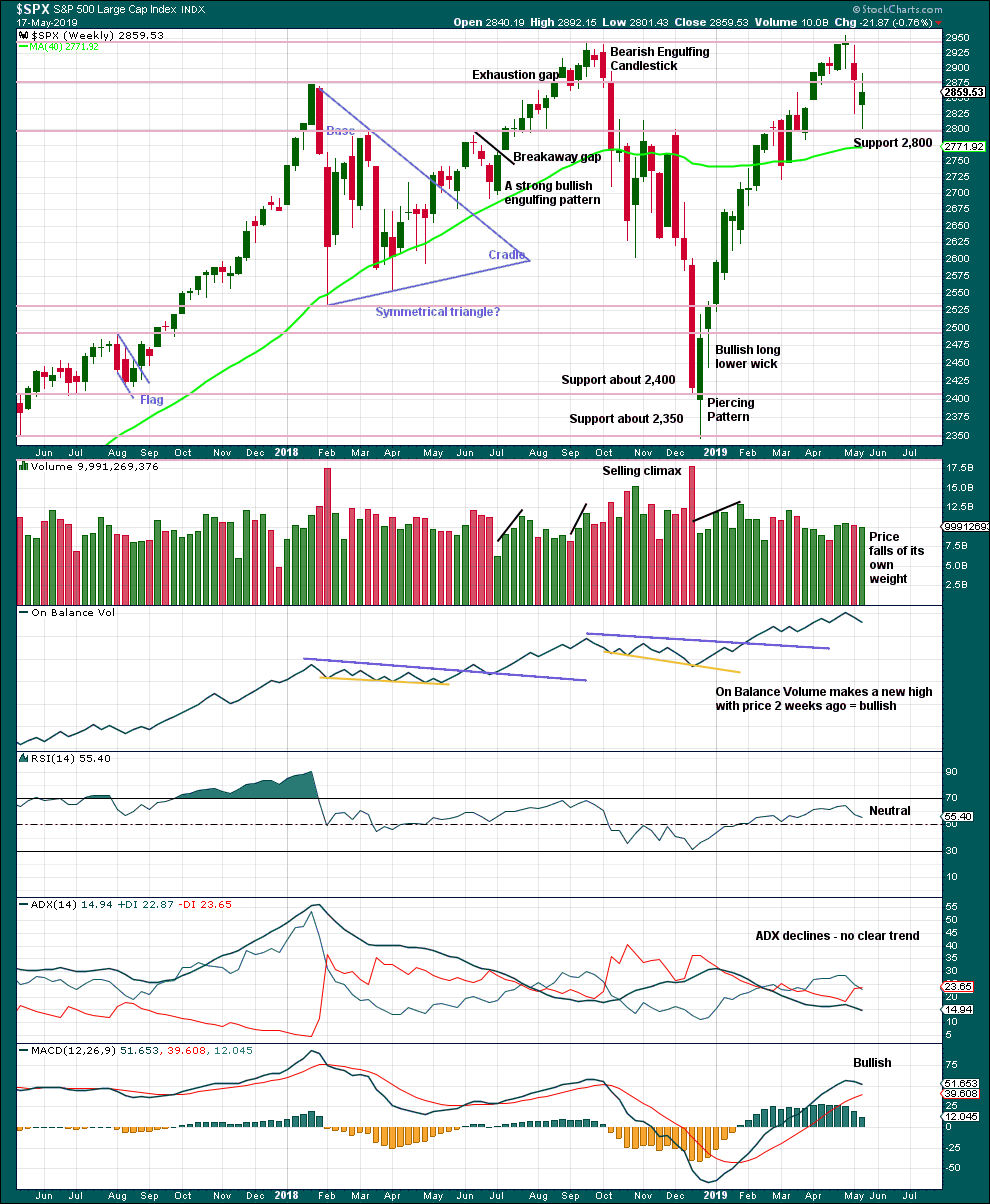
Click chart to enlarge. Chart courtesy of et=”_blank”>StockCharts.com.
This week looks like a spinning top, although the real body may be too large for a typical spinning top. This puts the trend towards neutral. Support about 2,800 is strong and has so far held this week.
There is an upwards trend from the low in December 2018, a series of higher highs and higher lows with a new all time high on the 30th of April 2019. While the last swing low at 2,785.02 on the 25th of March remains intact, then this view should remain dominant.
The trend is your friend.
DAILY CHART
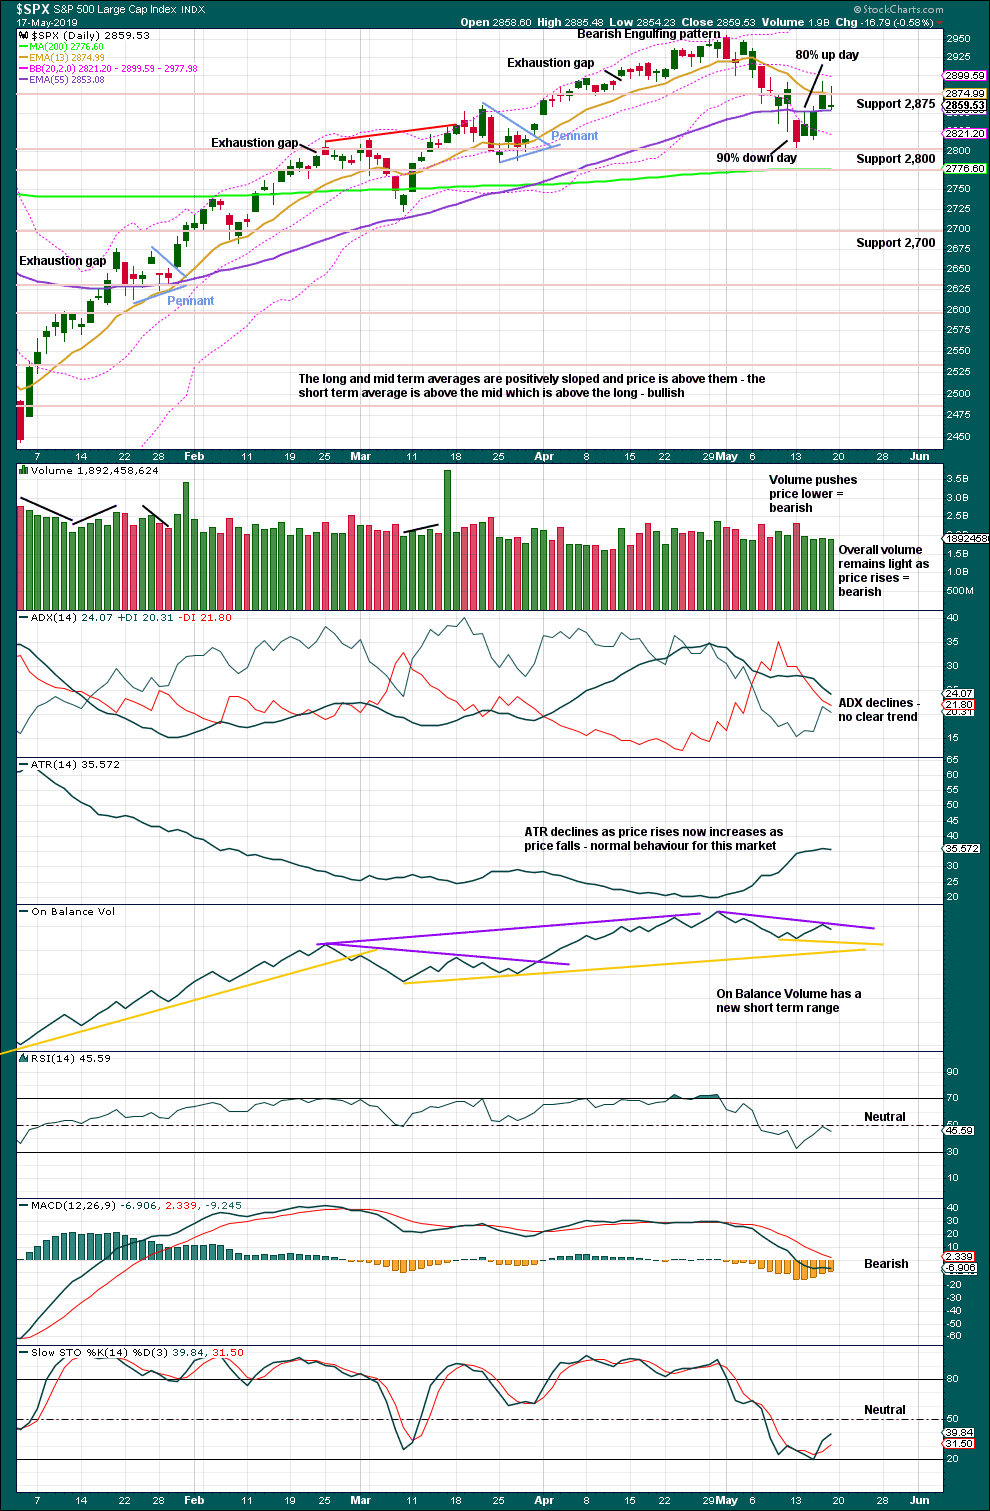
Click chart to enlarge. Chart courtesy of StockCharts.com.
A 90% downwards day at or immediately prior a low followed immediately afterwards by a 90% upwards day is a strong indication of a low in place. The indication is weaker in this case, but the movement is also weaker. The 80% upwards day of the 14th of May shows an almost 180 degree shift in sentiment after the 90% downwards day immediately prior. This is a pattern seen at minor lows.
The dominant trend is up. Pullbacks in an upwards trend should be used as opportunities to join the trend.
It has been noted before that this market has been rising with light and declining volume at all time frames now for years. A lack of support from volume for upwards movement in the last few sessions is not of a concern in current market conditions.
Watch On Balance Volume carefully next week. A breakout would provide a weak signal that may add a little confidence to the next move from price.
BREADTH – AD LINE
WEEKLY CHART
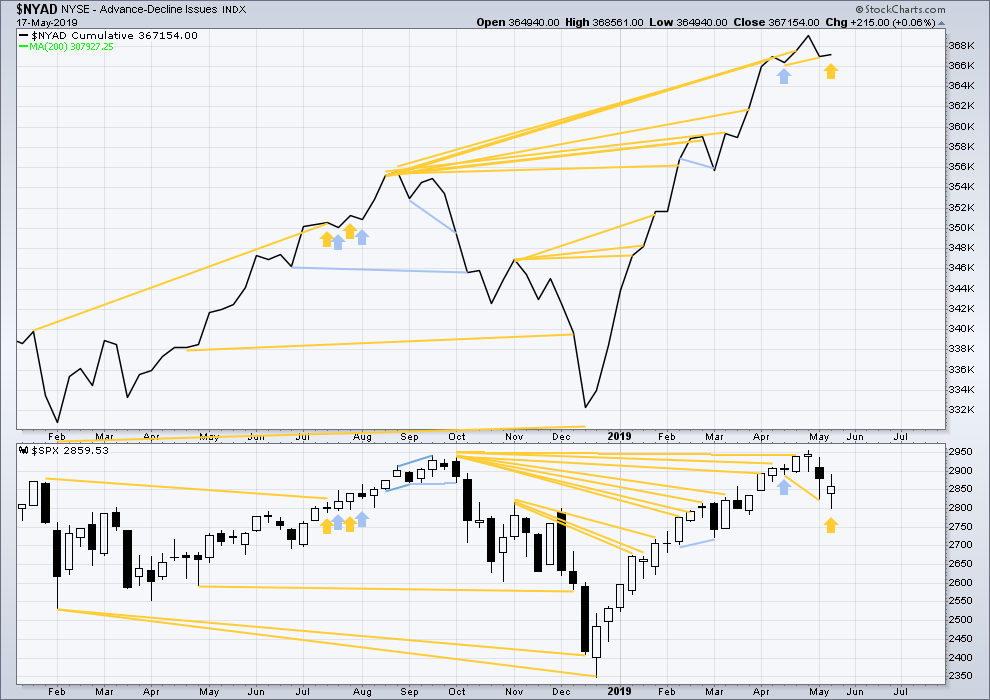
Click chart to enlarge. Chart courtesy of StockCharts.com. So that colour blind members are included, bearish signals
will be noted with blue and bullish signals with yellow.
Every single bear market from the Great Depression and onwards has been preceded by a minimum of 4 months divergence between price and the AD line. With the AD line making a new all time high again last week, the end of this bull market and the start of a new bear market must be a minimum of 4 months away, which is the beginning of September 2019 at this time.
This week price has moved lower with a lower low and a lower high, although the candlestick has closed green. The AD line has moved higher this week. This divergence is bullish and supports the view that a low may now be in place.
This week all of large, mid and small caps have moved lower. None have made new swing lows below the low of the 25th of March. There is no divergence.
DAILY CHART
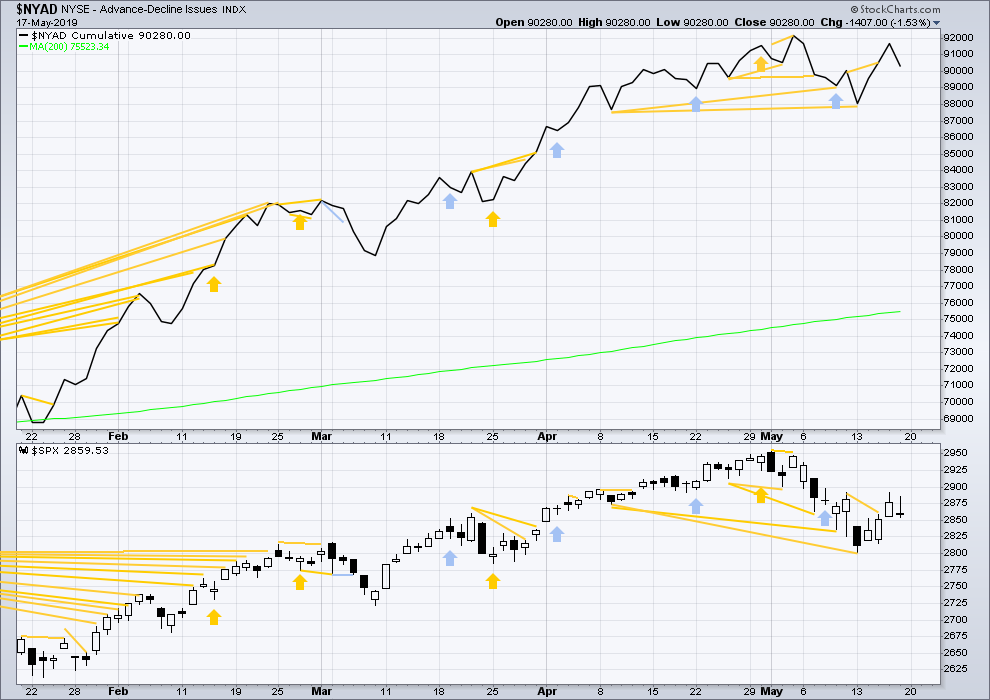
Click chart to enlarge. Chart courtesy of StockCharts.com. So that colour blind members are included, bearish signals
will be noted with blue and bullish signals with yellow.
Breadth should be read as a leading indicator.
Mid-term bullish divergence remains and supports the view here that a low may be in place.
On Friday both price and the AD line moved lower. There is no new short-term divergence.
VOLATILITY – INVERTED VIX CHART
WEEKLY CHART
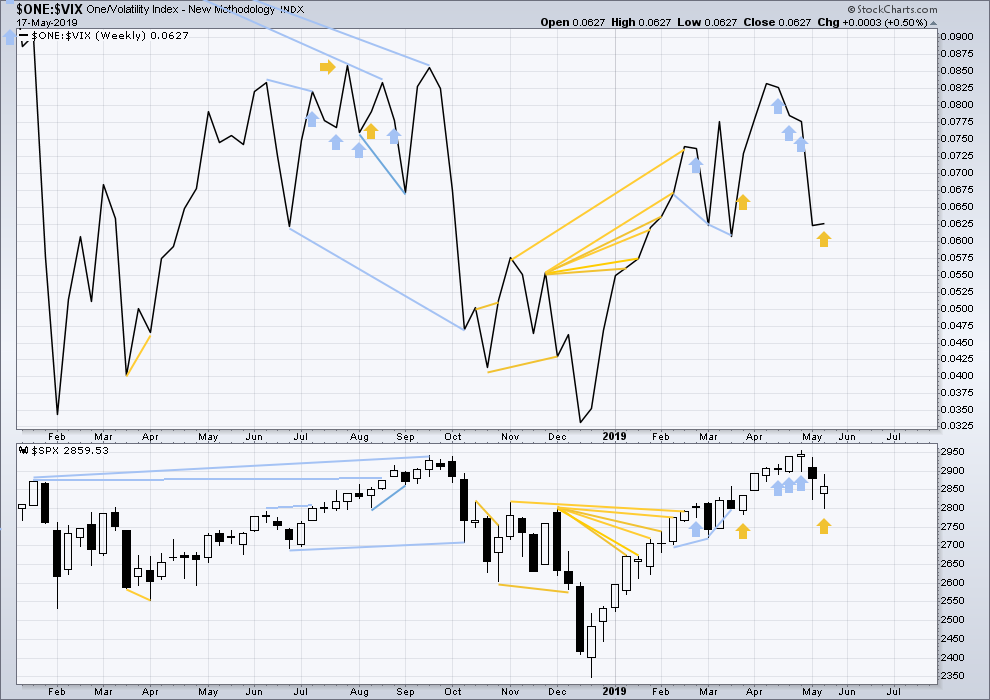
Click chart to enlarge. Chart courtesy of StockCharts.com. So that colour blind members are included, bearish signals
will be noted with blue and bullish signals with yellow.
Three weeks in a row of weekly bearish divergence has now been followed by two reasonable downwards weeks. It may be resolved here, or it may yet be an indication of further downwards movement in price.
This week price moved lower, but the candlestick has closed green. Inverted VIX has moved higher. This divergence is bullish.
DAILY CHART
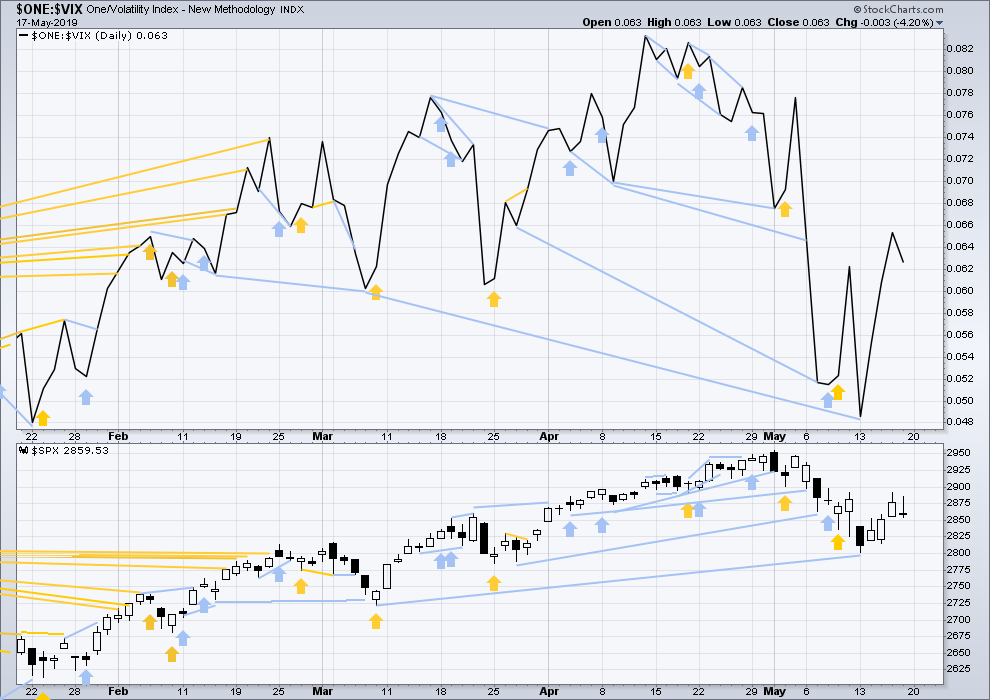
Click chart to enlarge. Chart courtesy of StockCharts.com. So that colour blind members are included, bearish signals
will be noted with blue and bullish signals with yellow.
On Friday both price and inverted VIX have moved lower. There is no new short-term divergence.
DOW THEORY
Dow Theory confirmed a bear market in December 2018. This does not necessarily mean a bear market at Grand Super Cycle degree though; Dow Theory makes no comment on Elliott wave counts. On the 25th of August 2015 Dow Theory also confirmed a bear market. The Elliott wave count sees that as part of cycle wave II. After Dow Theory confirmation of a bear market in August 2015, price went on to make new all time highs and the bull market continued.
DJIA: 23,344.52 – a close on the 19th of December at 23,284.97 confirms a bear market.
DJT: 9,806.79 – price has closed below this point on the 13th of December.
S&P500: 2,532.69 – a close on the 19th of December at 2,506.96 provides support to a bear market conclusion.
Nasdaq: 6,630.67 – a close on the 19th of December at 6,618.86 provides support to a bear market conclusion.
With all the indices moving now higher, Dow Theory would confirm a bull market if the following highs are made:
DJIA: 26,951.81
DJT: 11,623.58
S&P500: 2,940.91 – a new all time high has been made on the 29th of April 2019.
Nasdaq: 8,133.30 – a new high has been made on 24th of April 2019.
Published @ 01:32 a.m. EST on May 18, 2019.
—
Careful risk management protects your trading account(s).
Follow my two Golden Rules:
1. Always trade with stops.
2. Risk only 1-5% of equity on any one trade.
—
New updates to this analysis are in bold.
End of day checking in. Long 400+ mile car ride through beautiful country, all of it until I hit the city metropolitan area. Not my cup of tea.
I’m glad I checked in and read the posts. I learn a lot on this forum. Thanks to all who posted.
First hourly chart updated:
I always feel rather uncomfortable about a wave count when an expected first wave starts to overlap that I have to consider a leading diagonal. Because then they’re almost always invalidated. Leading diagonals are not common. They’re not very rare, I’ve seen and noted a few, but an impulse in wave 1 is much more common by a very wide margin.
That’s happening today with this first wave count.
This movement up from the last low does not now look like the start of a new wave up to new all time highs. I expect this count may be invalidated this week.
Second hourly chart updated:
So far this looks good. A flat for intermediate (B) still fits. Flats in B wave positions are reasonably common.
Third hourly chart updated:
So far so good for this count too. Except the degree of labelling within minor 3 may need to be moved down one degree. Minute i may be incomplete.
For this count for it to have the right look price should now continue to find resistance at the upper edge of the channel.
Hi Lara,
Why (B) has to be a flat.. why can’t it be a zigzag up?? i mean minor B could finish at today’s low and the minor C could go higher by 30 points then the minor A to complete (B) @ 2921.. something like that.. just curious if i am missing something
Thanks
🙂 What you’re missing is the minimum 0.9 retracement requirement of minor B within a flat correction. Today’s low at 2,831.29 does not meet the rule, so minor B needs to move lower.
So to label intermediate (B) as a flat with minor B now complete, violates that Elliott wave rule for a flat.
I strongly dislike the old adage “markets fall of their own weight”. Because it’s not really descriptive of what’s happening.
Better might be “stagnant markets often slowly slip into a sell off”. Like this one may very soon now.
How about “markets can fall due to an absence of buyers”
Friendly, gentle pushback to Kevin… I say markets falling “of their own weight” is a pretty good way to put it.
I put it on the charts because it’s fewer words and space is limited. That’s it really.
Well the market opened too low to take a tactical short, and while I took a tactical long on the bounce off the 62% retrace level, I’ve closed that for tiny profit because the follow through to the upside isn’t there (yet).
I have no clue if this market is going to proceed upward or downward from here, but if pressed I’d say a move back down to the 2800 area is more likely. Strong repeating pattern of pulling up and away from the lower volatility band (purple)…then turning and selling off to new lows. We’ll see if that repeats here or not. I’m caressing my bullets, waiting…lol!!
Premarket is fluctuating a bit. But it seems like we may open about -20 points on SPX. In my opinion, this favors the bearish second and third hourly wave counts. If we break below 2800, then I would strongly favor the third hourly count.
The McClellan Oscillator ($NYMO) last week Thursday just barely cleared zero from below. Friday it promptly fell to -25. This is a sign that the rally is weak. If today is a strong down day $NYMO will confirm that we are in a “look out below” scenario.
I will be on the road all day today and most likely unable to check in. Have a good day everybody. For those outside the US, next Monday 5/27, the US markets are closed in observation of Memorial Day when we remember and honor all the men and women who have given their lives in defense of our freedom. During WWII alone that was over 400,000 men.
My father saw extensive combat in the invasion of the Phillippines in early ’45, was in the one week battle for Nichols Field, then participated in the quite famous (taught now in the US War College) raid 30 miles behind enemy lines to free 1200 civilians at the Los Banos prison camp (he parachuted into that one), and then went on to be on the very first truck off the boat rolling into Yokohama in the occupation of Japan. 182nd Airborne. They’d train by running for MILES with 120lb packs. “We weren’t heroes, we just had a job to do and we did it.” For the most part…wouldn’t talk about it. “Lots of bad dreams.” One of his comrades went into battle with an axe, “war crazed” is how my father described him. Very nasty business. The usage of the nuclear bombs on Japan is highly controversial for many. The 182nd was busy preparing to parachute into the middle of Honshu Japan as part of the planned invasion. Estimates were that they would suffer 90% casualties. Suffice to say it was happy day for him when he heard about the sudden Japanese surrender. Overall…I’m glad he made it through! But war is hell, that’s for certain.
I am considering breakout (several hours) swing trades (short or long) out of the big gray price box surrounding recent highs and lows, and then counter direction trades on turns off the gray price boxes at support/resistance areas overlapped with key fibo’s. The danger here is of course the risk of whippage. The upside is the potential of a high moment break out move right past these target turn levels for a substantially longer run.
This hourly /ES chart including overnight data shows a possible B wave down triangle cited by Paul, with the potential C wave heading up to the 62% or the (boxed) 78% zone. That structure completing and then a spike up in price should be a solid set up, should it play out.
By the way, those other guys primary WC calls the Dec low – May high a completed 2, and this action the 1-2 of a motive wave down. That all of an E wave down of a massive expanding triangle. But they also have a longer term bearish model that calls the 2 up incomplete with the downward movement here an X wave, and a Y up to above the May 1 high coming next.
I view Lara’s much more bullish big picture call here as the high probability model, particularly considering the in depth Ciovacco analysis comparing this set up to historical analogues. Those scream bull market, and support Lara’s bullish big picture technicals. Gotta support your EW count with technicals.
Here’s perhaps a better view at the daily chart level. /ES with extended hours data.
Lara,
As you have noted before, corrective waves can be monsters based upon the number of outcomes. Here is my question:
In looking at your 2nd hourly chart, is it possible that minor B of intermediate B could be developing into a triangle with minute a,b,c done and d,e to come. I realize that this would probably mean that minor c would be relatively short versus minor a?
Thanks
It most certainly could do. It can be any EW corrective structure it likes. And B waves within B waves? The absolute worst.
But here’s an important thing to keep in mind for this one: if intermediate (B) has begun with a three for minor A, that means intermediate (B) must be a flat. Which means minor B within it must retrace a minimum 0.9 of minor A. The retracement has to be at the terminus of minor B.
So if minor B is a triangle, then it would most likely be a running triangle, because the end of minute e within the triangle has to be at or below 2,810.52.
I have seen B waves within flats subdivide as triangles, but it’s uncommon.
Now of course, we also need to consider what if intermediate (B) is a combination. Re-label minor A as minor W, a zigzag, now for minor X down, then minor Y sideways as a flat (or unlikely, a triangle).
Goodness. I hope that’s clear!
Hi all,
is it relevant to see a hidden divergence (RSI 14 daily) in the hypothetical low of May 13? Is it often the case between primary two and local lows of primary 1?
Have a great week-end!
It could be. It would be bullish in this case; RSI has made a lower low but price has made a higher low.
I have found though that it seems to be more reliable to consider divergence between price and RSI when RSI reaches extreme, and then shows single or double divergence between price with regular (not hidden) divergence, and the divergence is shorter in term.
Thanks!
Bam!
Wow! Really fast Curtis, Somehow it doesn’t seem fair! Daw gone it!
Rigged!! Rigged I say!!! The publication algorithm is biased against us Rodney…
Considering my publication algorithm… which really has more to do with how much coffee I consume, how much sleep I’ve had, and how difficult or easy the wave counts are…. and how fast Cesar proofs my work….