
Downwards movement is now too large to look right for the main daily chart. The bigger picture remains the same.
Summary: A pullback is now expected to continue for another one to very few weeks. The first target is at 2,722 and thereafter at 2,579. The low of December 2018 is expected to remain intact, and this pullback is expected to be followed by a strong third wave up to new all time highs.
The biggest picture, Grand Super Cycle analysis, is here.
Monthly charts were last published here, with video here. There are two further alternate monthly charts here, with video here.
ELLIOTT WAVE COUNTS
The two Elliott wave counts below will be labelled First and Second rather than main and alternate as they may be about of even probability. When the fifth wave currently unfolding on weekly charts may be complete, then these two wave counts will diverge on the severity of the expected following bear market. To see an illustration of this future divergence monthly charts should be viewed.
FIRST WAVE COUNT
WEEKLY CHART
Click chart to enlarge.
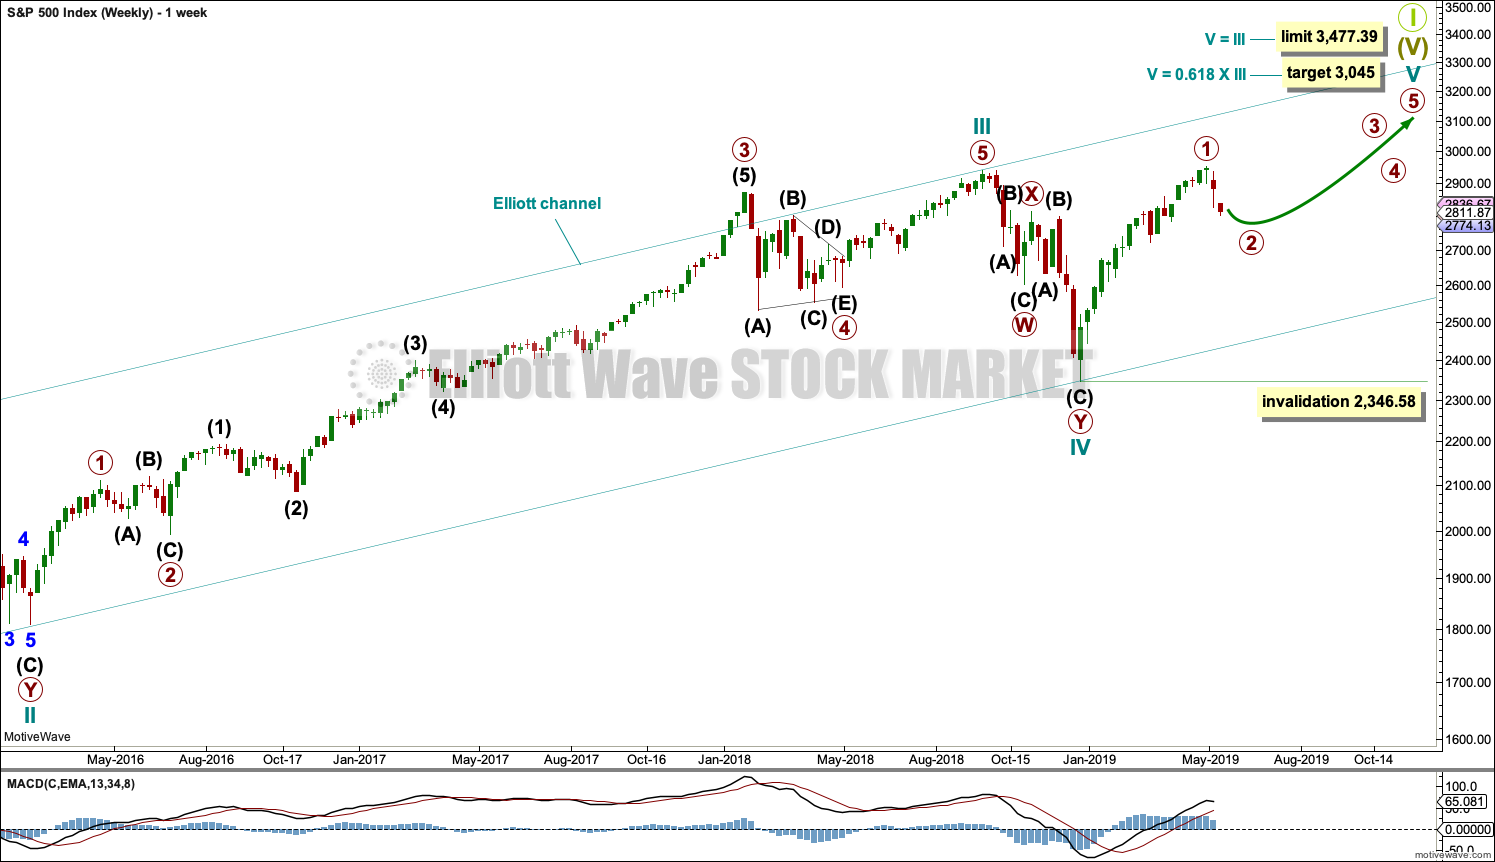
The basic Elliott wave structure consists of a five wave structure up followed by a three wave structure down (for a bull market). This wave count sees the bull market beginning in March 2009 as an incomplete five wave impulse and now within the last fifth wave, which is labelled cycle wave V. This impulse is best viewed on monthly charts. The weekly chart focusses on the end of it.
Elliott wave is fractal. This fifth wave labelled cycle wave V may end a larger fifth wave labelled Super Cycle wave (V), which may end a larger first wave labelled Grand Super Cycle wave I.
The teal Elliott channel is drawn using Elliott’s first technique about the impulse of Super Cycle wave (V). Draw the first trend line from the end of cycle wave I (off to the left of the chart, the weekly candlestick beginning 30th November 2014) to the end of cycle wave III, then place a parallel copy on the end of cycle wave II. This channel perfectly shows where cycle wave IV ended at support. The strongest portion of cycle wave III, the end of primary wave 3, overshoots the upper edge of the channel. This is a typical look for a third wave and suggests the channel is drawn correctly and the way the impulse is counted is correct.
Within Super Cycle wave (V), cycle wave III is shorter than cycle wave I. A core Elliott wave rule states that a third wave may never be the shortest. For this rule to be met in this instance, cycle wave V may not be longer in length than cycle wave III. This limit is at 3,477.39. This limit may still apply if the degree of labelling within cycle wave V is changed all down one degree.
A final target is calculated at cycle degree for the impulse to end.
The structure of cycle wave V is focussed on at the daily chart level below.
Within cycle wave V, primary wave 2 may not move beyond the start of primary wave 1 below 2,346.58.
DAILY CHART
Click chart to enlarge.
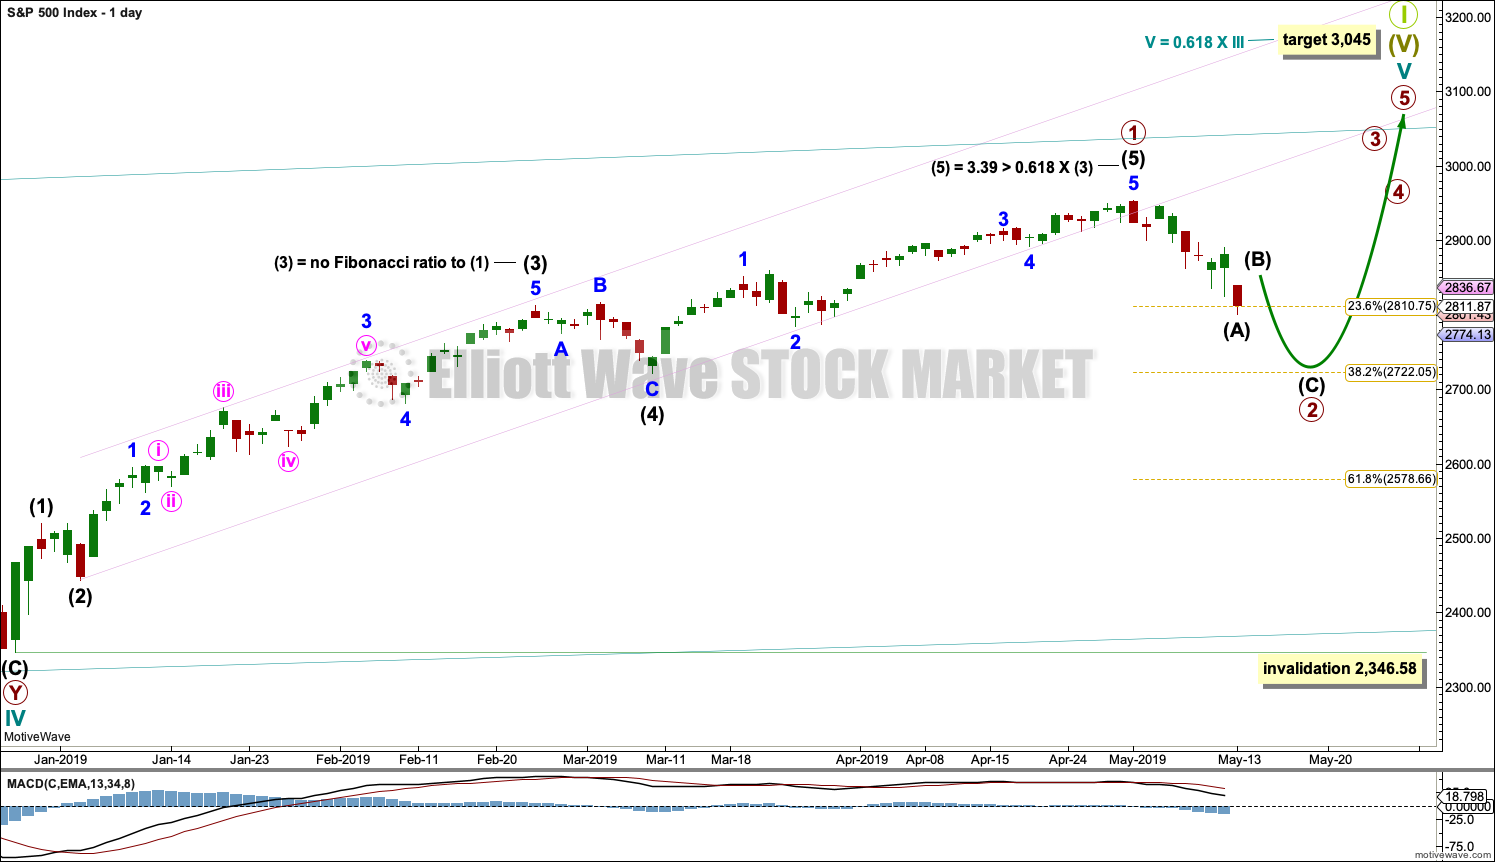
Cycle wave V must subdivide as a five wave motive structure. The depth of the current pullback now looks like it should be labelled as the same degree as the prior large wave up from the low on the 26th of December 2018. The upwards wave will be labelled primary wave 1 and the current pullback will now be labelled primary wave 2.
A best fit channel drawn about primary wave 1, to contain all of it, has been breached by primary wave 2.
The most likely structures for primary wave 2 would be a single or multiple zigzag. The first target for primary wave 2 is the 0.382 Fibonacci ratio at 2,722. The next target is the 0.618 Fibonacci ratio at 2,579.
HOURLY CHART
Click chart to enlarge.
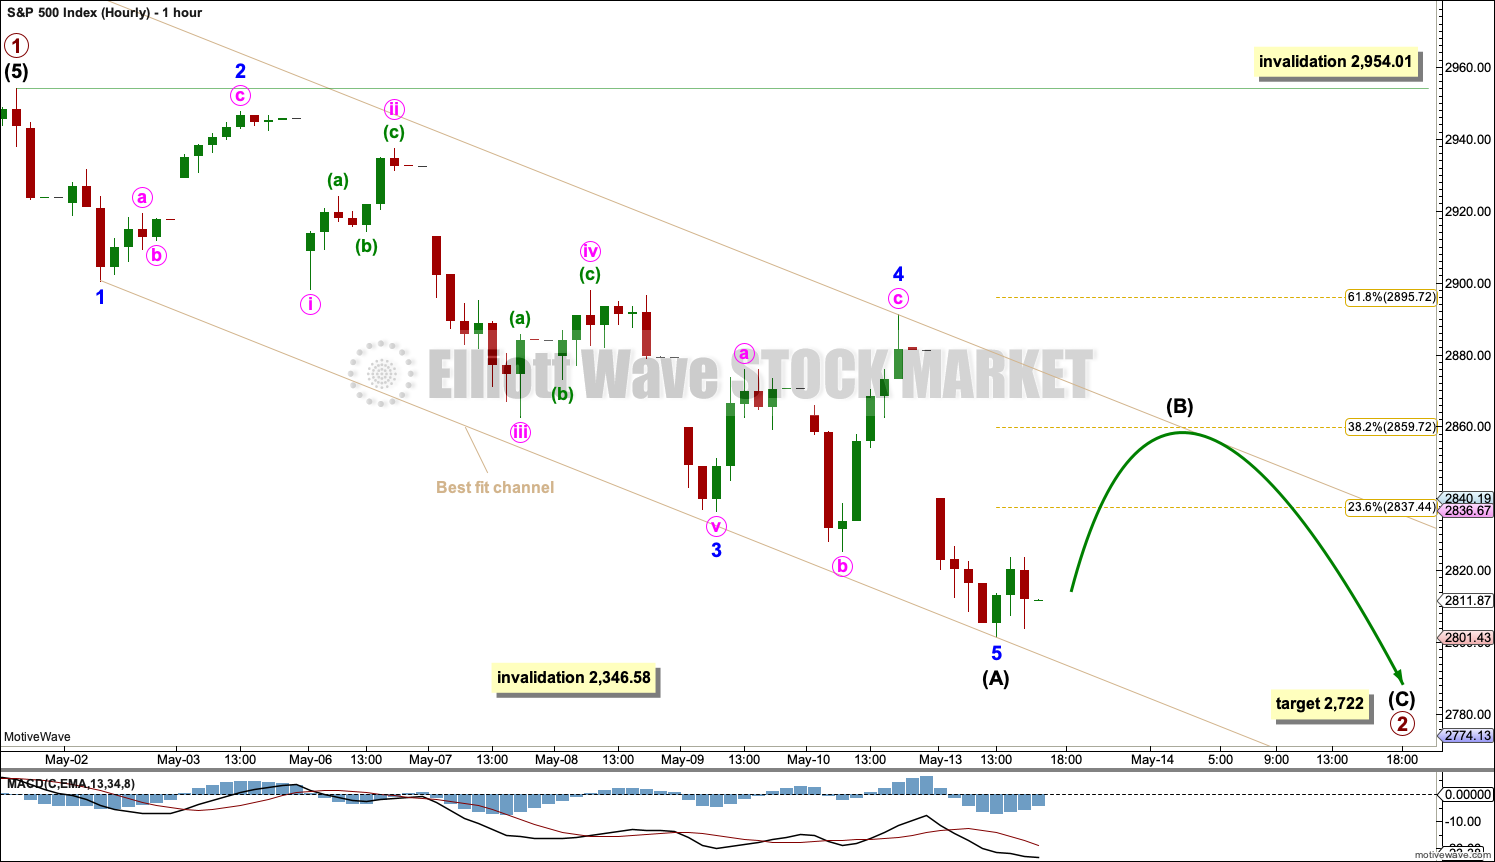
The most likely structures for primary wave 2 are a single or double zigzag. Both would begin with a five wave structure downwards at the hourly chart level. This may now be complete.
A zigzag would subdivide 5-3-5. Intermediate wave (A) may now be a complete five wave structure. Intermediate wave (B) may now unfold. Intermediate wave (B) may not move beyond the start of intermediate wave (A) above 2,954.01.
Intermediate wave (B) may be any one of more than 23 possible Elliott wave corrective structures. It may be a quick sharp single or double zigzag, or it may be a more time consuming complicated consolidation subdividing as a triangle, combination or flat. Focus over the next few sessions will be on identifying when intermediate wave (B) may be complete and intermediate wave (C) downwards may then begin.
It is possible that intermediate wave (B) may find resistance at the upper edge of the best fit channel.
SECOND WAVE COUNT
WEEKLY CHART
Click chart to enlarge.
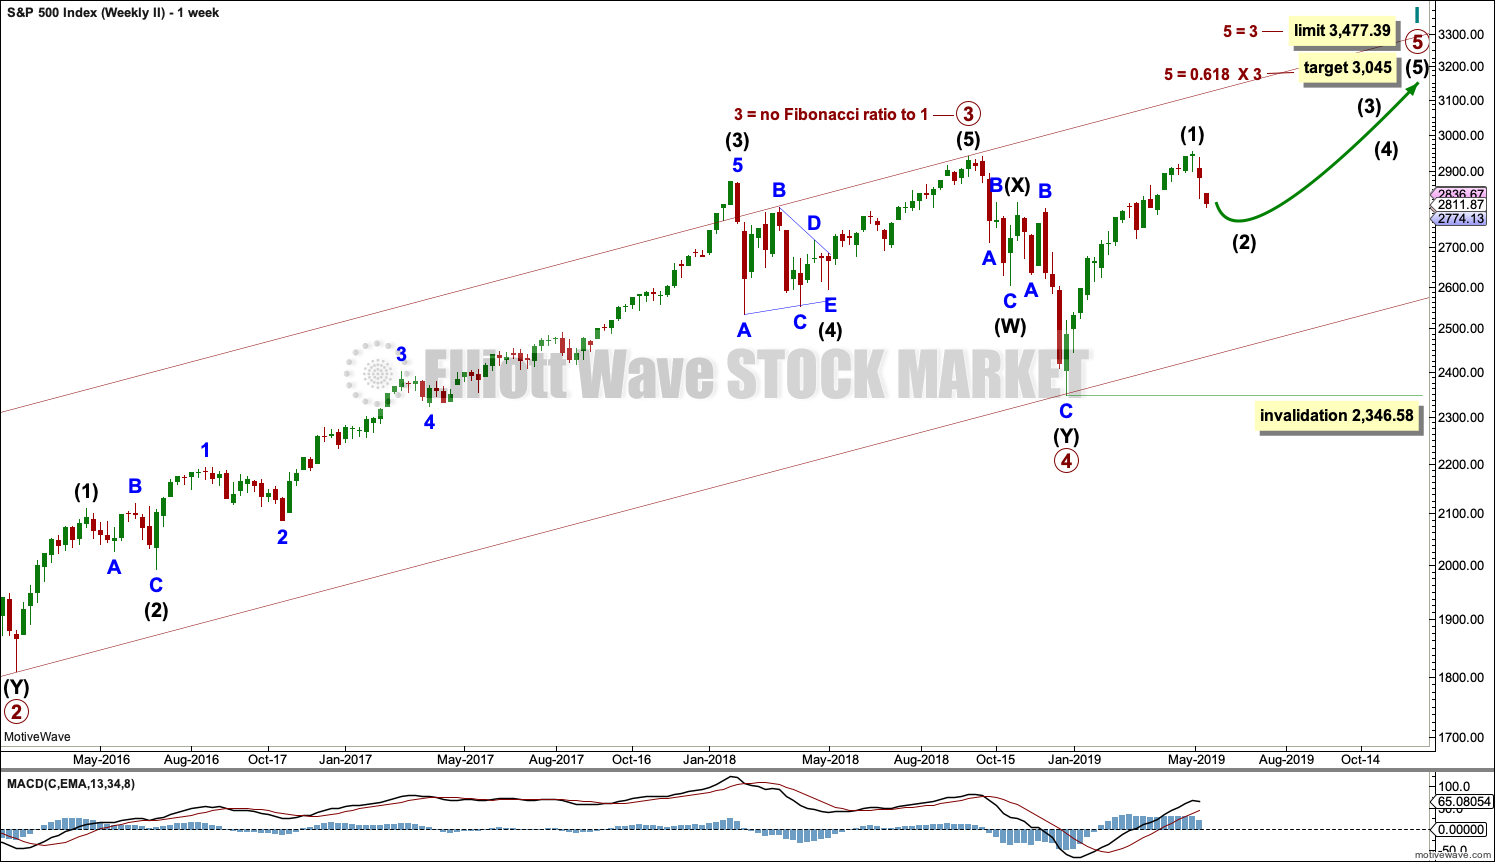
This weekly chart is identical to the first weekly chart, with the sole exception being the degree of labelling.
This weekly chart moves the degree of labelling for the impulse beginning in March 2009 all down one degree. This difference is best viewed on monthly charts.
The impulse is still viewed as nearing an end; a fifth wave is still seen as needing to complete higher. This wave count labels it primary wave 5.
TECHNICAL ANALYSIS
WEEKLY CHART
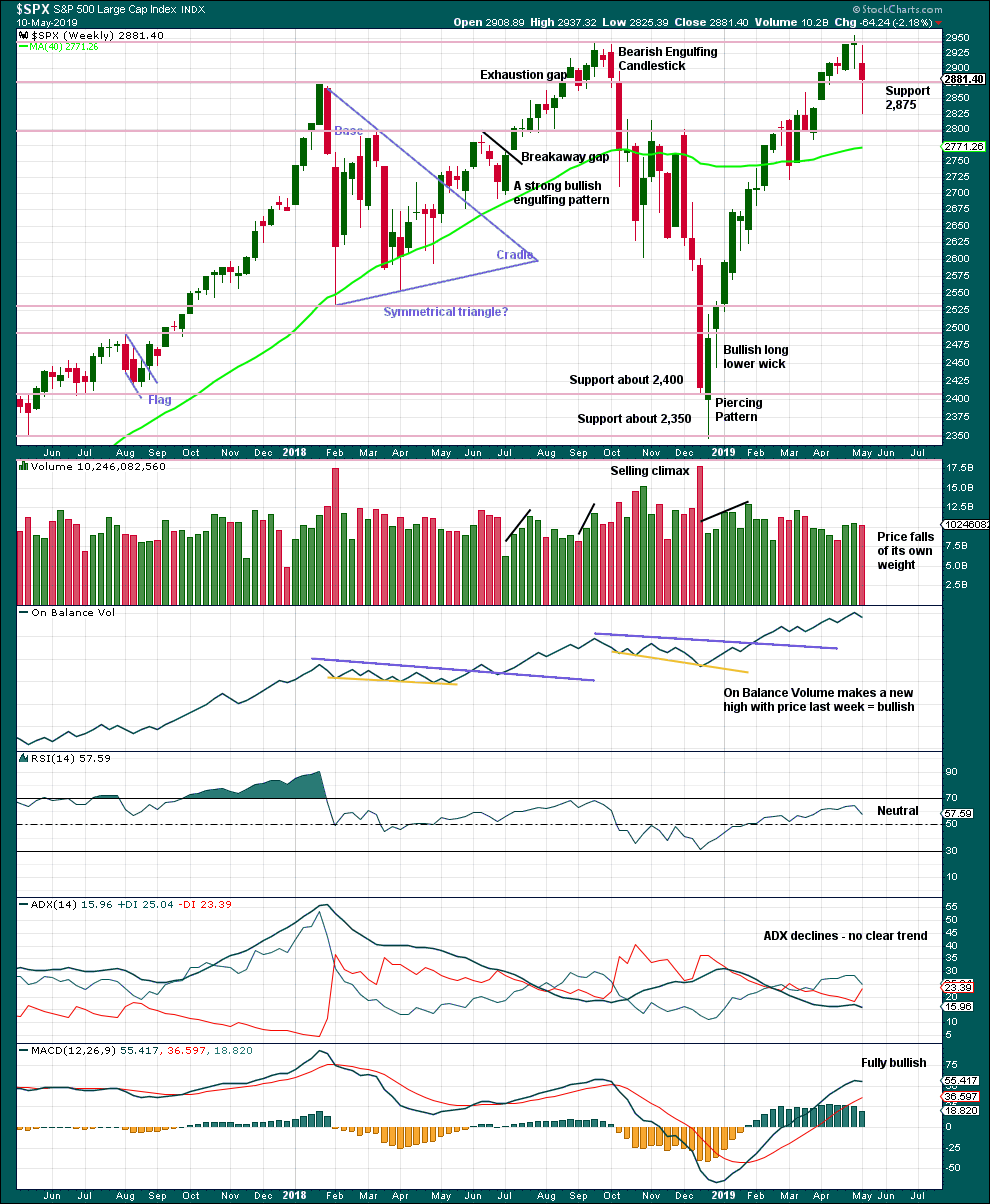
Click chart to enlarge. Chart courtesy of et=”_blank”>StockCharts.com.
The longer lower wick last week is bullish, but the reasonable length of the upper wick reduces the bullishness here.
DAILY CHART
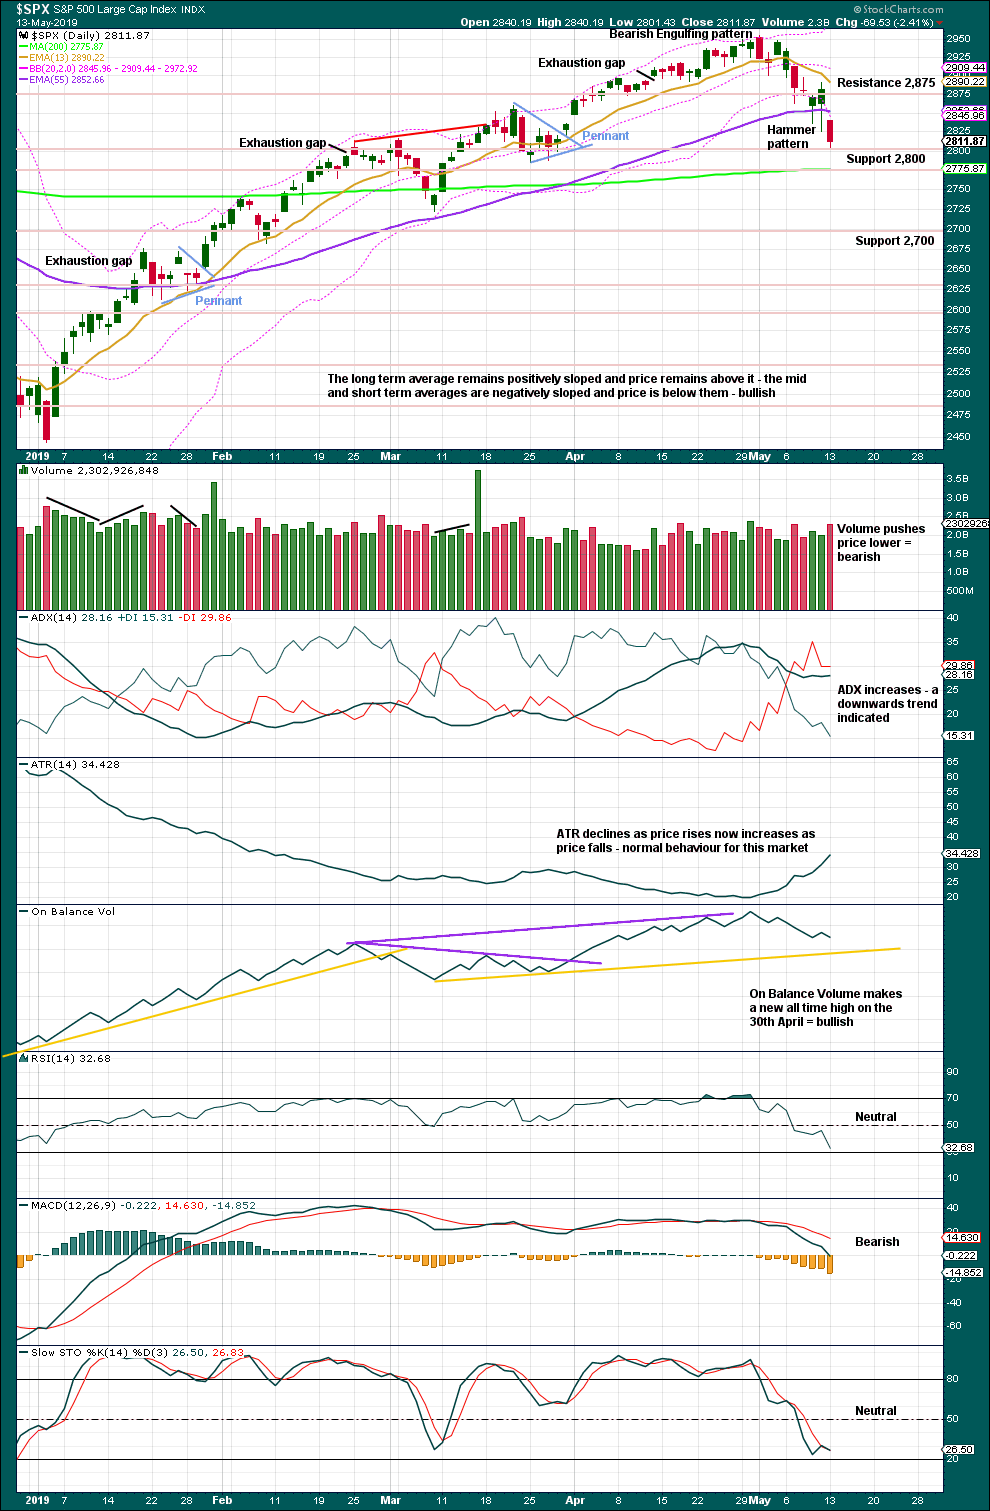
Click chart to enlarge. Chart courtesy of StockCharts.com.
A Hammer candlestick coming after a short fall in price is a bullish reversal pattern. However, there has been no bullish reversal. The candlestick pattern has failed to indicate a trend change in this instance.
Today volume suggests the pullback is not over.
BREADTH – AD LINE
WEEKLY CHART
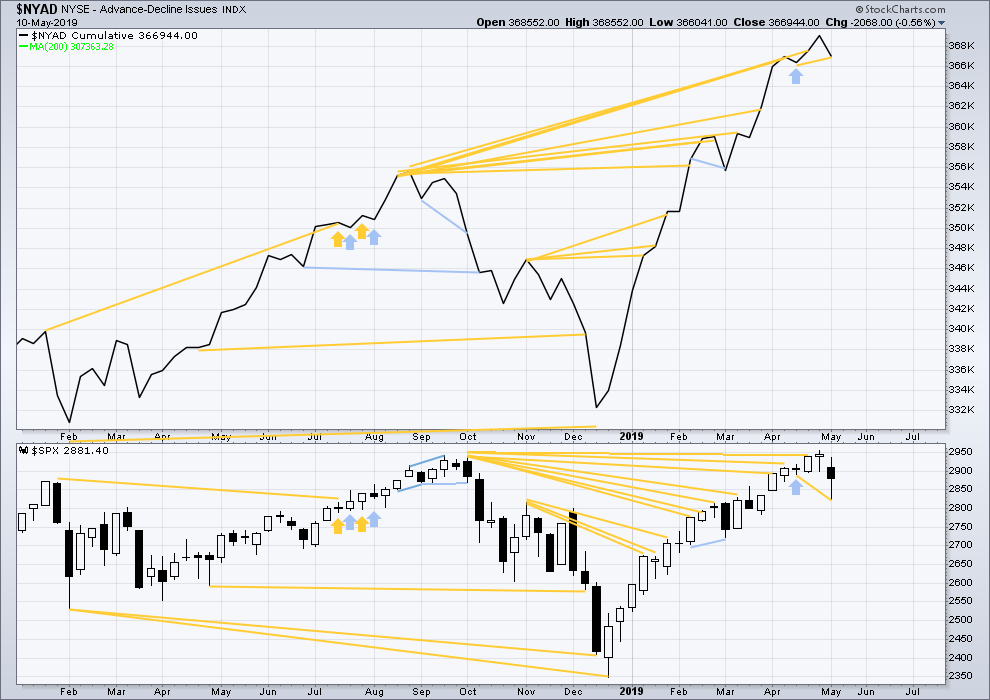
Click chart to enlarge. Chart courtesy of StockCharts.com. So that colour blind members are included, bearish signals
will be noted with blue and bullish signals with yellow.
Every single bear market from the Great Depression and onwards has been preceded by a minimum of 4 months divergence between price and the AD line. With the AD line making a new all time high again last week, the end of this bull market and the start of a new bear market must be a minimum of 4 months away, which is the beginning of September 2019 at this time.
Last week price has made a new low below the low three weeks prior, but the AD line has not. Downwards movement in price this week has not come with a corresponding decline in market breadth. This divergence is bullish for the short term.
Last week all of large, mid and small caps have moved lower. None have made new swing lows below the low of the 25th of March. There is no divergence.
DAILY CHART
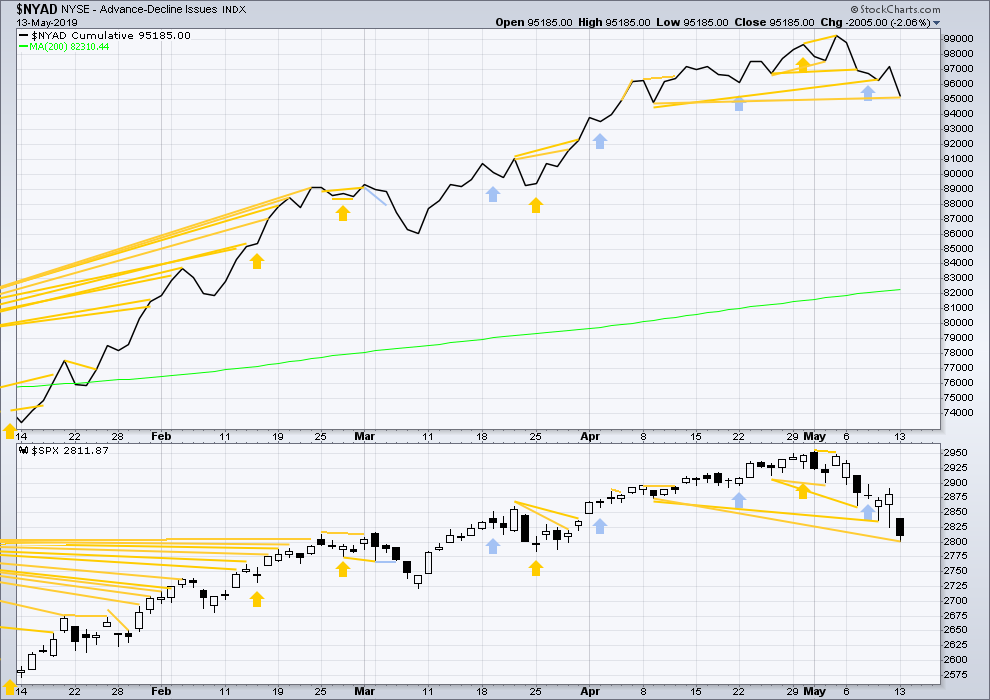
Click chart to enlarge. Chart courtesy of StockCharts.com. So that colour blind members are included, bearish signals
will be noted with blue and bullish signals with yellow.
Breadth should be read as a leading indicator.
Bullish mid-term divergence continues. Today price has made another new low below the low of the 9th of April, but the AD line has not. This supports the view that this pullback is a more short-term counter trend movement within an ongoing bull market.
VOLATILITY – INVERTED VIX CHART
WEEKLY CHART
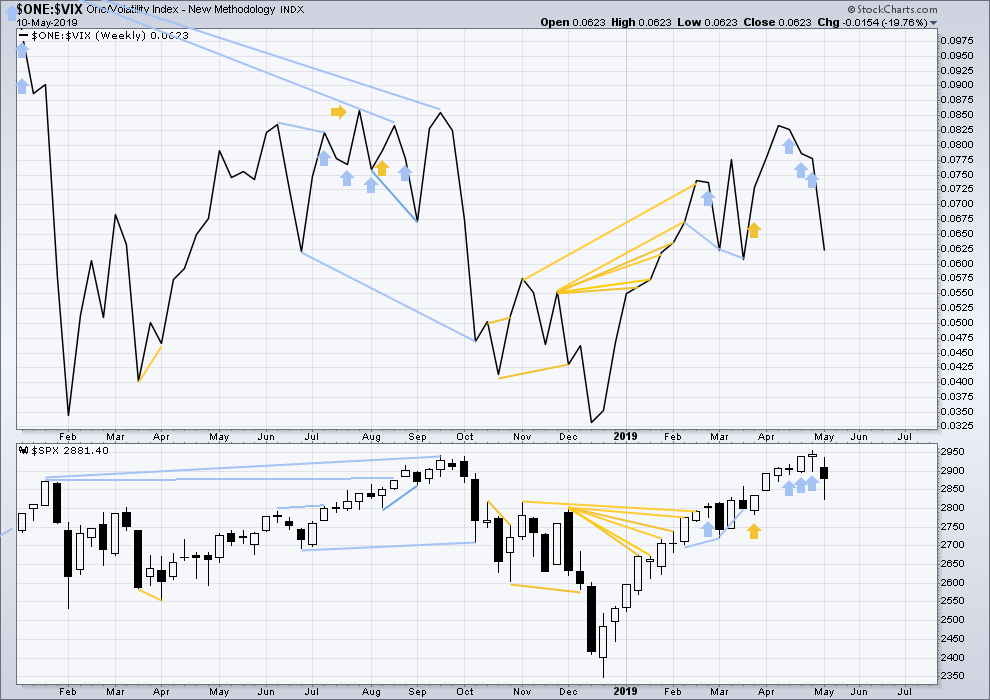
Click chart to enlarge. Chart courtesy of StockCharts.com. So that colour blind members are included, bearish signals
will be noted with blue and bullish signals with yellow.
Three weeks in a row of weekly bearish divergence has now been followed by a reasonable downwards week. It may be resolved here, or it may yet be an indication of further downwards movement in price.
Last week both price and inverted VIX have moved lower. Inverted VIX is not moving any faster than price. There is no short-term divergence.
DAILY CHART
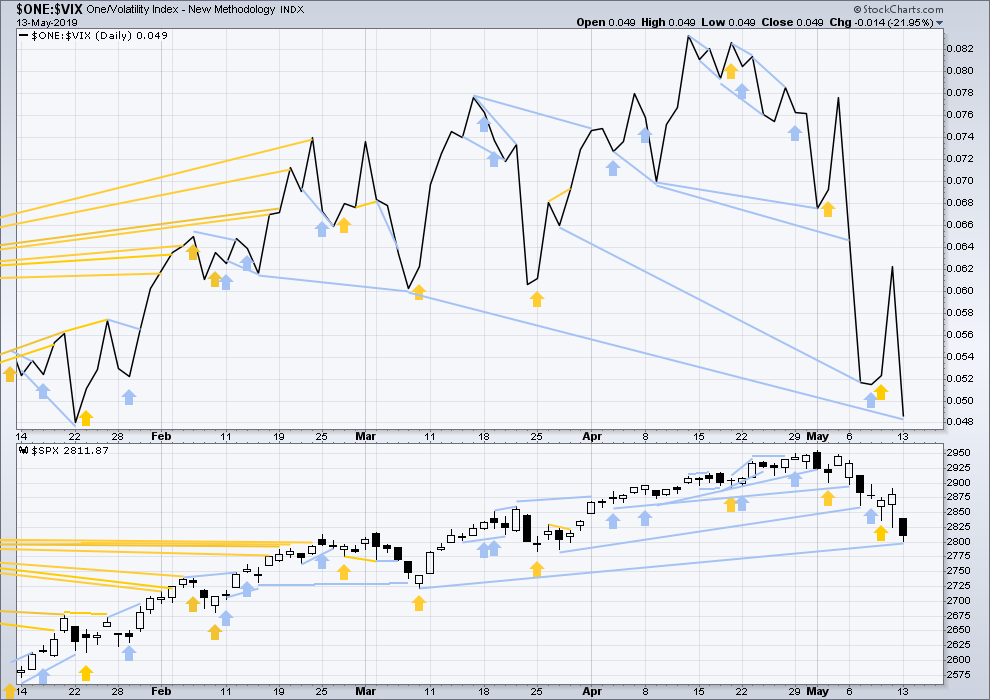
Click chart to enlarge. Chart courtesy of StockCharts.com. So that colour blind members are included, bearish signals
will be noted with blue and bullish signals with yellow.
Today inverted VIX has made a new low below the prior low of the 7th / 8th of March, but price has not. This divergence is bearish for the short to mid term.
DOW THEORY
Dow Theory confirmed a bear market in December 2018. This does not necessarily mean a bear market at Grand Super Cycle degree though; Dow Theory makes no comment on Elliott wave counts. On the 25th of August 2015 Dow Theory also confirmed a bear market. The Elliott wave count sees that as part of cycle wave II. After Dow Theory confirmation of a bear market in August 2015, price went on to make new all time highs and the bull market continued.
DJIA: 23,344.52 – a close on the 19th of December at 23,284.97 confirms a bear market.
DJT: 9,806.79 – price has closed below this point on the 13th of December.
S&P500: 2,532.69 – a close on the 19th of December at 2,506.96 provides support to a bear market conclusion.
Nasdaq: 6,630.67 – a close on the 19th of December at 6,618.86 provides support to a bear market conclusion.
With all the indices moving now higher, Dow Theory would confirm a bull market if the following highs are made:
DJIA: 26,951.81
DJT: 11,623.58
S&P500: 2,940.91 – a new all time high has been made on the 29th of April 2019.
Nasdaq: 8,133.30 – a new high has been made on 24th of April 2019.
Published @ 08:43 p.m. EST.
—
Careful risk management protects your trading account(s).
Follow my two Golden Rules:
1. Always trade with stops.
2. Risk only 1-5% of equity on any one trade.
—
New updates to this analysis are in bold.
Sorry for my tardiness this morning everybody.
Updated hourly chart:
So far it looks like a small five up within intermediate (B), so I’ll label that minor A.
Intermediate (B) may break out of the channel that contained intermediate (A).
And the B wave has to show up on the daily charts as well, so expecting the high either Fri or early Mon….
This B wave has hit one symmetry level, the size of the May 2-3 low to high. There is a larger up move as well (friday’s reversal), but almost to the cent, this market is flashing “turn” after hitting the smaller move size. SPX loves symmetry…
It maybe a false turn, but it’s a higher potential spot than otherwise because of that symmetry, IMO.
TY Rodney, think i’ll do the same
You’re most welcome. I have not yet pulled the trigger however. I am hoping for SPX to continue a bit higher towards the end of the day. If that happens, I will close out my longs at the end of the day.
Intermediate B is expected to be a 3 wave move in a 5-3-5. We may have seen the high in the first of those three waves today.
With the change in intermediate trend, I am looking to sell my long positions (for a profit) on this Intermediate B wave to be redeployed at the completion of Intermediate C and Primary 2. This may occur today. We are approaching 2860 for a 38.2% retrace of Intermediate A which may be the high for Intermediate B. It may go higher but the intermediate trend is now down so I am being prudent to take my profits and run. It will be nice to be sitting on hands for a while.
Have a good one all.
I need Verne to chime in with “Buy some puts!” …
I am considering a short term short position. I want to see how this Intermediate B wave progresses though. Like Kevin mentioned it can go quite a bit higher from here. In fact, the invalidation is way up at a new ATH. It can also morph into a much more time consuming pattern as well. So I am going to give it a few days. If I miss it, so be it. But I don’t like trading during B waves for a very good reason. For me at least, it proves difficult to be profitable and one must remain constantly monitoring the trade. Now a C wave down, that is a different matter.
Just look at VIX, Peter.
I know, that you know what that is…! 😉
How high is the B wave going? 2900 and a 61.8% right there and three different hourly swing highs right there too…I’m guessing right around 2900 myself. Not today of course. But it could fail at the 38% at 2861 or the 50% at 2880, as well.
Numero Uno