
Price closed back within the channel and remains above the invalidation point.
Summary: The upwards trend may now resume.
The final target remains the same at 3,045. A new limit for this fifth wave to end is now at 3,057.25.
The biggest picture, Grand Super Cycle analysis, is here.
Monthly charts were last published here, with video here. There are two further alternate monthly charts here, with video here.
ELLIOTT WAVE COUNTS
The two Elliott wave counts below will be labelled First and Second rather than main and alternate as they may be about of even probability. When the fifth wave currently unfolding on weekly charts may be complete, then these two wave counts will diverge on the severity of the expected following bear market. To see an illustration of this future divergence monthly charts should be viewed.
FIRST WAVE COUNT
WEEKLY CHART
Click chart to enlarge.
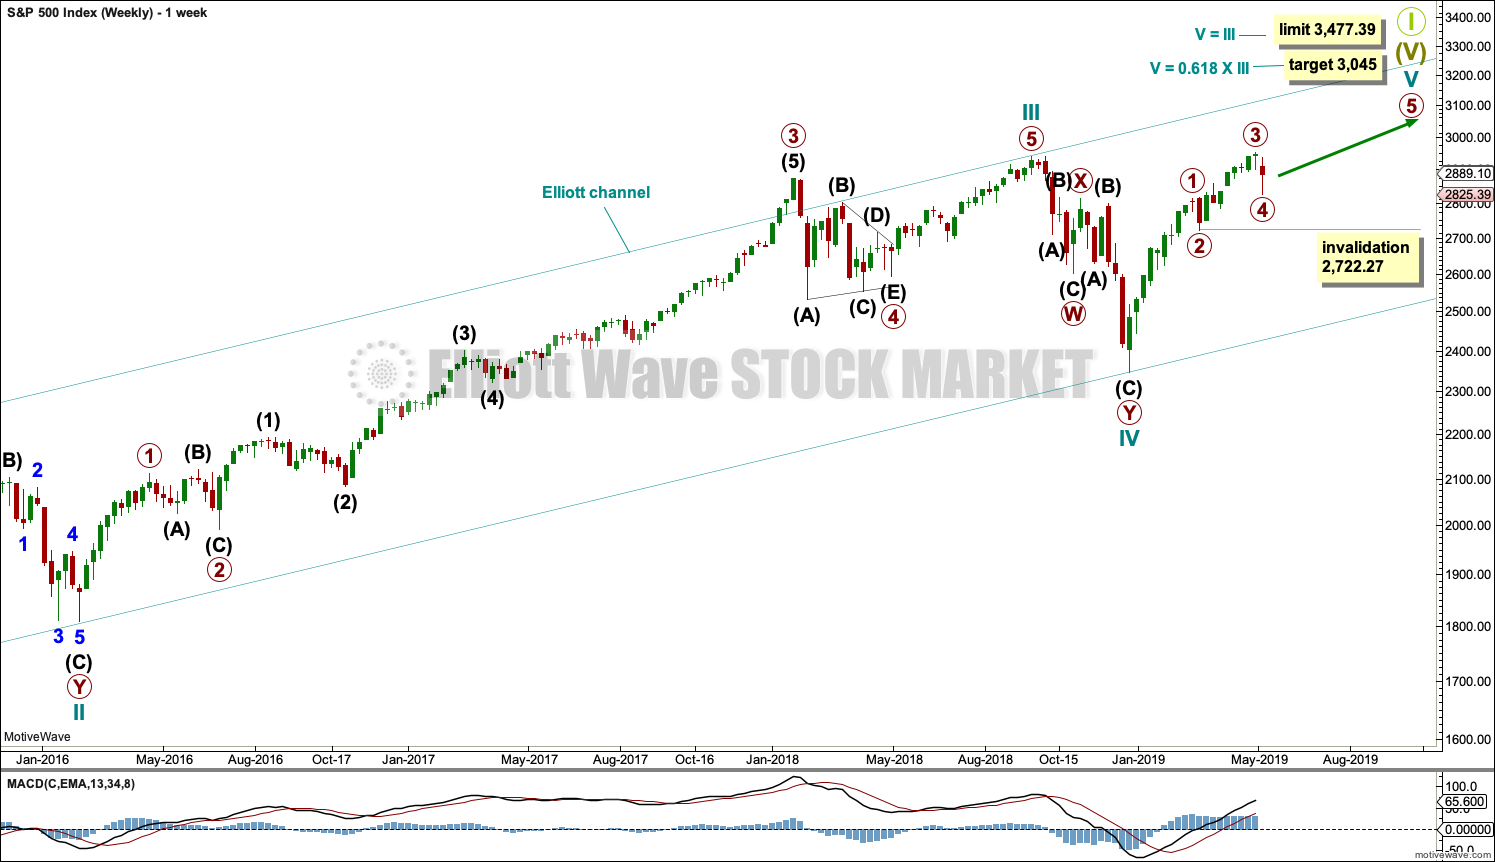
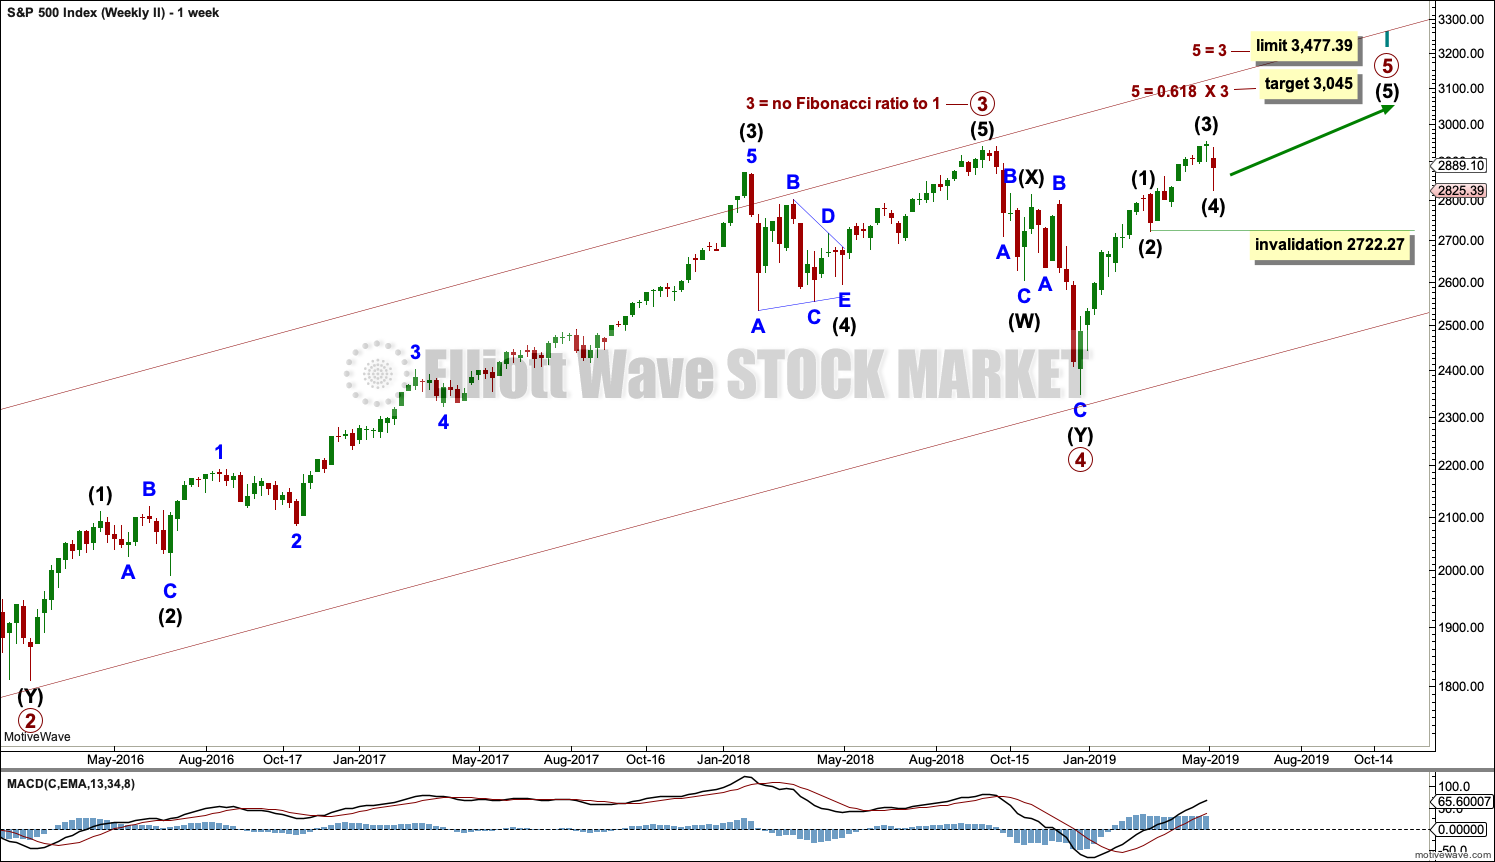
The basic Elliott wave structure consists of a five wave structure up followed by a three wave structure down (for a bull market). This wave count sees the bull market beginning in March 2009 as an incomplete five wave impulse and now within the last fifth wave, which is labelled cycle wave V. This impulse is best viewed on monthly charts. The weekly chart focusses on the end of it.
Elliott wave is fractal. This fifth wave labelled cycle wave V may end a larger fifth wave labelled Super Cycle wave (V), which may end a larger first wave labelled Grand Super Cycle wave I.
The teal Elliott channel is drawn using Elliott’s first technique about the impulse of Super Cycle wave (V). Draw the first trend line from the end of cycle wave I (off to the left of the chart, the weekly candlestick beginning 30th November 2014) to the end of cycle wave III, then place a parallel copy on the end of cycle wave II. This channel perfectly shows where cycle wave IV ended at support. The strongest portion of cycle wave III, the end of primary wave 3, overshoots the upper edge of the channel. This is a typical look for a third wave and suggests the channel is drawn correctly and the way the impulse is counted is correct.
Within Super Cycle wave (V), cycle wave III is shorter than cycle wave I. A core Elliott wave rule states that a third wave may never be the shortest. For this rule to be met in this instance, cycle wave V may not be longer in length than cycle wave III. This limit is at 3,477.39. This limit may still apply if the degree of labelling within cycle wave V is changed all down one degree.
A final target is calculated at cycle degree for the impulse to end.
The structure of cycle wave V is focussed on at the daily chart level below.
Note that at the end of this week the invalidation point on weekly charts is moved down to the start of primary wave 3 to allow for the alternate idea published below on a daily chart.
DAILY CHART
Click chart to enlarge.
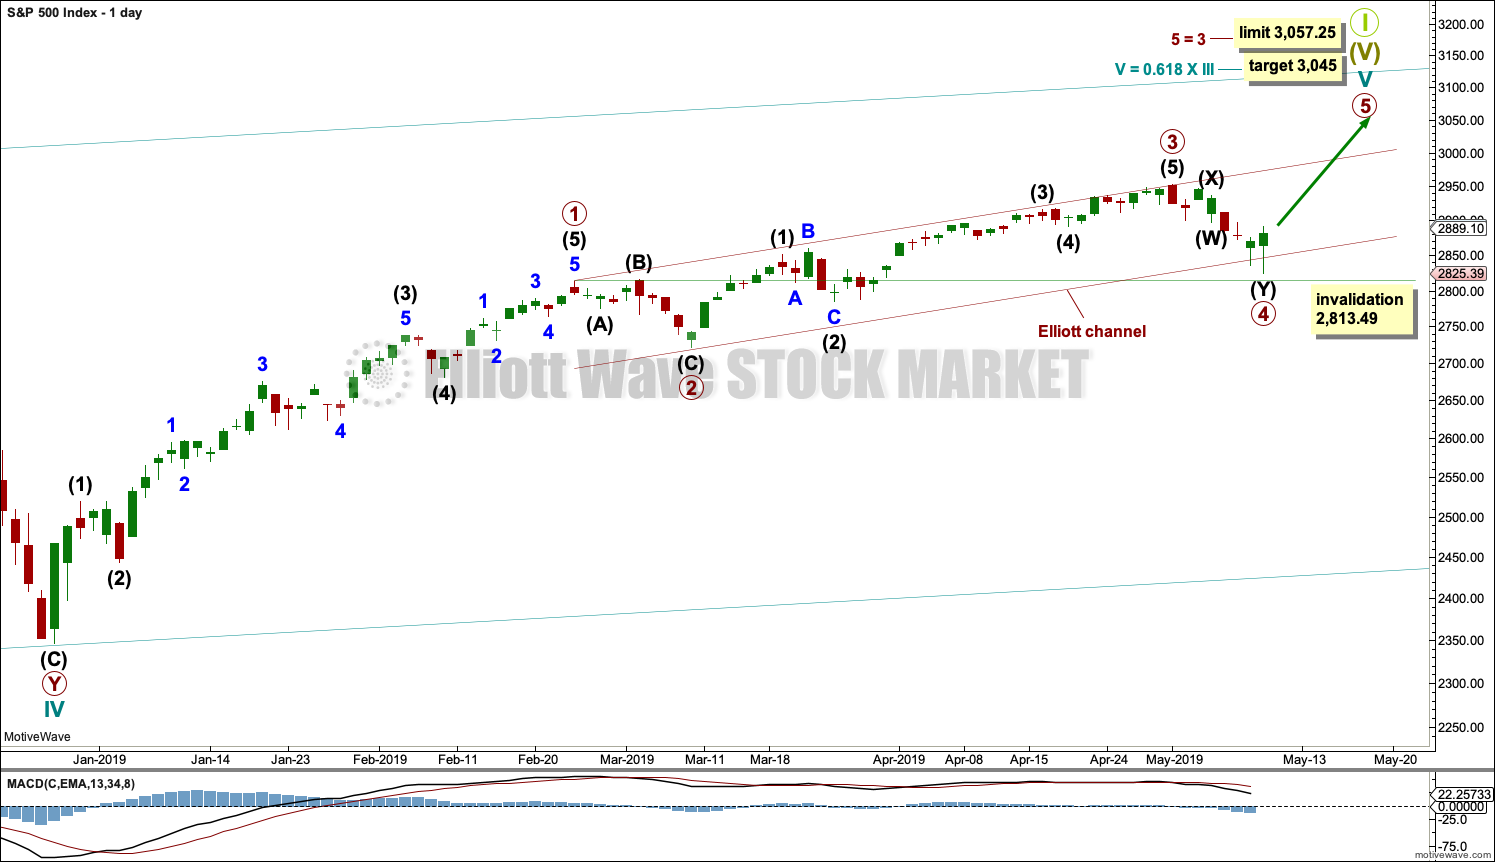
Cycle wave V so far looks to be unfolding as an impulse, which is the most common structure for a fifth wave. The only other possible structure is an ending diagonal. A diagonal would be considered only if overlapping suggests it.
Within the impulse, primary waves 1, 2, 3 and 4 may be complete. The final wave of primary wave 5 may now continue higher.
Use Elliott’s technique to draw a channel about this impulse. Draw the first trend line from the ends of primary waves 1 to 3, then place a parallel copy on the end of primary wave 2. Primary wave 4 may have ended with a small overshoot of the channel. Primary wave 5 may now find resistance at the upper edge.
Primary wave 2 unfolded as a flat correction. Primary wave 4 may have exhibited alternation in structure with primary wave 2 as a double zigzag.
If it continues any lower, then primary wave 4 may not move into primary wave 1 price territory below 2,813.49.
HOURLY CHART
Click chart to enlarge.
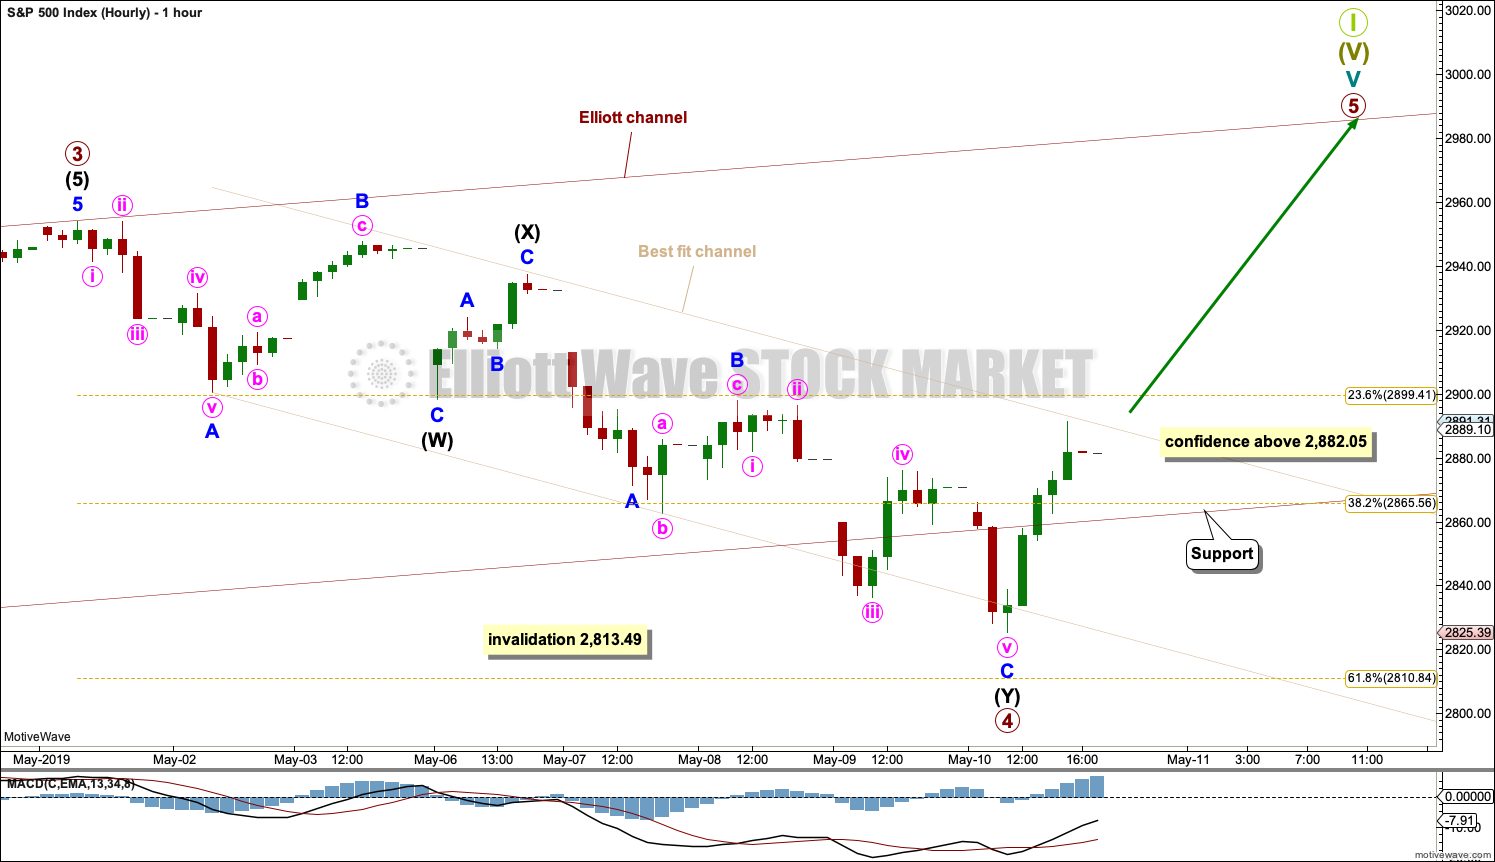
Primary wave 4 may be a complete double zigzag.
The first zigzag in the double is labelled intermediate wave (W). The double is joined by a complete three in the opposite direction labelled intermediate wave (X). Intermediate wave (X) subdivides as a zigzag, which is the most common structure for X waves.
The second zigzag in the double labelled intermediate wave (Y) may also be complete. Within intermediate wave (Y), minor wave C now looks like a clear five wave impulse. A new high at the end of Friday’s session above 2,882.05 could not be a continuation of minute wave iv within minor wave C, so minor wave C must now be over. This gives a little confidence that primary wave 4 may now be over.
Primary wave 4 may not move into primary wave 1 price territory below 2,813.49.
A best fit channel is drawn about primary wave 4. A breach of this channel by at least one full hourly candlestick above and not touching the upper edge, by upwards and not sideways movement, would provide further confidence that primary wave 4 should be over.
ALTERNATE DAILY CHART
Click chart to enlarge.
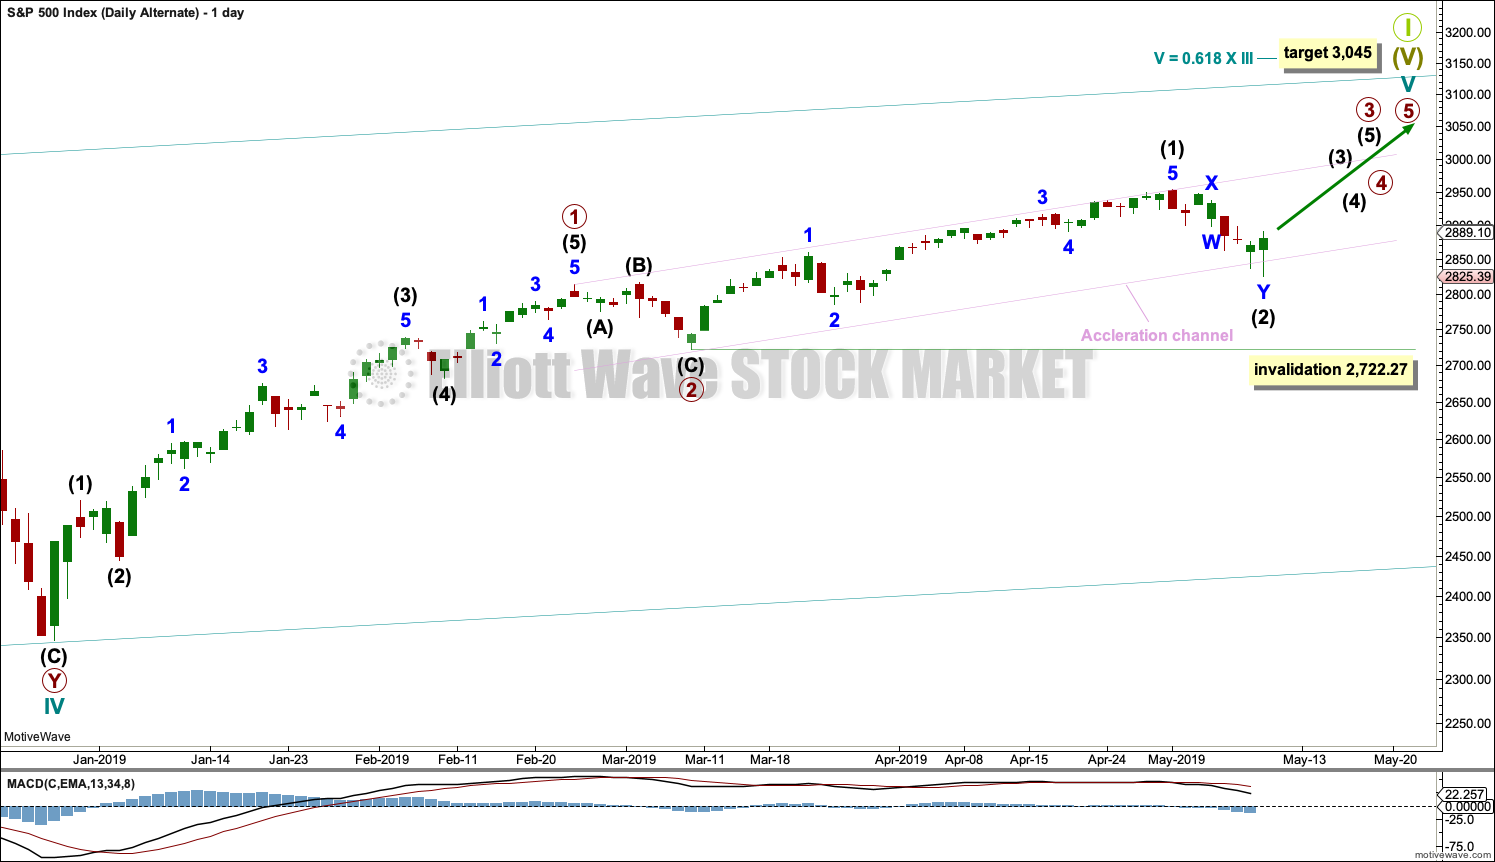
If the first daily chart is invalidated by a new low below 2,813.49, then this alternate wave count would be used.
Within the five wave impulse of cycle wave V, it is possible that only primary waves 1 and 2 may be complete. Primary wave 3 may be extending.
Primary wave 3 may only subdivide as a five wave impulse. Within primary wave 3, intermediate waves (1) and now possibly (2) may be complete. If intermediate wave (2) continues lower, it may not move beyond the start of intermediate wave (1) below 2,722.27.
This alternate wave count is the same as the first daily chart with the exception of the degree of labelling within primary wave 3. This wave count moves it all down one degree.
SECOND WAVE COUNT
WEEKLY CHART
Click chart to enlarge.
This weekly chart is identical to the first weekly chart, with the sole exception being the degree of labelling.
This weekly chart moves the degree of labelling for the impulse beginning in March 2009 all down one degree. This difference is best viewed on monthly charts.
The impulse is still viewed as nearing an end; a fifth wave is still seen as needing to complete higher. This wave count labels it primary wave 5.
TECHNICAL ANALYSIS
WEEKLY CHART
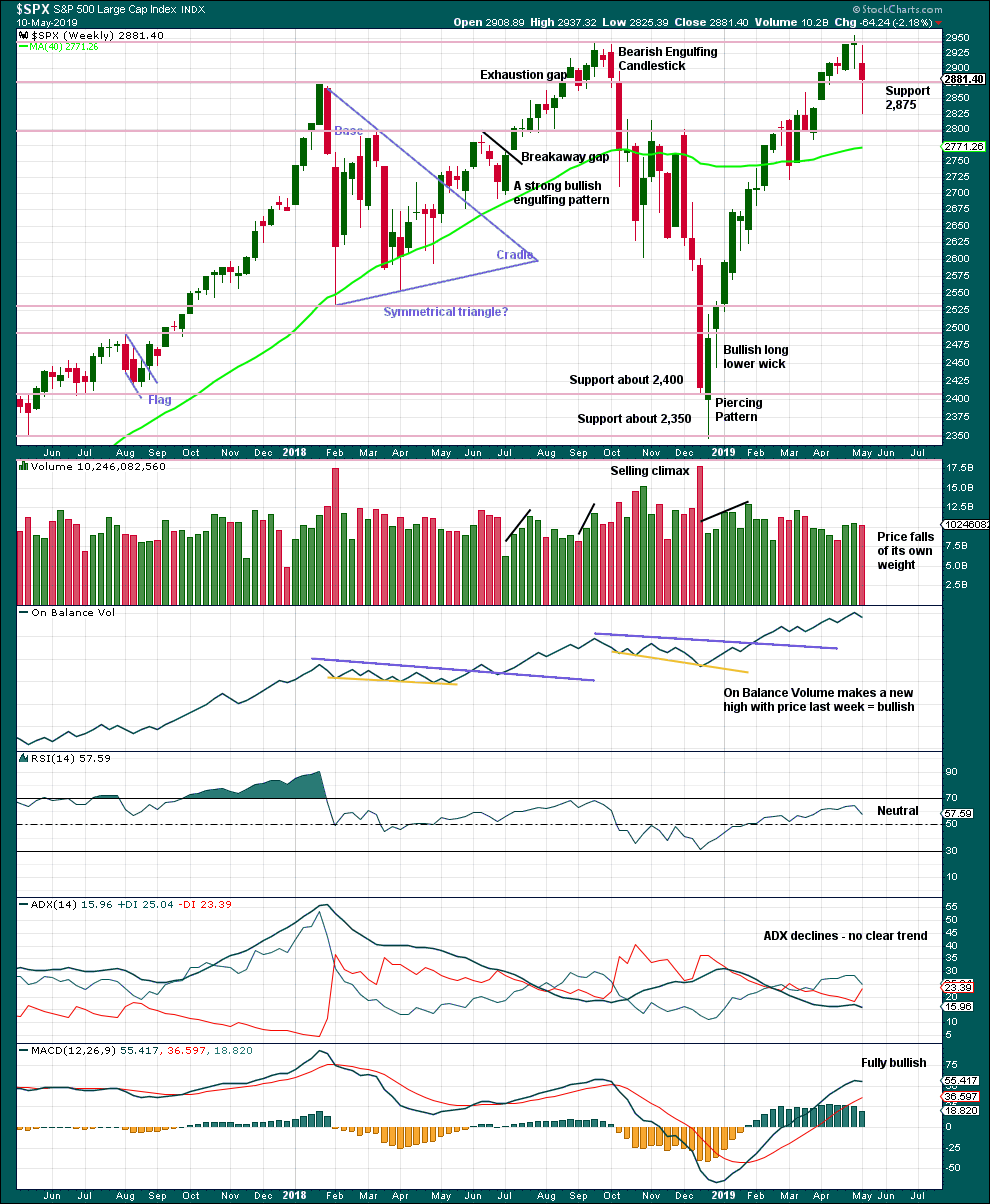
Click chart to enlarge. Chart courtesy of et=”_blank”>StockCharts.com.
The longer lower wick this week is bullish, but the reasonable length of the upper wick reduces the bullishness here.
DAILY CHART
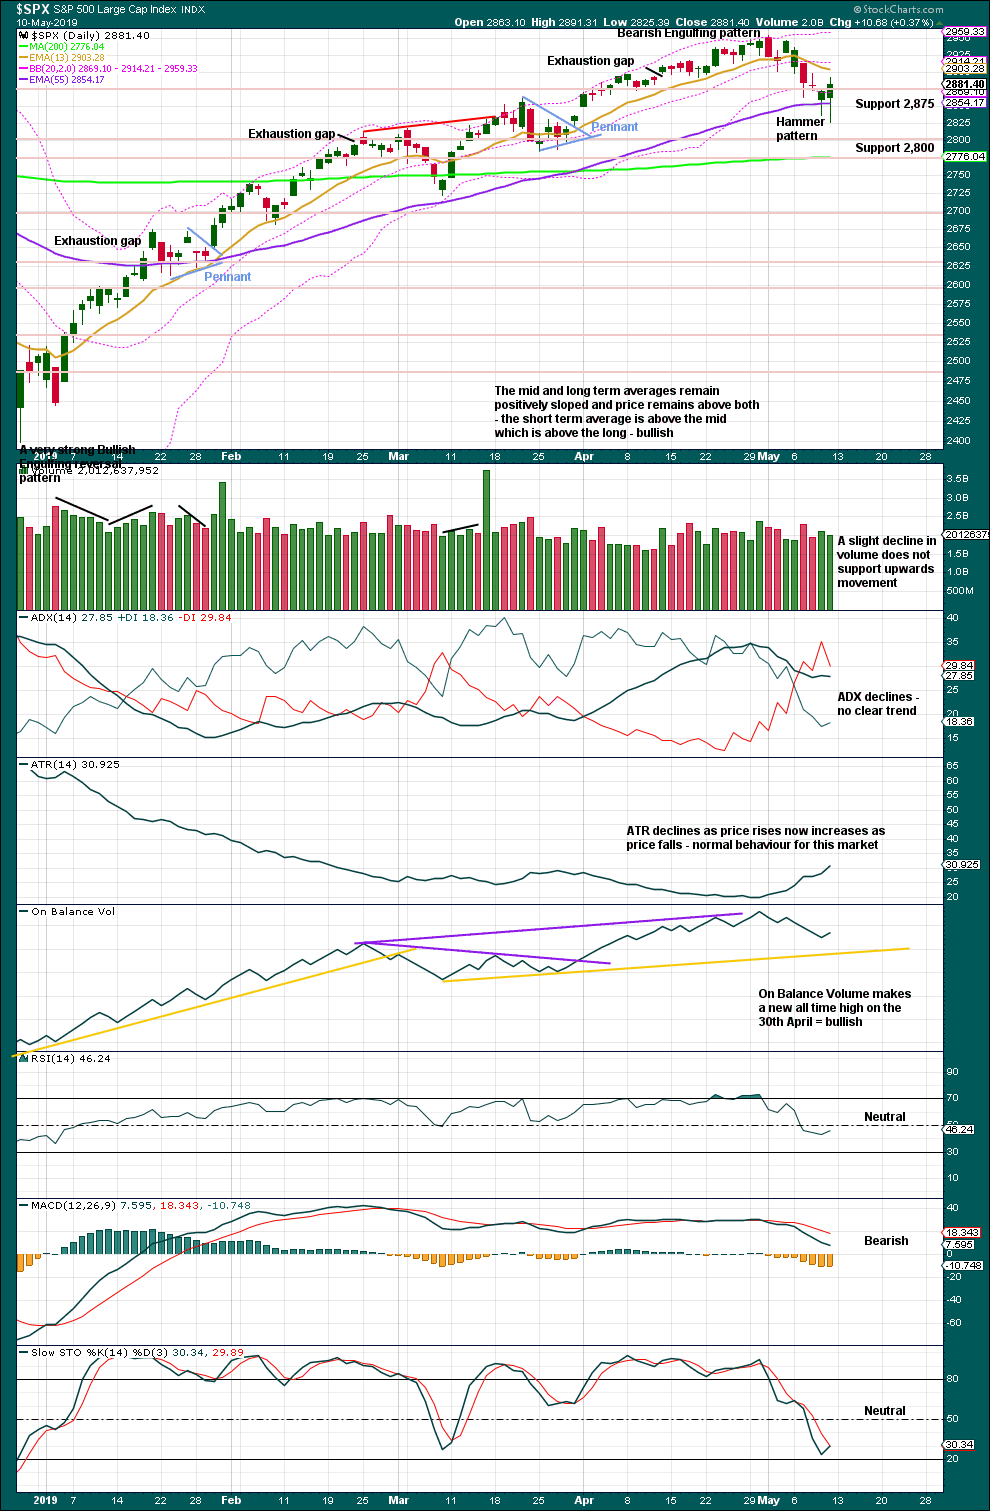
Click chart to enlarge. Chart courtesy of StockCharts.com.
A Hammer candlestick coming after a short fall in price is a bullish reversal pattern. Now two long lower wicks on the last two daily candlesticks look more bullish.
BREADTH – AD LINE
WEEKLY CHART
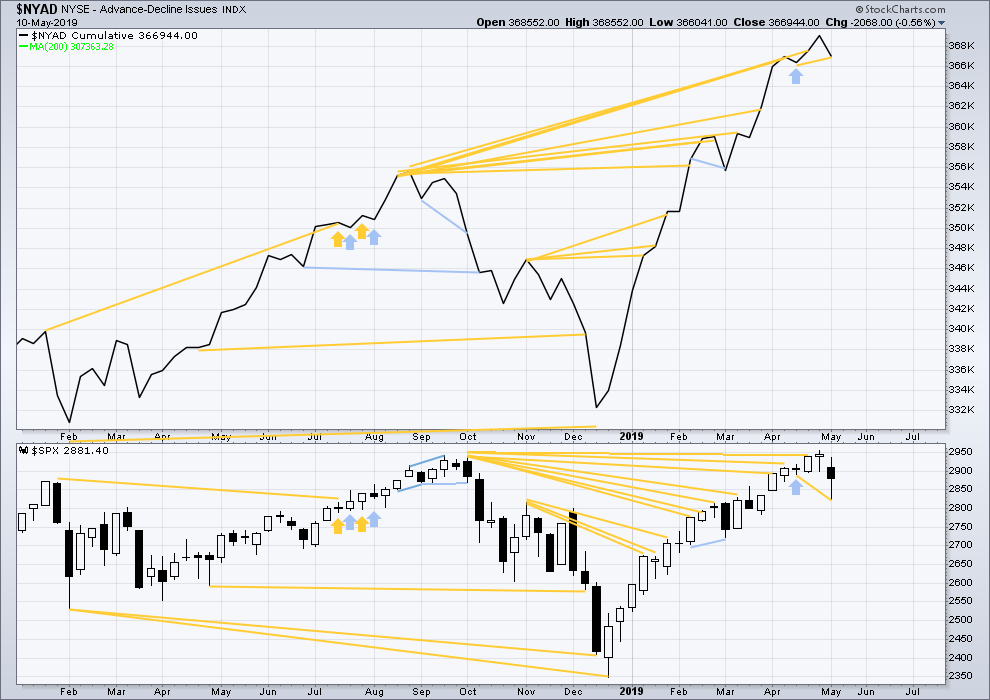
Click chart to enlarge. Chart courtesy of StockCharts.com. So that colour blind members are included, bearish signals
will be noted with blue and bullish signals with yellow.
Every single bear market from the Great Depression and onwards has been preceded by a minimum of 4 months divergence between price and the AD line. With the AD line making a new all time high again last week, the end of this bull market and the start of a new bear market must be a minimum of 4 months away, which is the beginning of September 2019 at this time.
This week price has made a new low below the low three weeks prior, but the AD line has not. Downwards movement in price this week has not come with a corresponding decline in market breadth. This divergence is bullish for the short term.
This week all of large, mid and small caps have moved lower. None have made new swing lows below the low of the 25th of March. There is no divergence.
DAILY CHART
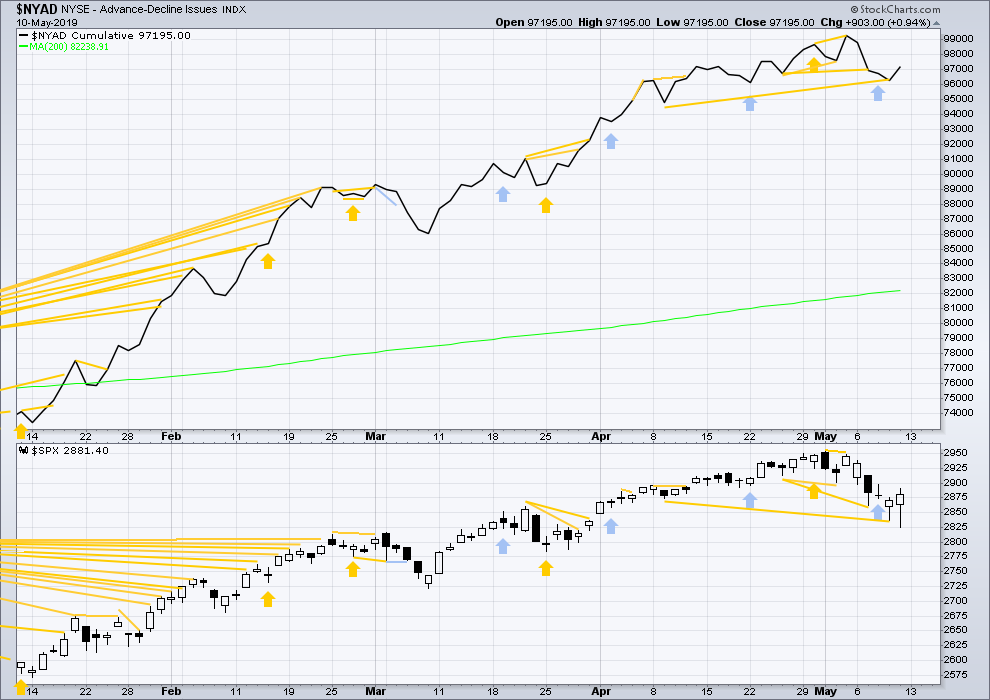
Click chart to enlarge. Chart courtesy of StockCharts.com. So that colour blind members are included, bearish signals
will be noted with blue and bullish signals with yellow.
Breadth should be read as a leading indicator.
Bullish mid-term divergence remains. On Friday price completed an outside day, which closed green. Upwards movement within the session has support from rising market breadth.
VOLATILITY – INVERTED VIX CHART
WEEKLY CHART
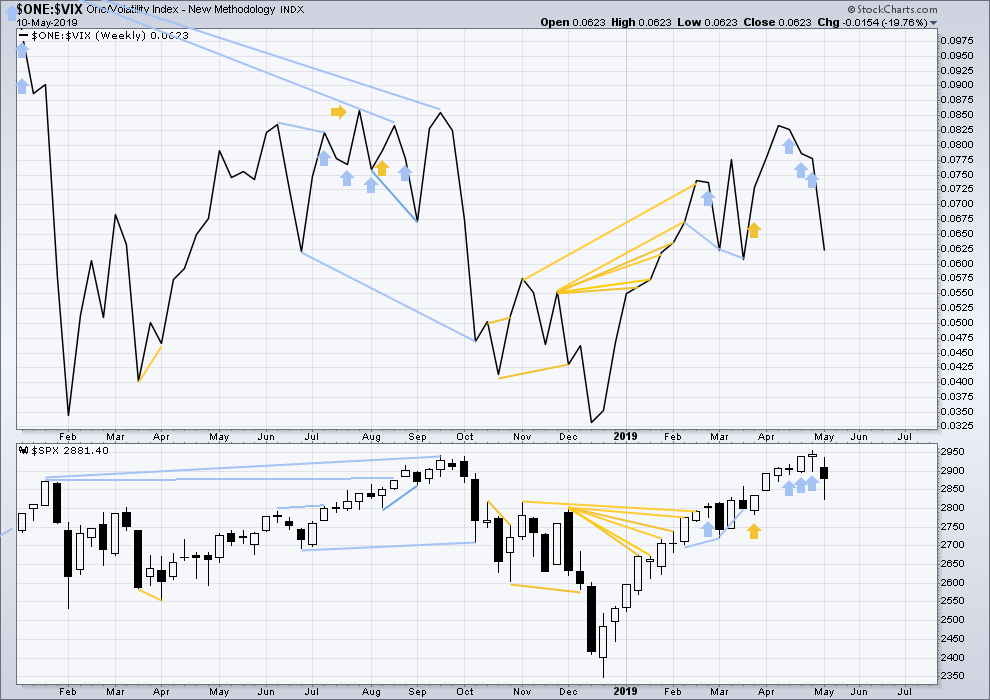
Click chart to enlarge. Chart courtesy of StockCharts.com. So that colour blind members are included, bearish signals
will be noted with blue and bullish signals with yellow.
Three weeks in a row of weekly bearish divergence has now been followed by a reasonable downwards week. It may be resolved here, or it may yet be an indication of further downwards movement in price.
This week both price and inverted VIX have moved lower. Inverted VIX is not moving any faster than price. There is no short-term divergence.
DAILY CHART
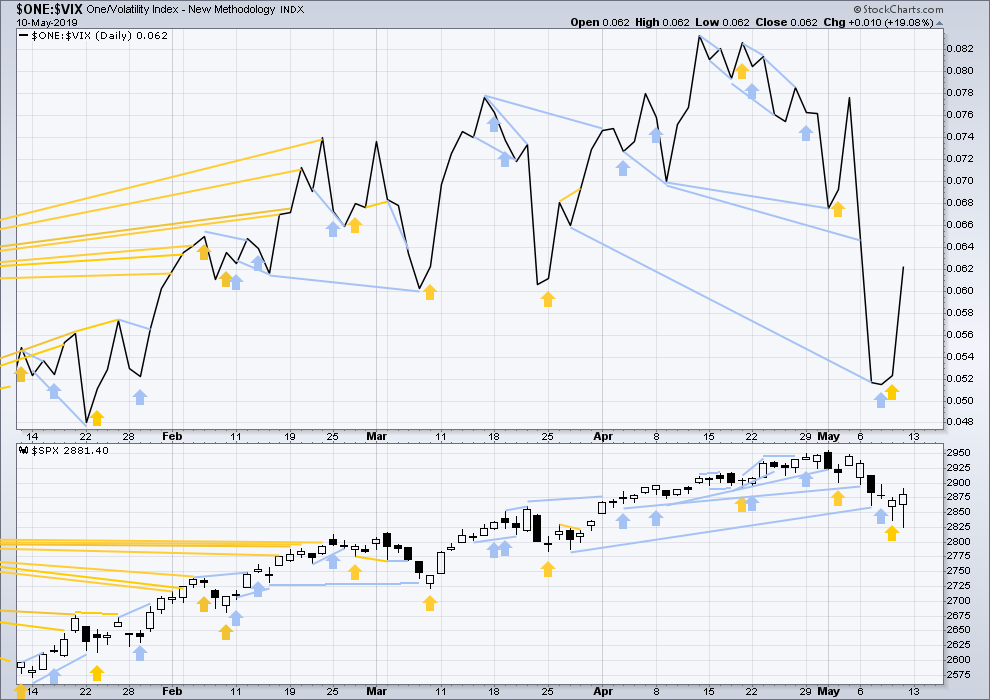
Click chart to enlarge. Chart courtesy of StockCharts.com. So that colour blind members are included, bearish signals
will be noted with blue and bullish signals with yellow.
Bullish divergence noted in last analysis has now been followed by an outside day, which has closed green. It may now be resolved.
Friday’s outside day closed green and comes with a strong increase in inverted VIX. A strong decline in VIX on Friday is bullish.
DOW THEORY
Dow Theory confirmed a bear market in December 2018. This does not necessarily mean a bear market at Grand Super Cycle degree though; Dow Theory makes no comment on Elliott wave counts. On the 25th of August 2015 Dow Theory also confirmed a bear market. The Elliott wave count sees that as part of cycle wave II. After Dow Theory confirmation of a bear market in August 2015, price went on to make new all time highs and the bull market continued.
DJIA: 23,344.52 – a close on the 19th of December at 23,284.97 confirms a bear market.
DJT: 9,806.79 – price has closed below this point on the 13th of December.
S&P500: 2,532.69 – a close on the 19th of December at 2,506.96 provides support to a bear market conclusion.
Nasdaq: 6,630.67 – a close on the 19th of December at 6,618.86 provides support to a bear market conclusion.
With all the indices moving now higher, Dow Theory would confirm a bull market if the following highs are made:
DJIA: 26,951.81
DJT: 11,623.58
S&P500: 2,940.91 – a new all time high has been made on the 29th of April 2019.
Nasdaq: 8,133.30 – a new high has been made on 24th of April 2019.
Published @ 11:18 p.m. EST.
—
Careful risk management protects your trading account(s).
Follow my two Golden Rules:
1. Always trade with stops.
2. Risk only 1-5% of equity on any one trade.
—
New updates to this analysis are in bold.
I’m considering changing the wave count at the daily chart level to this today.
This pullback looks too deep for the alternate idea, and too large to be intermediate degree.
It also now subdivides on the hourly chart level as a five. This may be only wave A of a zigzag.
Hourly chart;
Yep! 🙂
Hi Verne!
Hiya! 🙂
Thank you, Lara, for these thoughtful adjustments. I appreciate your guidance, especially at times like this when I can begin to lose track of where we are!
You’re welcome.
Except… I wish I’d seen this idea earlier.
The count now switches to the alternate. The degree of labelling in the last wave up is moved down one degree, this pullback is now seen as a second wave correction.
It subdivides as an incomplete double zigzag.
Hello everyone
Off topic I’m thinking g of buying shares on the Dubai financial market. In particular Emaar Properties. Lara/Kevin/ Rodney can you give me some insight if you have a chance too look at the charts please. Thanks again Nino.
Ps and the aud against the usd
Hope all is well everyone
Sure looks like a “B” trap now …
SPX 200 Day moving average is the next level of support. We may be on our way to visit it.
Overlapped fibos at 2810-12 that may hold/turn this market….
And subdued VIX today may support that idea.
next stop down that I have is 2775 area, a 78%.
SPX now at -2.9%. A friend told me on Saturday regarding Friday’s action, “dude, I think it’s a trap…”. Well, that’s not my paradigm for viewing market action…but he was right, effectively.
Coincidentally – the 200 dma SPX is right there at the 78% mark
With the premarket down 55 SPX points, it looks like we are seeing the continuation of Primary 4 on the first daily count.
If we stay above Friday’s low of 2825.39, today’s drop could be a low degree second wave as we are just starting Primary 5.
What a joy to be #1 for the weekend.
This past week ended quite powerfully to the upside. I suspect we will see more of this action next week and beyond to propel us to the completion target. The questions is will it continue beyond towards 3200 SPX or will it stall at 3050 leading to a bear market? We will find the answer in the next few weeks I think.
Have a wonderful weekend everyone.
May your #1 bring you good fortune in the upcoming trading week!
But the question before those is when does this iv wave finally finish and a v wave start????
Clearly my suspicions of carry over to the upside were dead wrong. This move down has made a lower low and the completion of any fourth wave looks tenuous at best.
I t appears that we have invalidated first count (below 2813.49) and are now onto alt daily with an invalidation of 2722.27