
More downwards movement was expected for the session to reach the lower edge of a channel. The channel was overshot and price quickly reversed to close back within it. This is mostly what was expected.
Summary: The upwards trend may now resume.
The final target remains the same at 3,045. A new limit for this fifth wave to end is now at 3,068.
The biggest picture, Grand Super Cycle analysis, is here.
Monthly charts were last published here, with video here. There are two further alternate monthly charts here, with video here.
ELLIOTT WAVE COUNTS
The two Elliott wave counts below will be labelled First and Second rather than main and alternate as they may be about of even probability. When the fifth wave currently unfolding on weekly charts may be complete, then these two wave counts will diverge on the severity of the expected following bear market. To see an illustration of this future divergence monthly charts should be viewed.
FIRST WAVE COUNT
WEEKLY CHART
Click chart to enlarge.
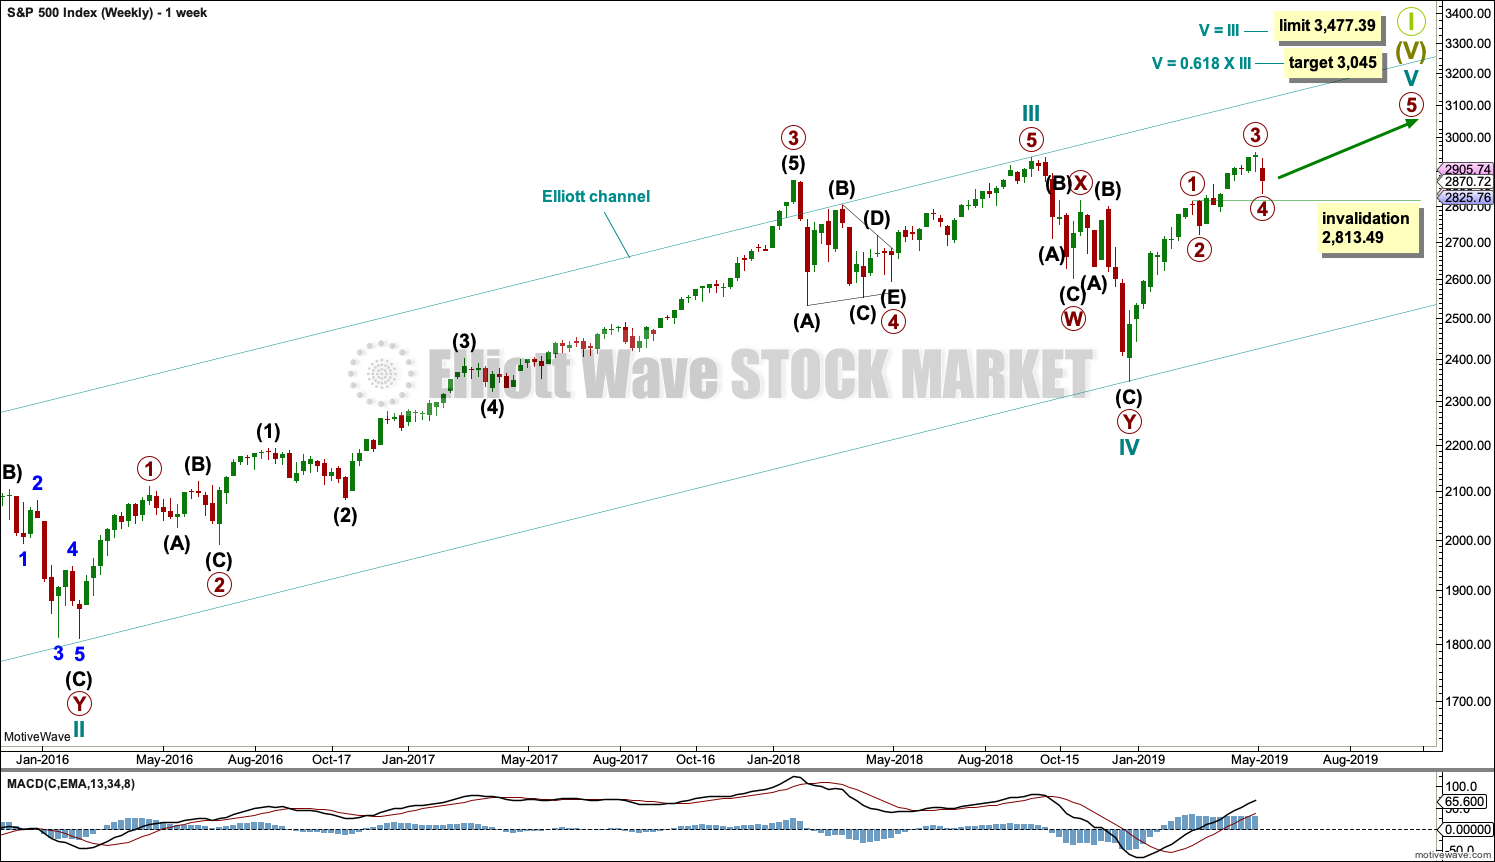
The basic Elliott wave structure consists of a five wave structure up followed by a three wave structure down (for a bull market). This wave count sees the bull market beginning in March 2009 as an incomplete five wave impulse and now within the last fifth wave, which is labelled cycle wave V. This impulse is best viewed on monthly charts. The weekly chart focusses on the end of it.
Elliott wave is fractal. This fifth wave labelled cycle wave V may end a larger fifth wave labelled Super Cycle wave (V), which may end a larger first wave labelled Grand Super Cycle wave I.
The teal Elliott channel is drawn using Elliott’s first technique about the impulse of Super Cycle wave (V). Draw the first trend line from the end of cycle wave I (off to the left of the chart, the weekly candlestick beginning 30th November 2014) to the end of cycle wave III, then place a parallel copy on the end of cycle wave II. This channel perfectly shows where cycle wave IV ended at support. The strongest portion of cycle wave III, the end of primary wave 3, overshoots the upper edge of the channel. This is a typical look for a third wave and suggests the channel is drawn correctly and the way the impulse is counted is correct.
Within Super Cycle wave (V), cycle wave III is shorter than cycle wave I. A core Elliott wave rule states that a third wave may never be the shortest. For this rule to be met in this instance, cycle wave V may not be longer in length than cycle wave III. This limit is at 3,477.39. This limit may still apply if the degree of labelling within cycle wave V is changed all down one degree.
A final target is calculated at cycle degree for the impulse to end.
The structure of cycle wave V is focussed on at the daily chart level below.
DAILY CHART
Click chart to enlarge.
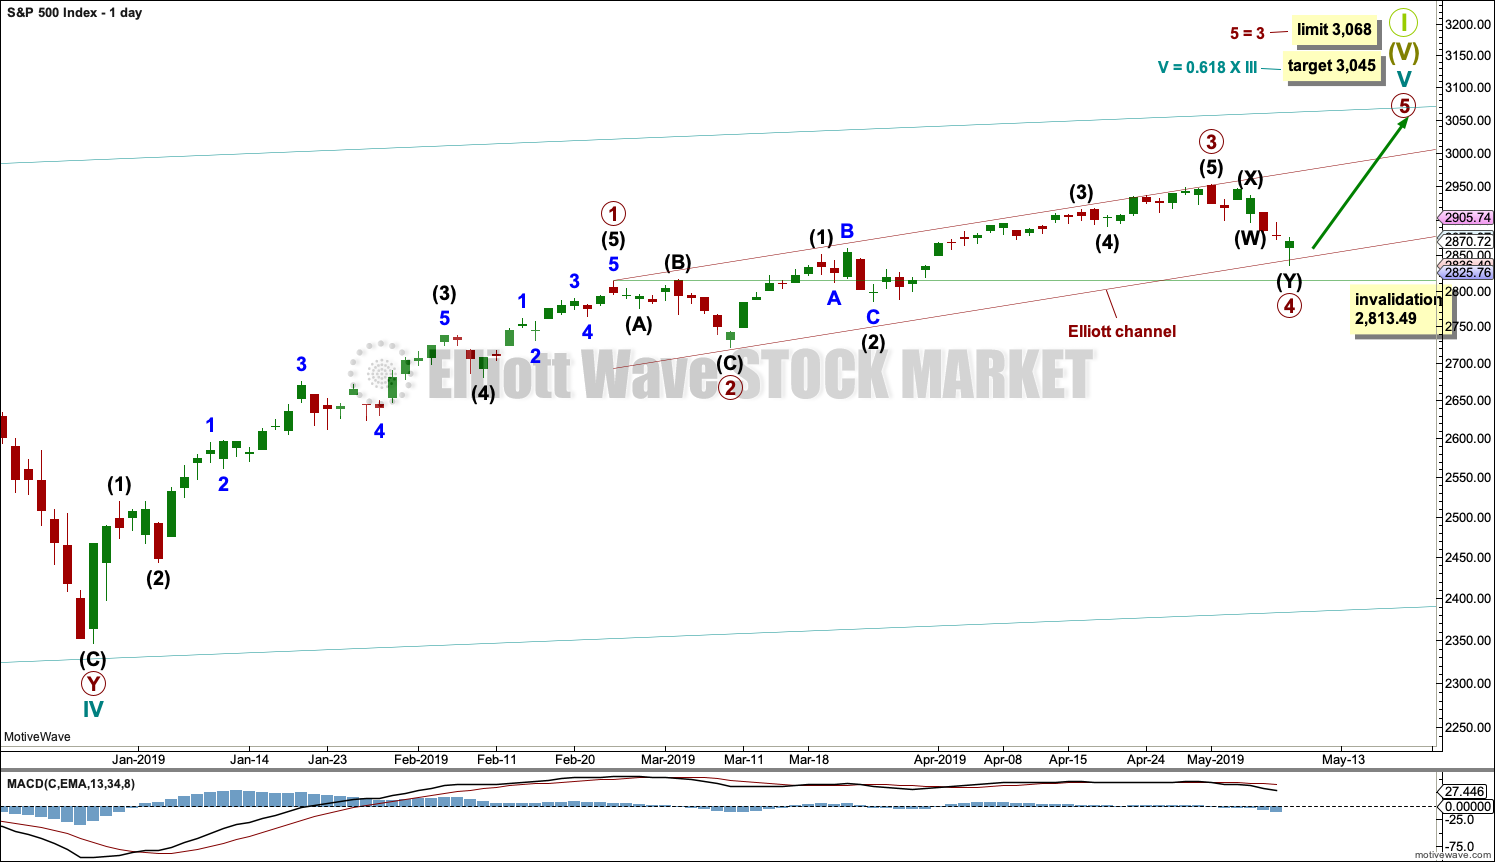
Cycle wave V so far looks to be unfolding as an impulse, which is the most common structure for a fifth wave. The only other possible structure is an ending diagonal. A diagonal would be considered only if overlapping suggests it.
Within the impulse, primary waves 1, 2, 3 and 4 may be complete. The final wave of primary wave 5 may now continue higher.
Use Elliott’s technique to draw a channel about this impulse. Draw the first trend line from the ends of primary waves 1 to 3, then place a parallel copy on the end of primary wave 2. Primary wave 4 may have ended with a small overshoot of the channel. Primary wave 5 may now find resistance at the upper edge.
Primary wave 2 unfolded as a flat correction. Primary wave 4 may have exhibited alternation in structure with primary wave 2 as a double zigzag.
If it continues any lower, then primary wave 4 may not move into primary wave 1 price territory below 2,813.49.
HOURLY CHART
Click chart to enlarge.
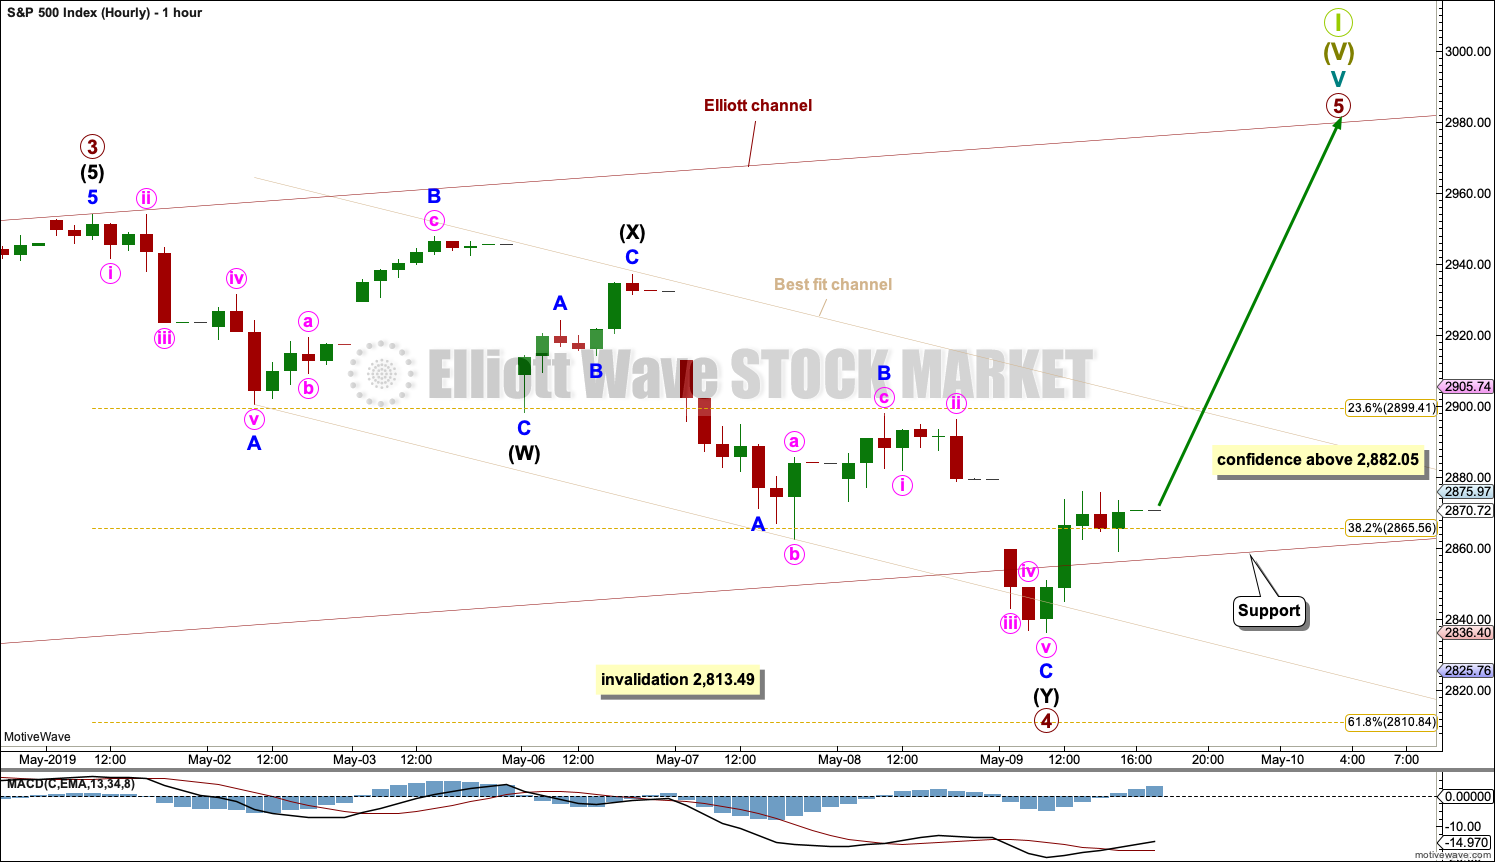
Primary wave 4 may be a complete double zigzag.
The first zigzag in the double is labelled intermediate wave (W). The double is joined by a complete three in the opposite direction labelled intermediate wave (X). Intermediate wave (X) subdivides as a zigzag, which is the most common structure for X waves.
The second zigzag in the double labelled intermediate wave (Y) may now also be complete. Within intermediate wave (Y), minor wave C is labelled as a five wave impulse. Within this impulse, minute wave iv may not overlap into minute wave i price territory above 2,882.05. A new high above 2,882.05 could not be a continuation of minute wave iv, so at that stage minor wave C must be over. A new high above this point would add confidence that primary wave 4 may be over.
Primary wave 4 may not move into primary wave 1 price territory below 2,813.49.
A best fit channel is drawn about primary wave 4. A breach of this channel by at least one full hourly candlestick above and not touching the upper edge, by upwards and not sideways movement, would provide confidence that primary wave 4 should be over.
SECOND WAVE COUNT
WEEKLY CHART
Click chart to enlarge.
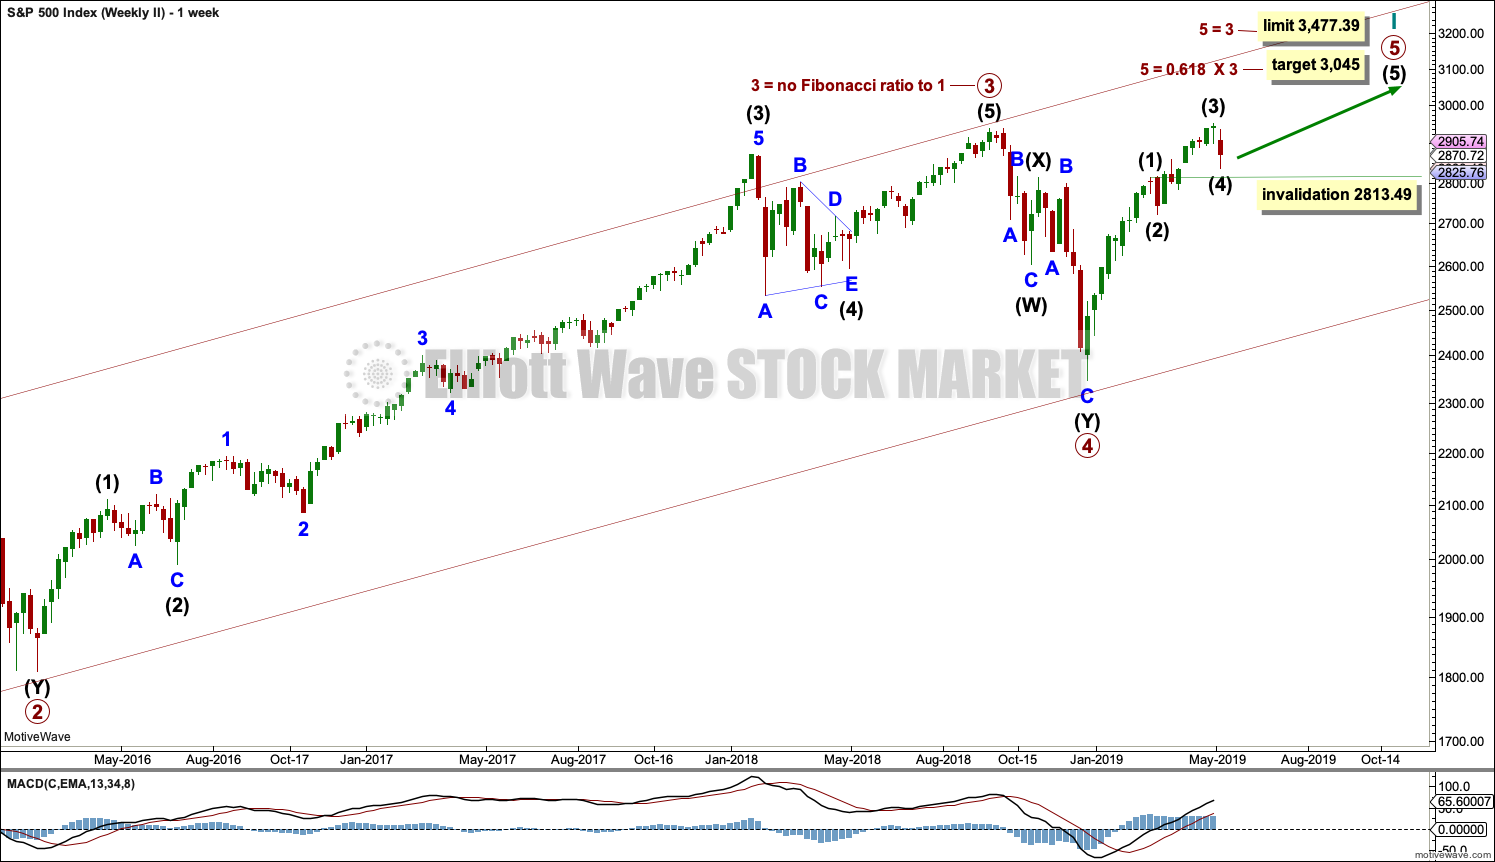
This weekly chart is identical to the first weekly chart, with the sole exception being the degree of labelling.
This weekly chart moves the degree of labelling for the impulse beginning in March 2009 all down one degree. This difference is best viewed on monthly charts.
The impulse is still viewed as nearing an end; a fifth wave is still seen as needing to complete higher. This wave count labels it primary wave 5.
TECHNICAL ANALYSIS
WEEKLY CHART
Click chart to enlarge. Chart courtesy of et=”_blank”>StockCharts.com.
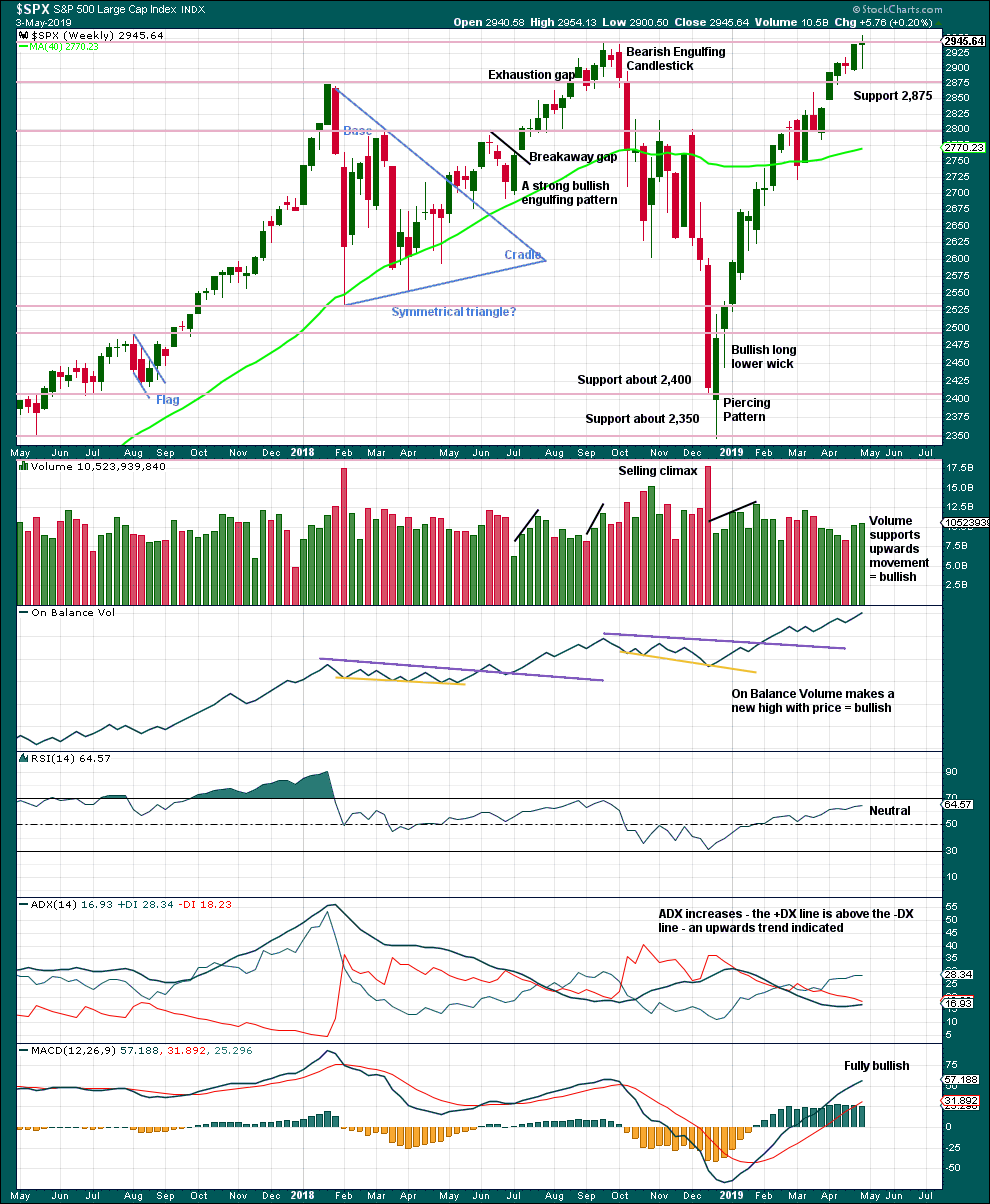
The Doji last week may represent a short pause within the upwards trend, or it may yet form part of a reversal pattern. Doji on their own are not reversal signals.
This chart remains fully bullish.
DAILY CHART
Click chart to enlarge. Chart courtesy of StockCharts.com.
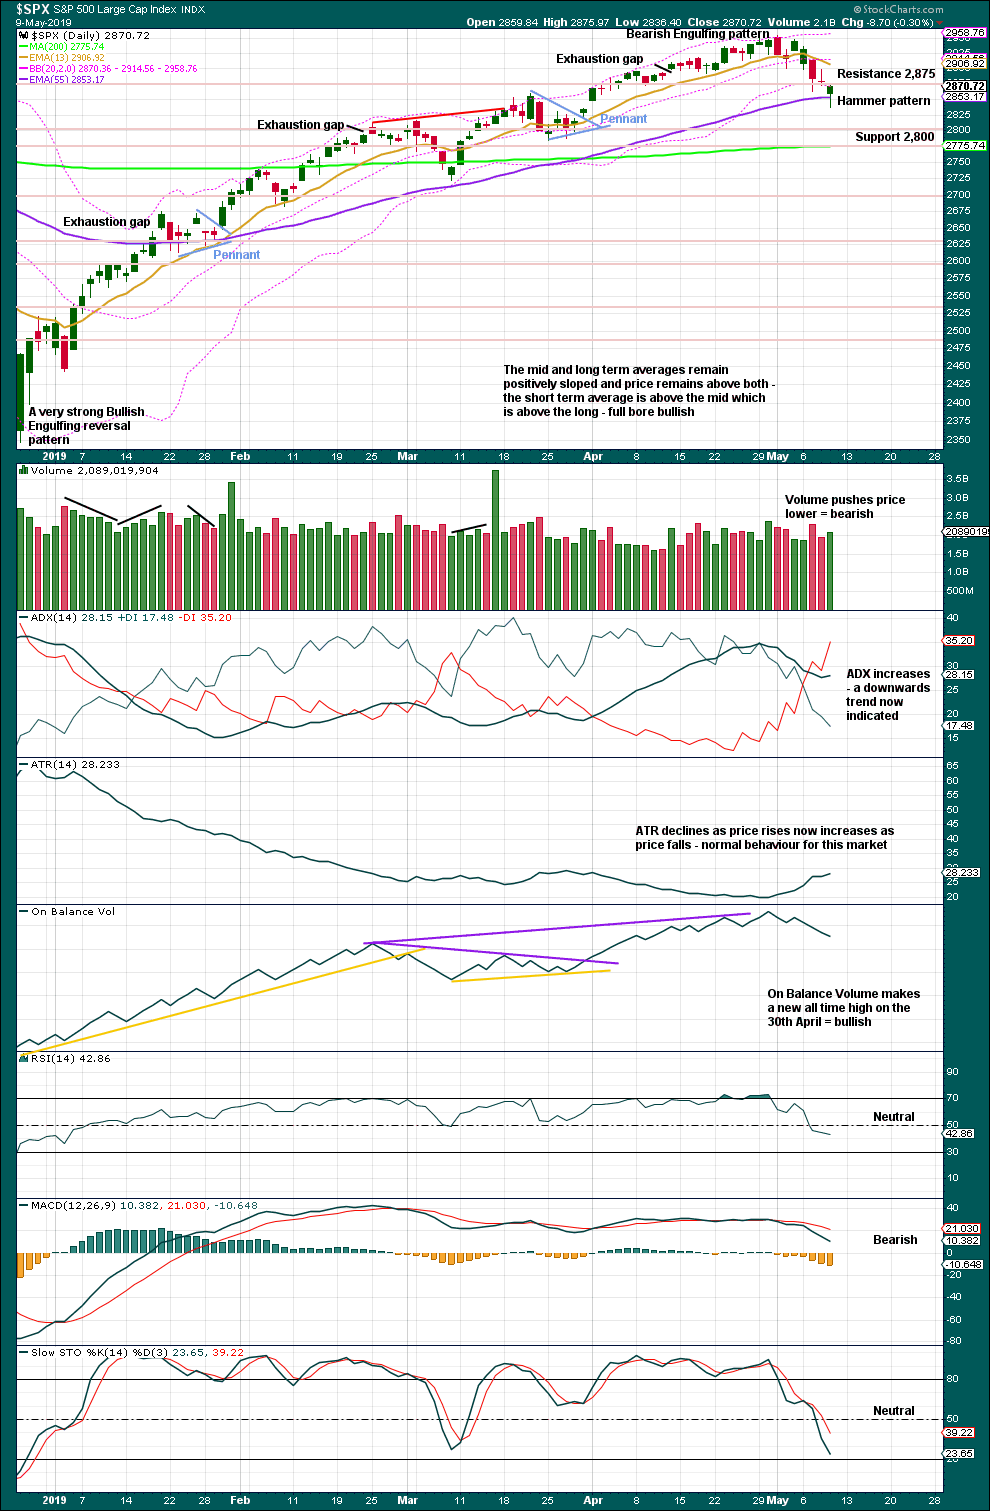
Today a Hammer candlestick coming after a short fall in price is a bullish reversal pattern. However, the short-term volume profile remains bearish, which contradicts the Hammer candlestick reversal pattern.
BREADTH – AD LINE
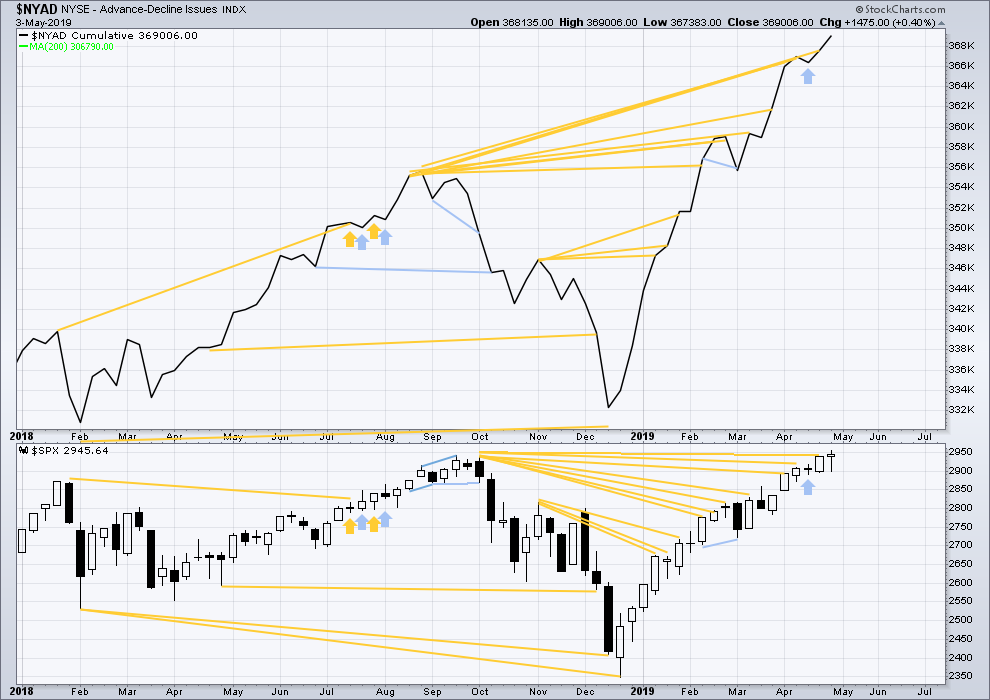
WEEKLY CHART
Click chart to enlarge. Chart courtesy of StockCharts.com. So that colour blind members are included, bearish signals
will be noted with blue and bullish signals with yellow.
Every single bear market from the Great Depression and onwards has been preceded by a minimum of 4 months divergence between price and the AD line. With the AD line making a new all time high again last week, the end of this bull market and the start of a new bear market must be a minimum of 4 months away, which is the beginning of September 2019 at this time.
Mid-term bullish divergence has been followed by a new all time high from price and may now be resolved. There is no mid nor long-term divergence. Both price and the AD line make new all time highs.
While large caps have made a new all time high this week, mid and small caps did not and remain below their prior all time highs. This rally is led by large caps, which is typical of an ageing bull market.
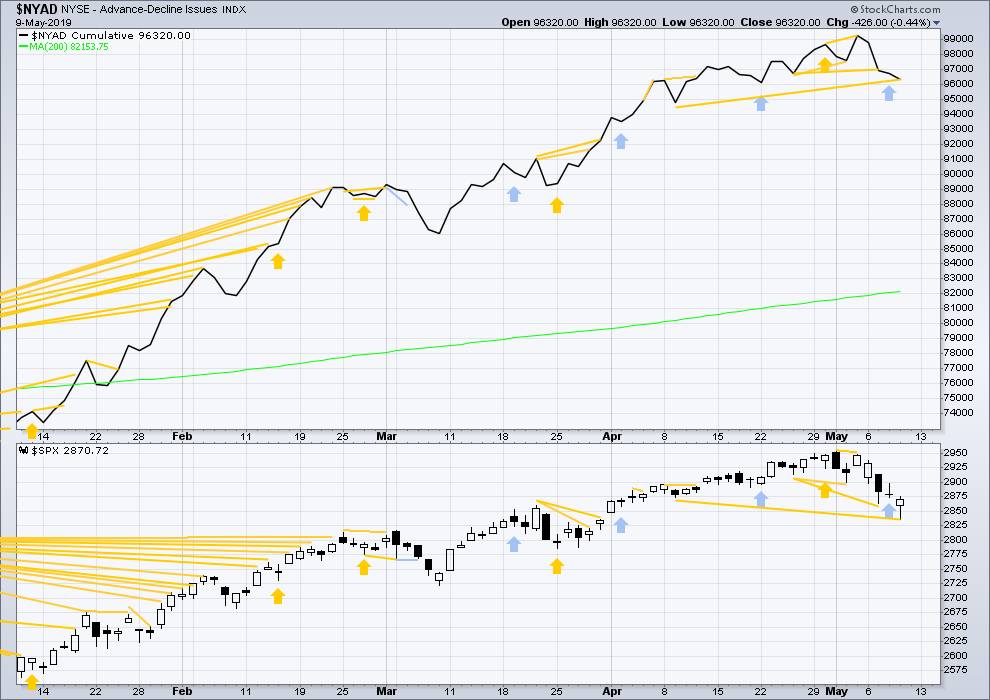
DAILY CHART
Click chart to enlarge. Chart courtesy of StockCharts.com. So that colour blind members are included, bearish signals
will be noted with blue and bullish signals with yellow.
Breadth should be read as a leading indicator.
Short-term bearish divergence noted in yesterday’s analysis has now been followed by a downwards day. The divergence may now be resolved.
Today price has made a new low below the prior low of the 9th of April, but the AD line has not. Downwards movement in price does not have support from a corresponding downwards movement in breadth. This divergence is bullish for the mid term.
VOLATILITY – INVERTED VIX CHART
WEEKLY CHART
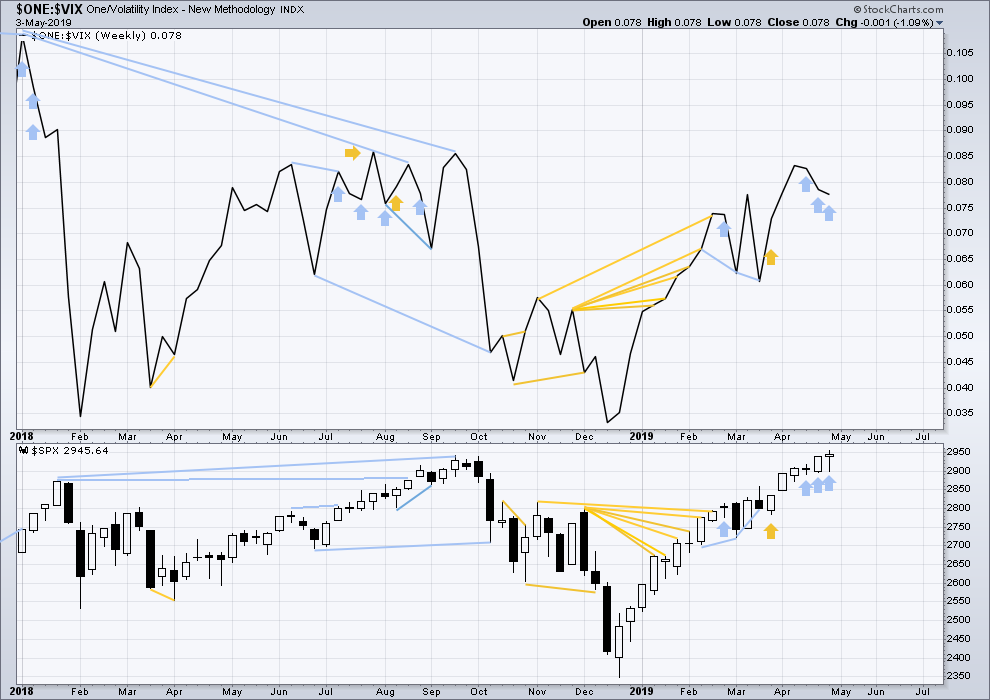
Click chart to enlarge. Chart courtesy of StockCharts.com. So that colour blind members are included, bearish signals
will be noted with blue and bullish signals with yellow.
For now three weeks in a row price has moved higher and inverted VIX has moved lower. This divergence is bearish for the short to mid term and may be warning of an approaching primary (or intermediate) degree correction.
It is noted that this has occurred before at the end of the strong rise in price up to the high on the 26th of January 2018. The three weeks up to that high saw price clearly move higher and inverted VIX clearly move lower. This divergence persisted for three weeks in that instance, and so may persist for a very few weeks again now before price turns.
DAILY CHART
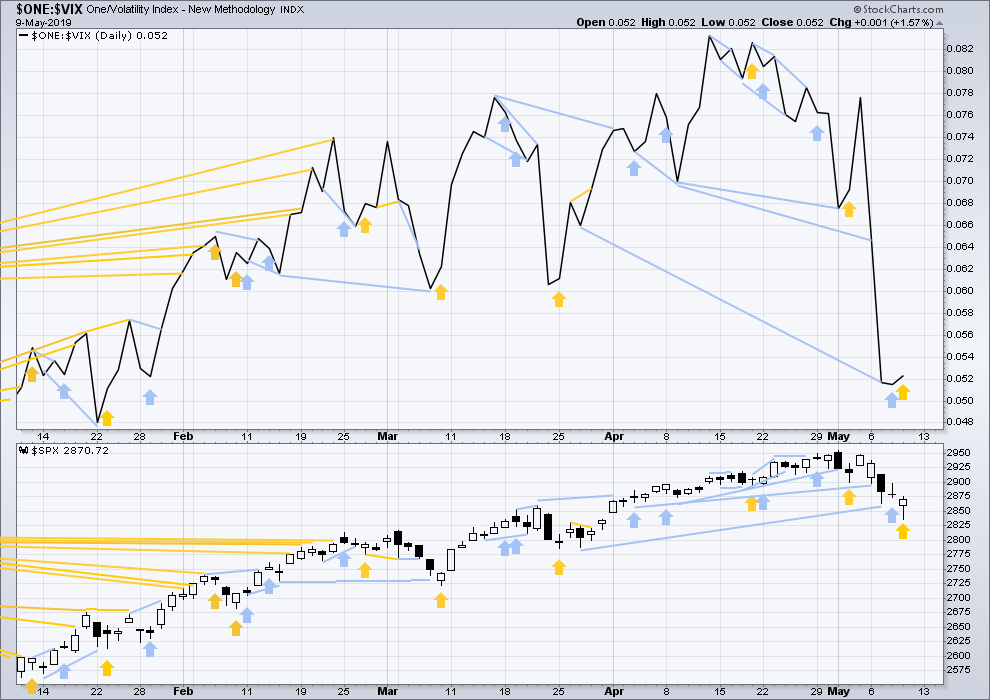
Click chart to enlarge. Chart courtesy of StockCharts.com. So that colour blind members are included, bearish signals
will be noted with blue and bullish signals with yellow.
Bearish divergence noted yesterday has been followed by some downwards movement. The divergence may now be resolved.
Today price moved lower, but inverted VIX moved a little higher. This divergence is bullish for the short term. Because there is bullish divergence for both the AD line and VIX, VIX will be given a very little weight today.
DOW THEORY
Dow Theory confirmed a bear market in December 2018. This does not necessarily mean a bear market at Grand Super Cycle degree though; Dow Theory makes no comment on Elliott wave counts. On the 25th of August 2015 Dow Theory also confirmed a bear market. The Elliott wave count sees that as part of cycle wave II. After Dow Theory confirmation of a bear market in August 2015, price went on to make new all time highs and the bull market continued.
DJIA: 23,344.52 – a close on the 19th of December at 23,284.97 confirms a bear market.
DJT: 9,806.79 – price has closed below this point on the 13th of December.
S&P500: 2,532.69 – a close on the 19th of December at 2,506.96 provides support to a bear market conclusion.
Nasdaq: 6,630.67 – a close on the 19th of December at 6,618.86 provides support to a bear market conclusion.
With all the indices moving now higher, Dow Theory would confirm a bull market if the following highs are made:
DJIA: 26,951.81
DJT: 11,623.58
S&P500: 2,940.91 – a new all time high has been made on the 29th of April 2019.
Nasdaq: 8,133.30 – a new high has been made on 24th of April 2019.
Published @ 10:16 p.m. EST.
—
Careful risk management protects your trading account(s).
Follow my two Golden Rules:
1. Always trade with stops.
2. Risk only 1-5% of equity on any one trade.
—
New updates to this analysis are in bold.
Hourly chart update:
Minor C now looks like a better five. The first confidence point is passed. If the best fit channel is breached Monday that would provide further confidence that a low may be in place.
It wouldn’t rule out a triangle continuing sideways, but for that idea the low would be in place now anyway.
Next significant fractal turn point for SPX around 2810-13.
Okay nowhere near so deep and my impression is this iv is now structurally complete based on Lara’s hourly.
If price breaks to new lows next week…we could be headed into a much higher degree correction here (by definition I suppose).
Very nice (bullish) reversal bar here today so far! It would be VERY bullish IMO if price closed above yesterday’s high, but that’s probably asking for too much. I still have hourly trend as “down” but it’s moved from “strong” to “mild” with these rising prices. Everything so far giving supportive signals that the iv is complete.
Niiiiiice….
The economic meltdown due to “trade issues” wasn’t all it was cracked up to be…yet, anyway!
New ATH’s next week? Quite possibly.
Off to goof off, have a nice weekend all!
A question for members:
I tried to re-write the Elliott wave analysis yesterday to make it simpler and clearer.
In your opinion, is this achieved? yes or no?
Suggestions are welcome.
Lara,
I like simpler and clearer.
Lara,
I also like when you bold the new and updated text.
Well, I did not notice the changes necessarily yesterday. However, I did a side by side comparison today and see the changes clearly. To answer your question, Yes, it was simpler and clearer especially on the weekly and daily time frame where the bulk of the changes were made. Thanks.
My only suggestion remains the same, “Make sure to take some time off to make up for your lost Christmas Holiday”. But then again, you did not ask for those sort of suggestions. Many people who know me say I have foot and mouth disease. I keep putting my foot in my mouth only later having to retract it and apologize!
LOL
No worries Rodney.
As long as I get plenty of surfing in, I’m all good. Can continue this for a long while yet.
Would appreciate seeing some comment about time in each weekly, daily, hourly section. Time is a best guess, but your guess is better than mine. Some projection on time such as: “wave 1 was 7 weeks so wave 3 might be x to y weeks.”
Also, in charts, would like to see more emphasis on current and projected. There was a discussion sometime in past about dropping details on charts. I prefer more detail on current and projected waves. There seems a tendency by EW practitioners to visually display past waves, possibly to explain current projection, but I am here to determine future action, I don’t need a picture or summary of the past to explain why / how we got to present, I trust your judgement, the past is past, space in a chart is limited, consider eliminating some of the past waves on charts, which leaves more chart space for present and future wave details, counts, visual forms (directional arrows).
Summary: Provide best guess on time. Slide data in charts to the left, eliminating visuals of some past waves to allow more focus more on present and future waves.
Points taken. Will keep this foremost in my mind as I do the end of week analysis.
I am kinda reluctant to be too descriptive about how I’m expecting future wave counts to unfold though, as so much can change to the count as they do.
I noticed that it seemed clearer. Very helpful. Thank you!
1 for all
And all for 1.