
A small inside day leaves the short-term Elliott wave count unchanged.
Summary: A pullback may end when price finds support at the lower edge of the maroon Elliott channel, which is drawn on both daily and hourly charts. Thereafter, the upwards trend may resume.
The final target remains the same at 3,045. Alternate monthly wave counts allow for a target as high as 4,119.
The biggest picture, Grand Super Cycle analysis, is here.
Monthly charts were last published here, with video here. There are two further alternate monthly charts here, with video here.
ELLIOTT WAVE COUNTS
The two Elliott wave counts below will be labelled First and Second rather than main and alternate as they may be about of even probability. When the fifth wave currently unfolding on weekly charts may be complete, then these two wave counts will diverge on the severity of the expected following bear market. To see an illustration of this future divergence monthly charts should be viewed.
FIRST WAVE COUNT
WEEKLY CHART
Click chart to enlarge.
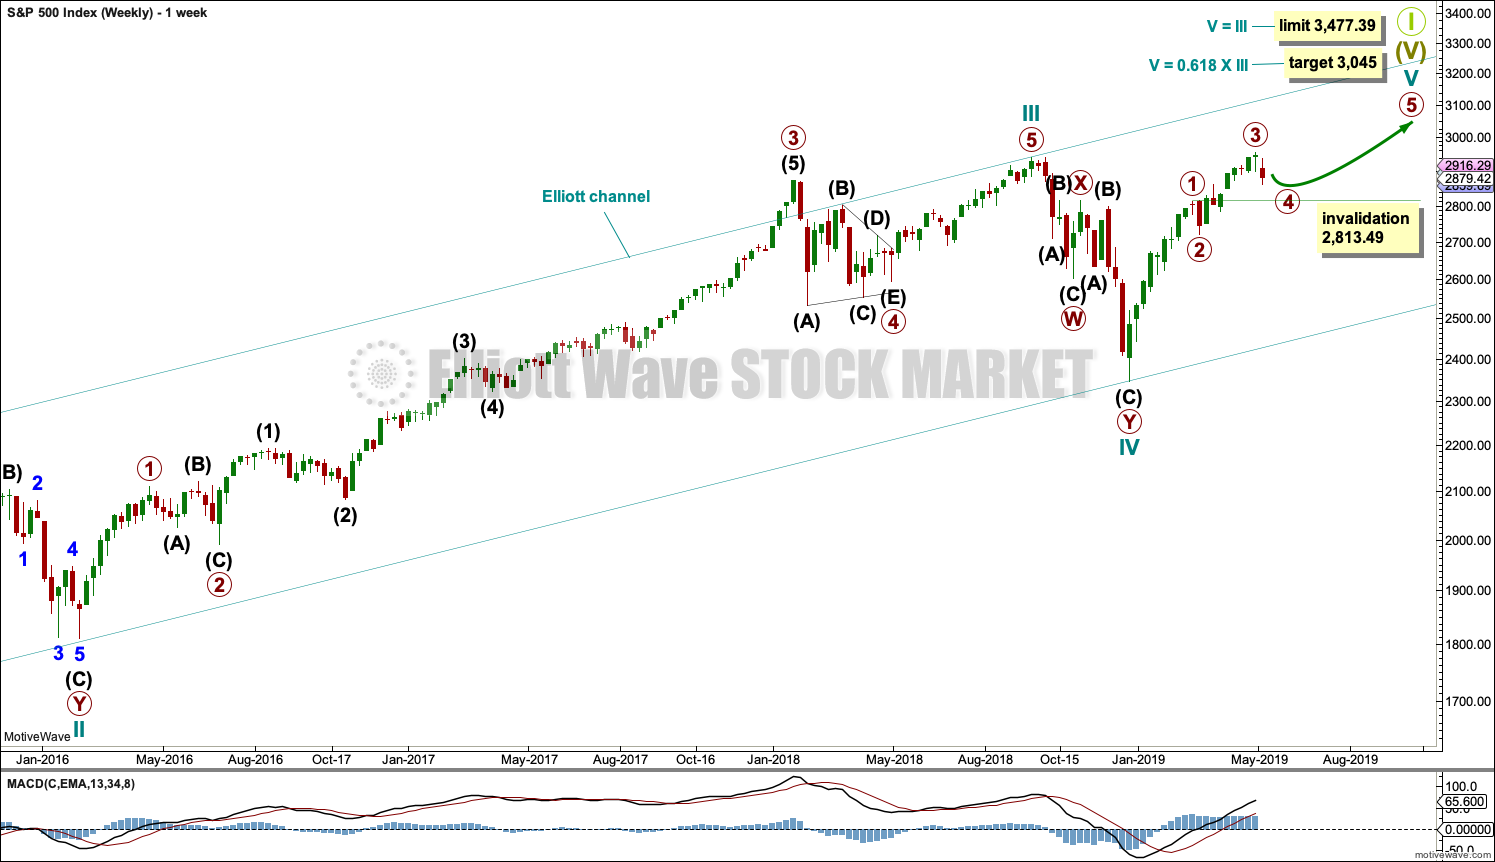
The basic Elliott wave structure consists of a five wave structure up followed by a three wave structure down (for a bull market). This wave count sees the bull market beginning in March 2009 as an incomplete five wave impulse and now within the last fifth wave, which is labelled cycle wave V. This impulse is best viewed on monthly charts. The weekly chart focusses on the end of it.
Elliott wave is fractal. This fifth wave labelled cycle wave V may end a larger fifth wave labelled Super Cycle wave (V), which may end a larger first wave labelled Grand Super Cycle wave I.
The teal Elliott channel is drawn using Elliott’s first technique about the impulse of Super Cycle wave (V). Draw the first trend line from the end of cycle wave I (off to the left of the chart, the weekly candlestick beginning 30th November 2014) to the end of cycle wave III, then place a parallel copy on the end of cycle wave II. This channel perfectly shows where cycle wave IV ended at support. The strongest portion of cycle wave III, the end of primary wave 3, overshoots the upper edge of the channel. This is a typical look for a third wave and suggests the channel is drawn correctly and the way the impulse is counted is correct.
Within Super Cycle wave (V), cycle wave III is shorter than cycle wave I. A core Elliott wave rule states that a third wave may never be the shortest. For this rule to be met in this instance, cycle wave V may not be longer in length than cycle wave III. This limit is at 3,477.39.
A final target is calculated at cycle degree for the impulse to end.
The structure of cycle wave V is focussed on at the daily chart level below.
DAILY CHART
Click chart to enlarge.
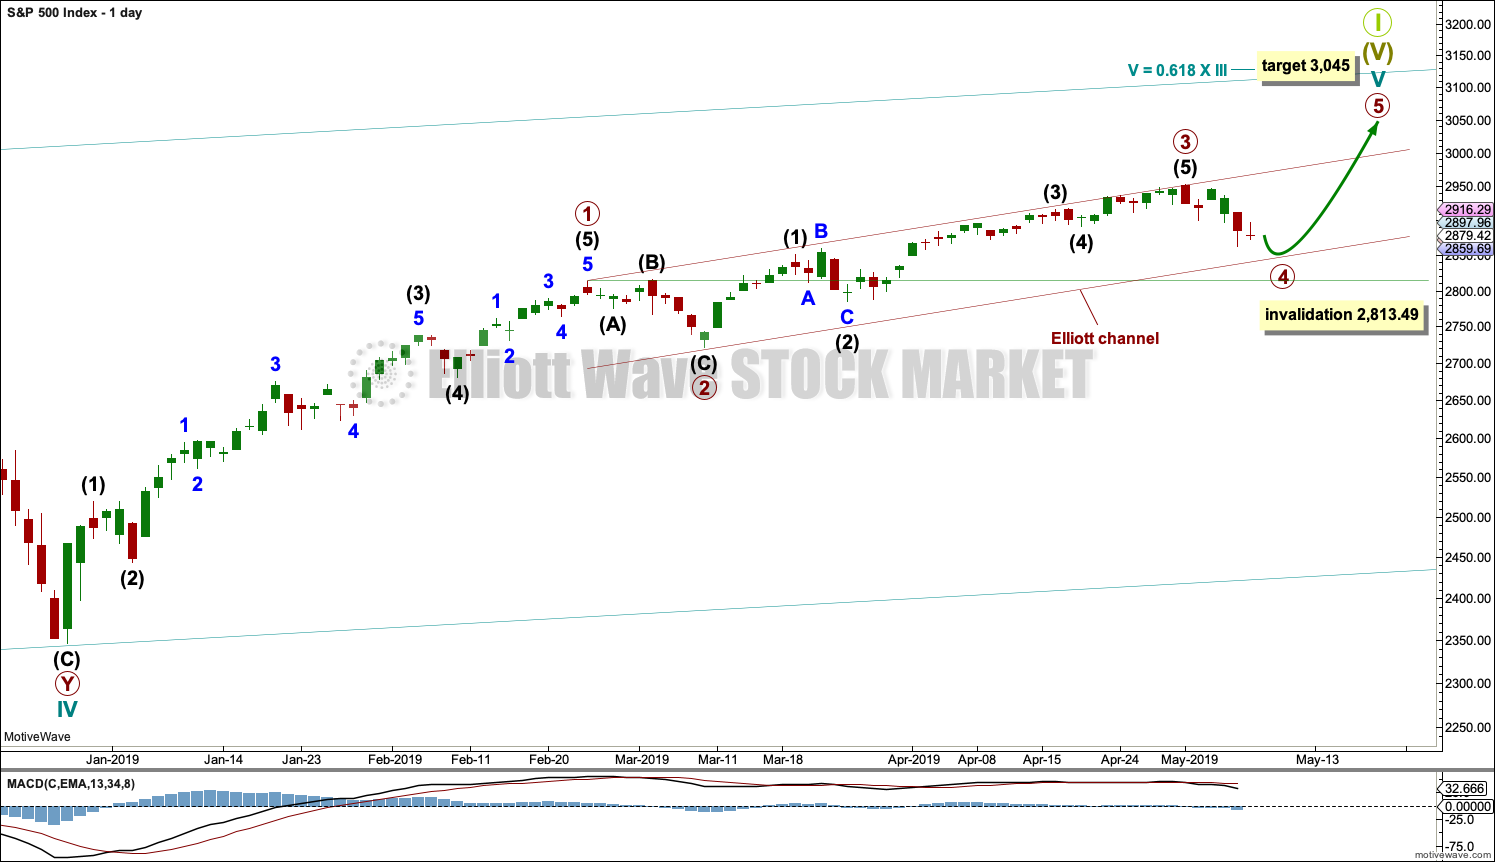
Cycle wave V so far looks to be unfolding as an impulse, which is the most common structure for a fifth wave. The only other possible structure is an ending diagonal. A diagonal would be considered only if overlapping suggests it.
Within the impulse, primary waves 1, 2 and 3 may now be complete. Primary wave 4 may currently be underway. When primary wave 4 is complete, then the final wave of primary wave 5 may continue higher.
Use Elliott’s technique to draw a channel about this impulse. Draw the first trend line from the ends of primary waves 1 to 3, then place a parallel copy on the end of primary wave 2. Look for primary wave 4 to find support at the lower edge of this channel.
Primary wave 2 unfolded as a flat correction. Primary wave 4 may be expected to exhibit alternation in structure with primary wave 2.
Primary wave 4 may not move into primary wave 1 price territory below 2,813.49.
HOURLY CHART
Click chart to enlarge.
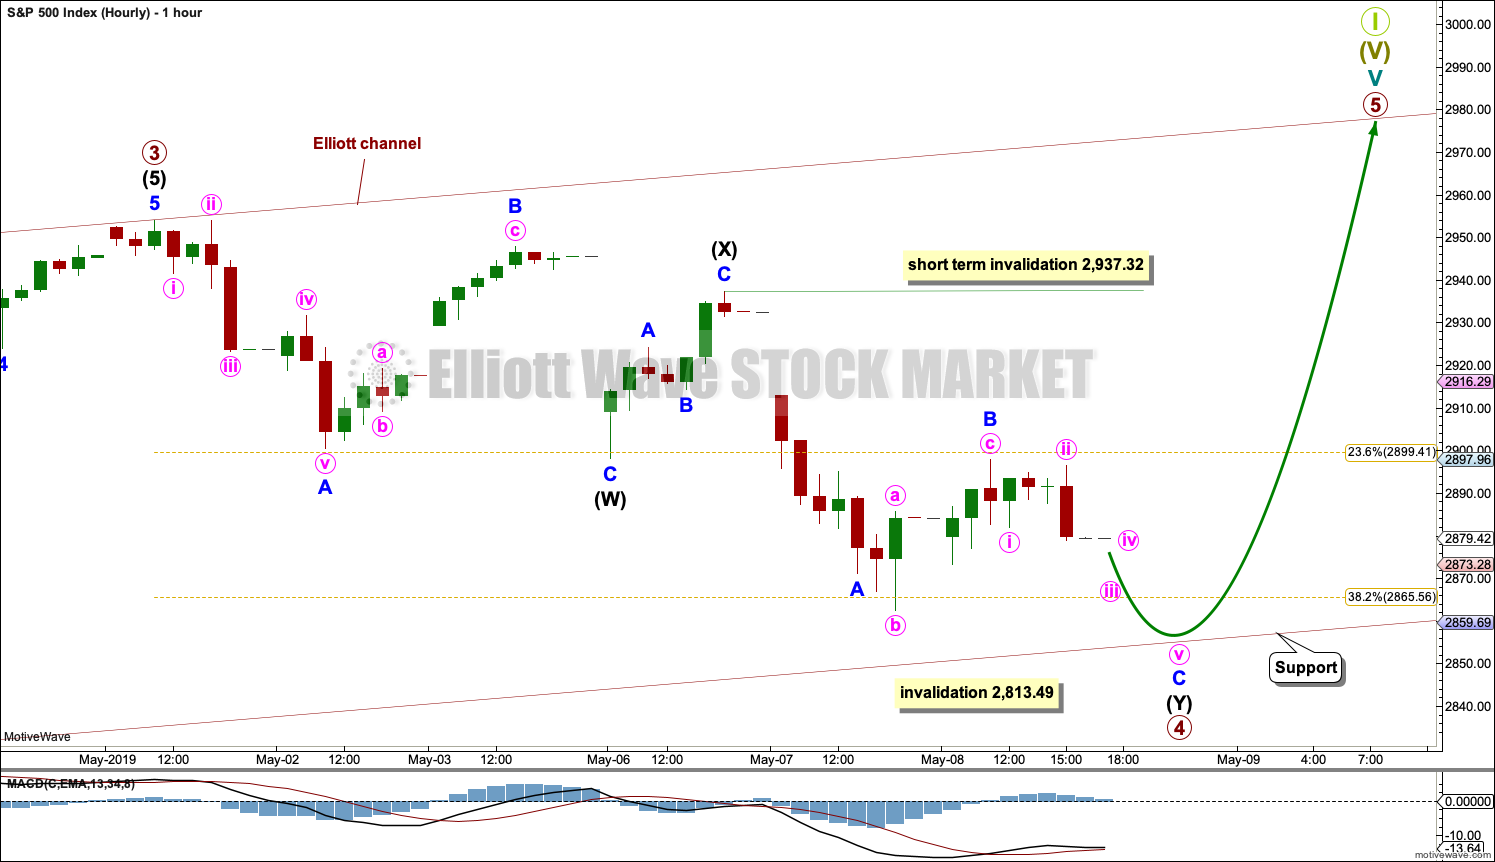
Primary wave 4 may be very close to completion as a double zigzag. A double zigzag would offer perfect alternation with the flat correction of primary wave 2.
The first zigzag in the double may be complete, labelled intermediate wave (W). The double is joined by a complete three in the opposite direction labelled intermediate wave (X). Intermediate wave (X) subdivides as a zigzag, which is the most common structure for X waves.
The second zigzag in the double may now continue lower. Within the second zigzag, minor wave B may not move beyond the start of minor wave A above 2,937.32. The second zigzag in the double is labelled intermediate wave (Y) and its purpose is to deepen the correction. It may end when price finds support about the lower edge of the maroon Elliott channel.
Primary wave 4 may not move into primary wave 1 price territory below 2,813.49.
SECOND WAVE COUNT
WEEKLY CHART
Click chart to enlarge.
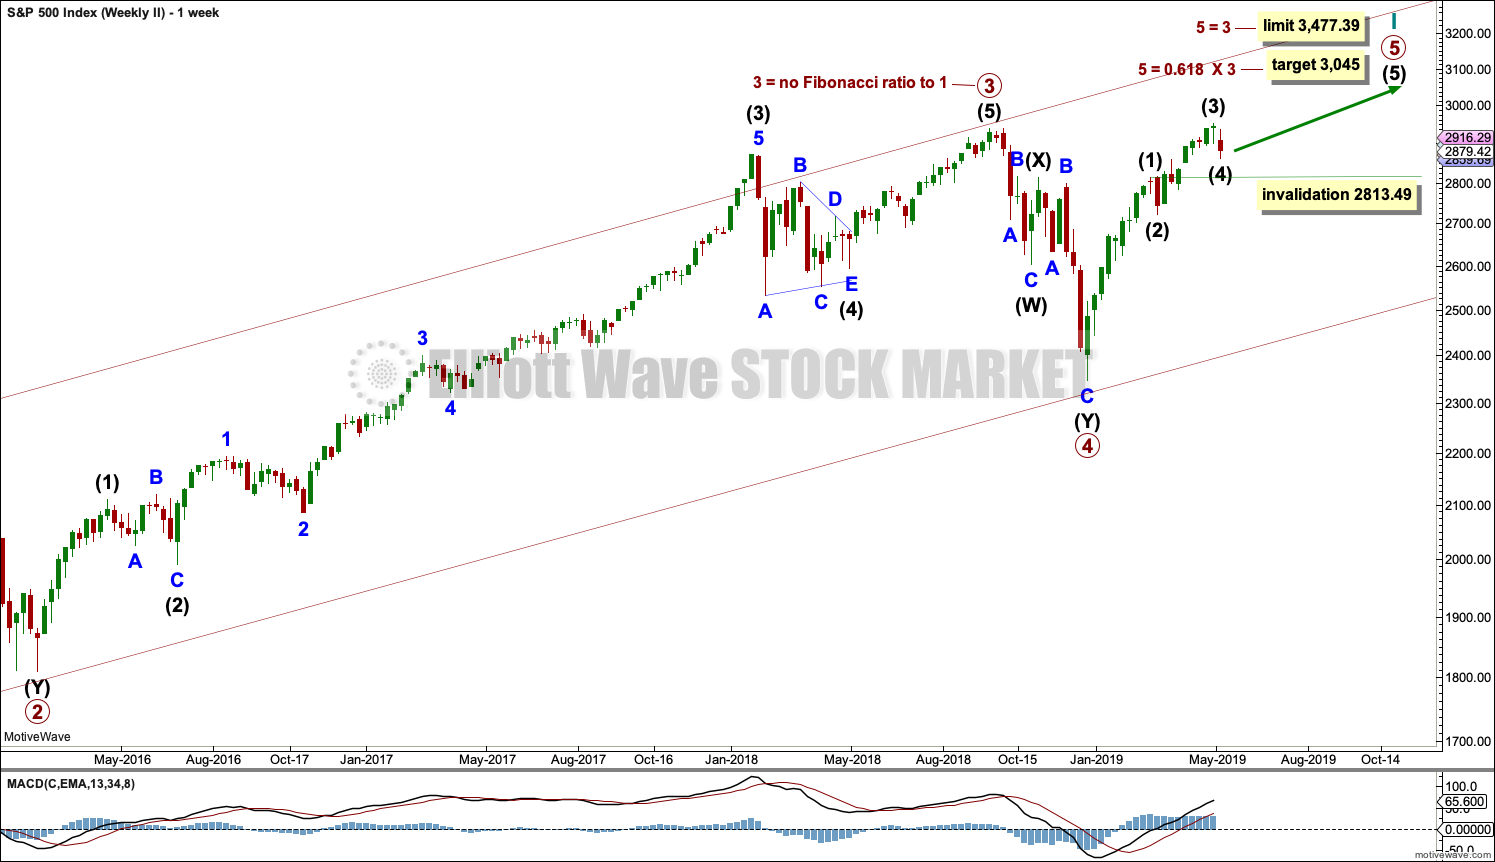
This weekly chart is identical to the first weekly chart, with the sole exception being the degree of labelling.
This weekly chart moves the degree of labelling for the impulse beginning in March 2009 all down one degree. This difference is best viewed on monthly charts.
The impulse is still viewed as nearing an end; a fifth wave is still seen as needing to complete higher. This wave count labels it primary wave 5.
TECHNICAL ANALYSIS
WEEKLY CHART
Click chart to enlarge. Chart courtesy of et=”_blank”>StockCharts.com.
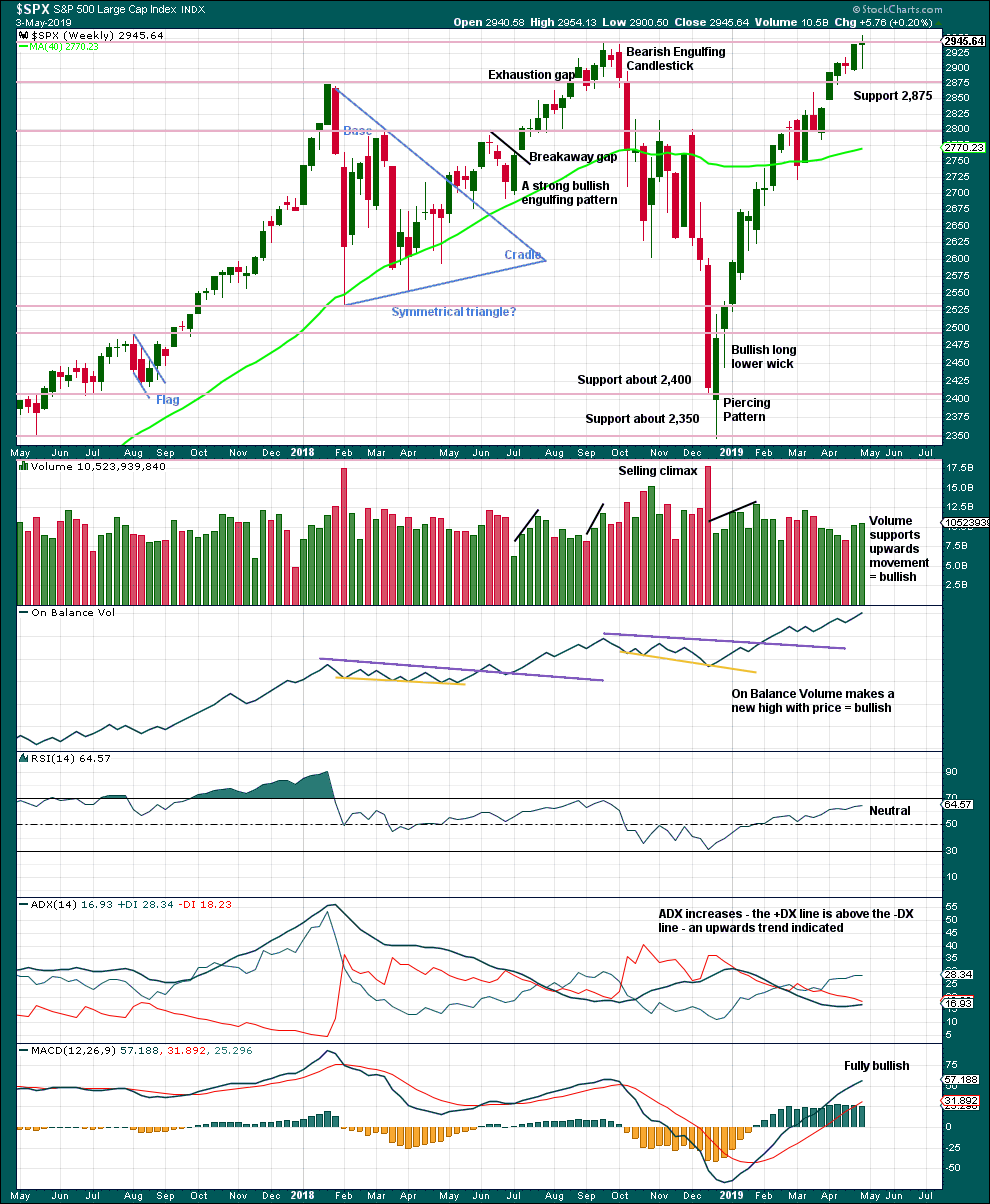
The Doji last week may represent a short pause within the upwards trend, or it may yet form part of a reversal pattern. Doji on their own are not reversal signals.
This chart remains fully bullish.
DAILY CHART
Click chart to enlarge. Chart courtesy of StockCharts.com.
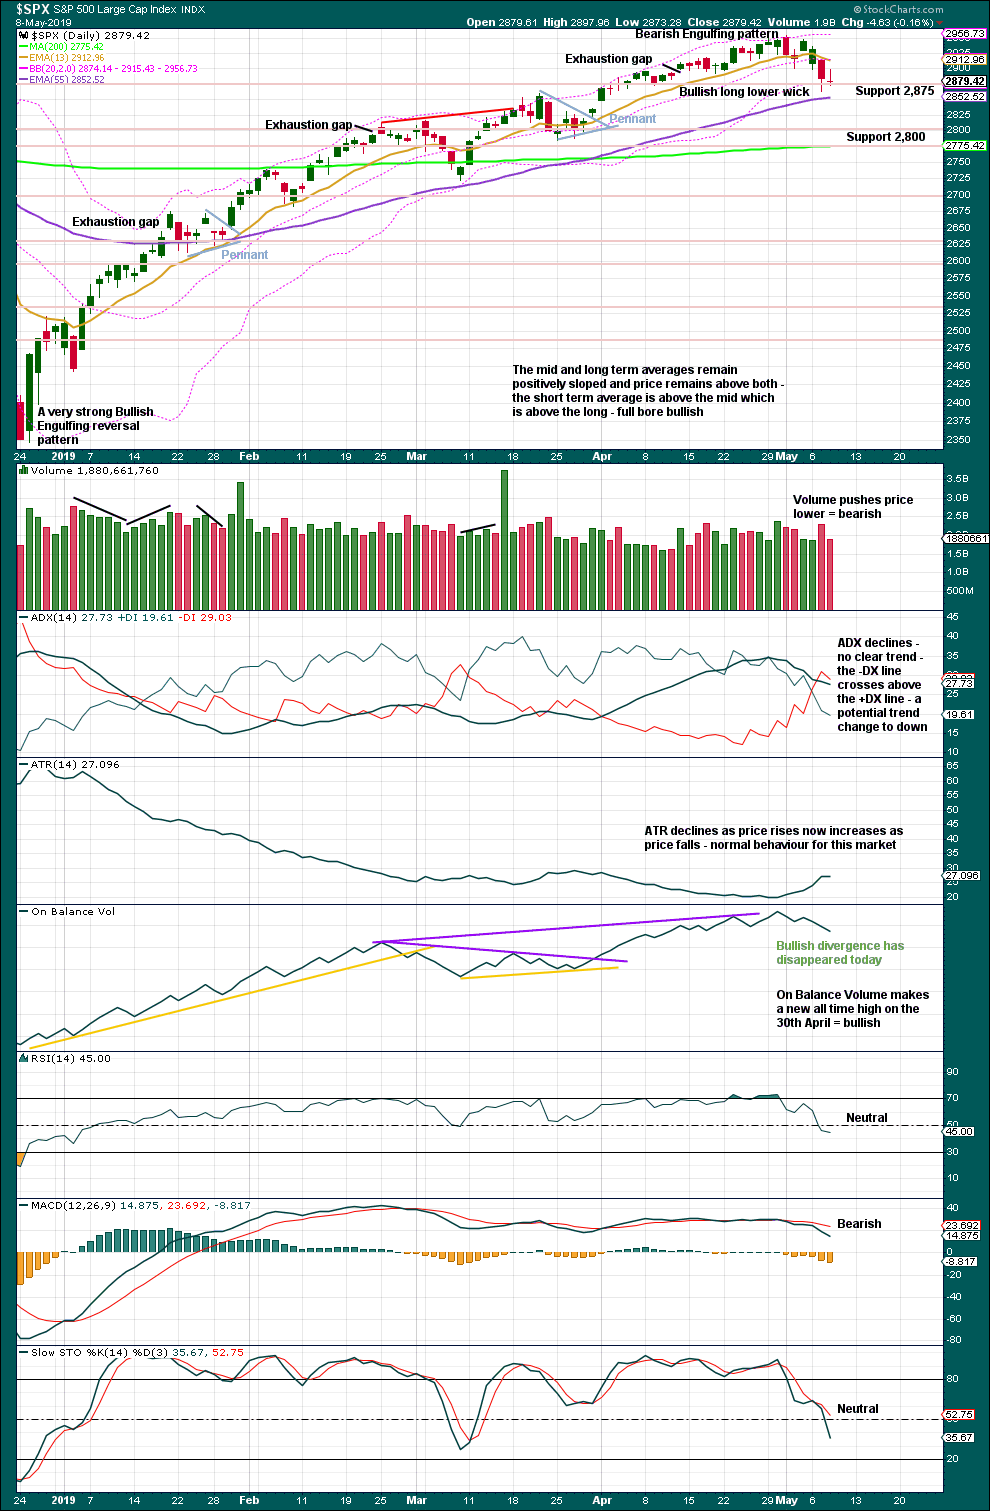
The Bearish Engulfing candlestick engulfs the two prior daily candlesticks. Coming after upwards movement, which has reached extreme, it should be given weight. This is a fairly strong bearish reversal signal.
There is support close by at 2,875.
The short-term volume profile is still judged to be bearish. Today’s Doji does not change this view.
BREADTH – AD LINE
WEEKLY CHART
Click chart to enlarge. Chart courtesy of StockCharts.com. So that colour blind members are included, bearish signals
will be noted with blue and bullish signals with yellow.
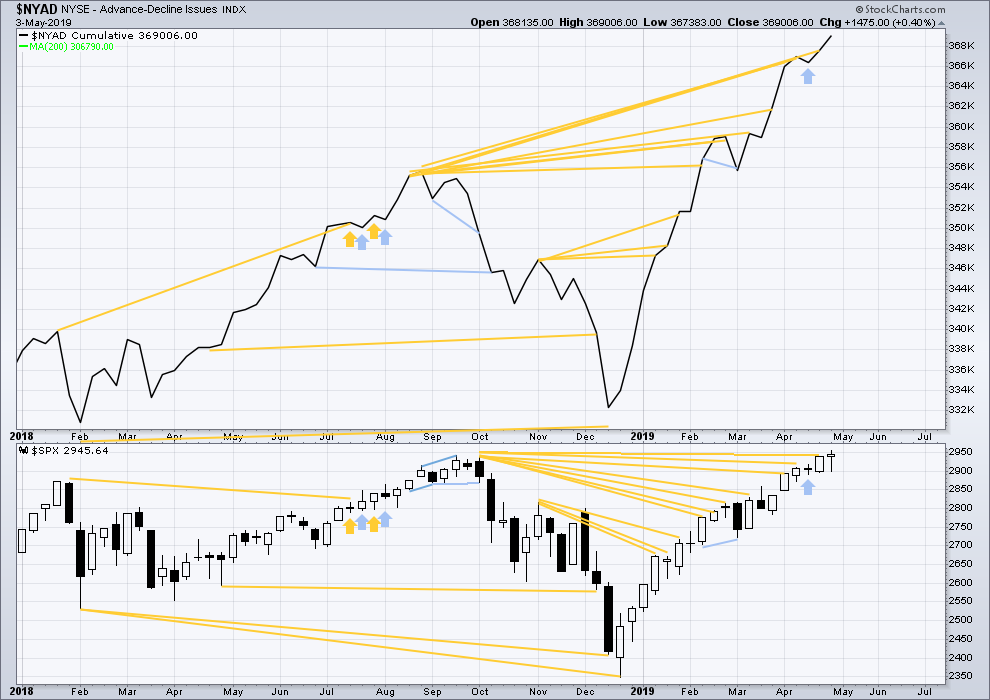
Every single bear market from the Great Depression and onwards has been preceded by a minimum of 4 months divergence between price and the AD line. With the AD line making a new all time high again last week, the end of this bull market and the start of a new bear market must be a minimum of 4 months away, which is the beginning of September 2019 at this time.
Mid-term bullish divergence has been followed by a new all time high from price and may now be resolved. There is no mid nor long-term divergence. Both price and the AD line make new all time highs.
While large caps have made a new all time high this week, mid and small caps did not and remain below their prior all time highs. This rally is led by large caps, which is typical of an ageing bull market.
DAILY CHART
Click chart to enlarge. Chart courtesy of StockCharts.com. So that colour blind members are included, bearish signals
will be noted with blue and bullish signals with yellow.
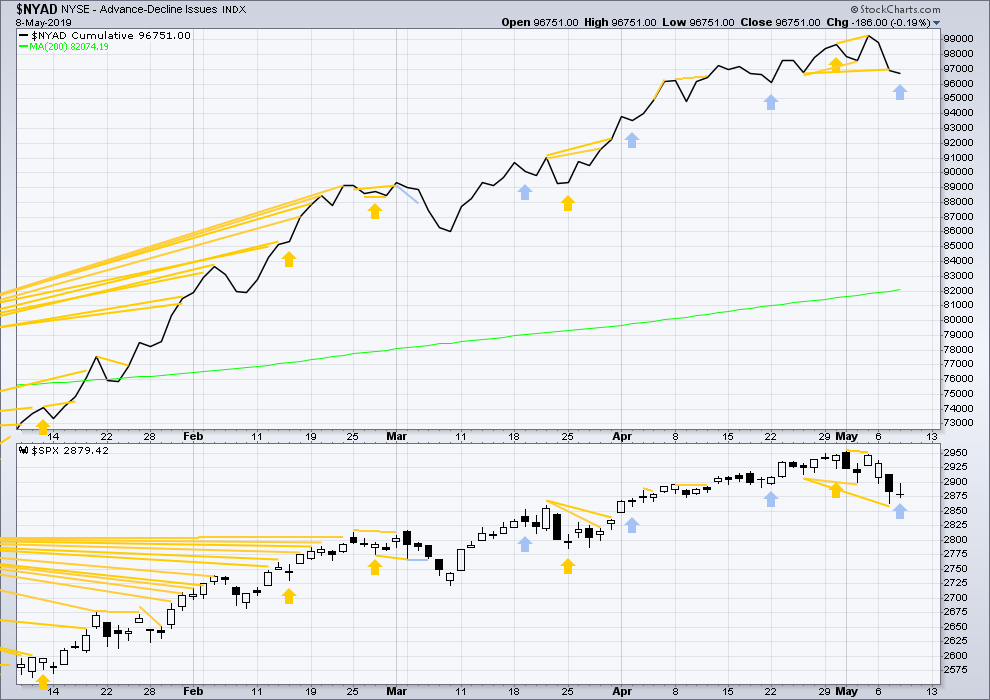
Breadth should be read as a leading indicator.
Bullish divergence noted in yesterday’s analysis has not been followed by upwards movement. It may have failed or it may be an early warning.
Today price moved sideways and the AD line has moved slightly lower. This divergence is very weak and is bearish for the very short term.
VOLATILITY – INVERTED VIX CHART
WEEKLY CHART
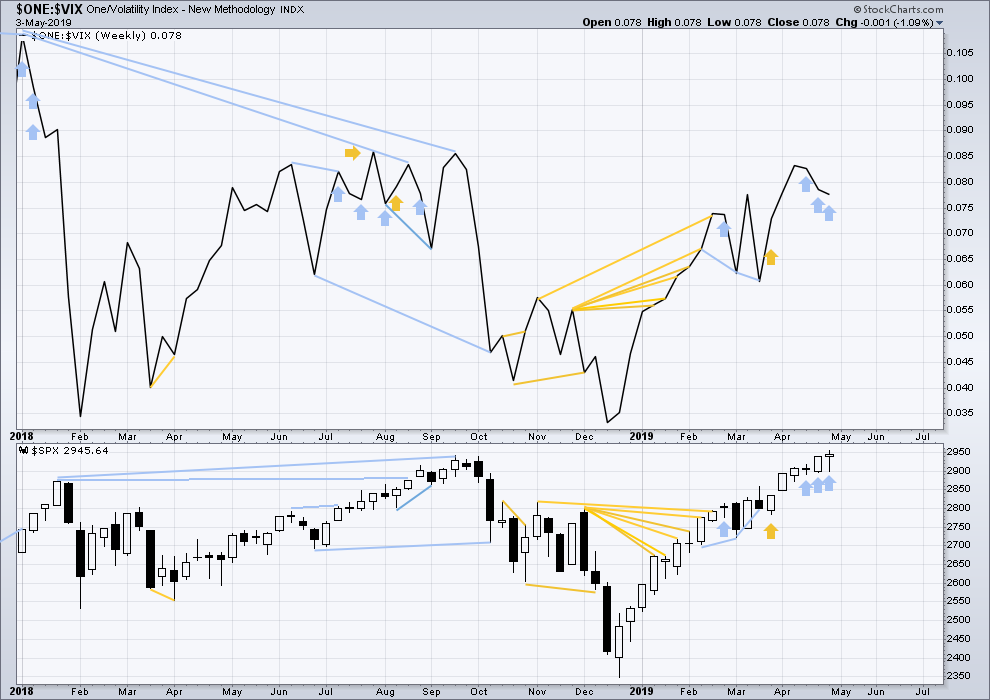
Click chart to enlarge. Chart courtesy of StockCharts.com. So that colour blind members are included, bearish signals
will be noted with blue and bullish signals with yellow.
For now three weeks in a row price has moved higher and inverted VIX has moved lower. This divergence is bearish for the short to mid term and may be warning of an approaching primary (or intermediate) degree correction.
It is noted that this has occurred before at the end of the strong rise in price up to the high on the 26th of January 2018. The three weeks up to that high saw price clearly move higher and inverted VIX clearly move lower. This divergence persisted for three weeks in that instance, and so may persist for a very few weeks again now before price turns.
DAILY CHART
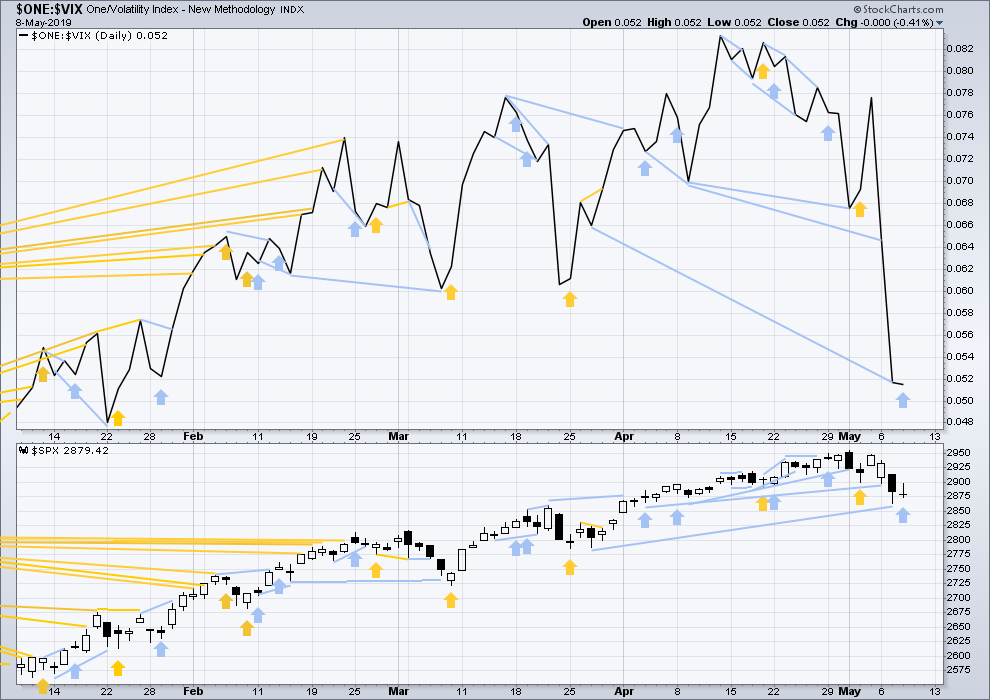
Click chart to enlarge. Chart courtesy of StockCharts.com. So that colour blind members are included, bearish signals
will be noted with blue and bullish signals with yellow.
Strong mid-term bearish divergence noted yesterday has not been followed today by downwards movement. It may have failed or it may be an early warning.
Today price moved sideways but inverted VIX has moved slightly lower. This divergence for the very short term is bearish and weak.
DOW THEORY
Dow Theory confirmed a bear market in December 2018. This does not necessarily mean a bear market at Grand Super Cycle degree though; Dow Theory makes no comment on Elliott wave counts. On the 25th of August 2015 Dow Theory also confirmed a bear market. The Elliott wave count sees that as part of cycle wave II. After Dow Theory confirmation of a bear market in August 2015, price went on to make new all time highs and the bull market continued.
DJIA: 23,344.52 – a close on the 19th of December at 23,284.97 confirms a bear market.
DJT: 9,806.79 – price has closed below this point on the 13th of December.
S&P500: 2,532.69 – a close on the 19th of December at 2,506.96 provides support to a bear market conclusion.
Nasdaq: 6,630.67 – a close on the 19th of December at 6,618.86 provides support to a bear market conclusion.
With all the indices moving now higher, Dow Theory would confirm a bull market if the following highs are made:
DJIA: 26,951.81
DJT: 11,623.58
S&P500: 2,940.91 – a new all time high has been made on the 29th of April 2019.
Nasdaq: 8,133.30 – a new high has been made on 24th of April 2019.
Published @ 8:56 p.m. EST.
—
Careful risk management protects your trading account(s).
Follow my two Golden Rules:
1. Always trade with stops.
2. Risk only 1-5% of equity on any one trade.
—
New updates to this analysis are in bold.
It’s possible now that primary wave 4 is over.
It’s also possible that today’s bounce is minute iv of minor C of intermediate (Y).
Minute iv may not overlap into minute i price territory. A new high above 2,882.05 could not be minute iv, and so at that stage minor C and so the whole structure may be over.
It is also possible that primary 4 could continue sideways in an ever decreasing range as a triangle for another week to two.
Thanks for all your updates! As a correction of the exercise that I try to solve all day.
Thanks for all that post….. very helpful to me TODAY and every day!
Ditto! This forum is fabulous 🙂
SPX one day reversal? $NYMO closed two days in a row outside it lower BB on the daily chart. Today we may have marked at least an intermediate low. IF $NYMO closes inside the lower BB today by filling the gap and going positive at the close, it will be a strong bullish signal of at least an intermediate low (days & perhaps weeks).
On the run. Gotta go!
In above, I should have said the SPX to fill the gap and go green at the close and it did not happen. $NYMO is at -48 and just below its lower BB. Strong rally none the less.
Hi Lara, any thoughts on GBTC? it seems to have lost its sense of gravity.
naw, defying gravity is what it did in Dec of 17.
i’m an amateur analyst.
that said, I see a pretty clear 1-2-3-4 and a 5 in progress on the weekly chart of GBTC. That could be an A of an ABC (first order guess). From a retracement perspective, the 23% level is about 12 and that’s where the last really significant swing high was before six more months of steadily degrading price. So I think a 12ish is a rational target for a longer term trade here. But a B could drive price back down first.
Another lookout below day today. The support must hold at the maroon lower channel line shown on Lara;s charts. It is currently around 2858. If this breaks and doesn’t recover almost immediately, my outlook may be changing from bullish to at least neutral but even perhaps bearish. It all depends on other indicators and oscillators etc. I admit to myself, I am beginning to get nervous. Sometime we need to have an iron hand on the tiller and yet, other times the best tactic is to bail immediately.
For now I’m going with Lara’s detailed structural assessment of this iv that indicates the end is very near, close to/at the lower elliott channel line.
Yes, I agree. It is an iron fist on the tiller moment. In fact, a new low today is what I projected based on the VIX 25%+ up day on Tuesday. We are entering some very oversold conditions. $NYMO – McClellan Oscillator has closed 2 days in a row below its lower BB on the daily charts and below the -40 reset point. Most often this is followed by a very strong rally. VIX has held above its upper BB for a few days. Lets see if today will mark a strong reversal off the maroon channel line bringing $NYMO and VIX back inside their BBs. We are basically on the maroon channel right now.
If a top were in, and I am not saying I think it is, but if it were, we would have a first wave down to be followed (now) by a second wave likely to retrace at least 68% of the move down.
calling the top has been a risky business for the last few years! you sure youre ready to go out on that limb??
No not at all. Of course I am now writing after the close. I am not going to try to call the top. I’ll leave that to others more astute. The projected longer term top has a long standing target by Lara of 3045. Once we hit 2950, I began the process of preparing myself for the question, “What if it happens earlier?” It would not be the first time. The October to late December time frame is a prime example. So, this is a time for me to be diligent and ready to act.
I think we now have a the circumstances that give a good chance to make a successful move through the SPX 3000 mark from here. If it goes that way, reassessment begins again at 3025 and forward. Perhaps that might be the time for me to take some money off the table.
Yesterday price sat on and flashed possible turn off a 38%. Today it’s the same story on the 50% of the same up move. So structurally “this could be it”…again. But 50% aren’t so common, and down at 2811-13 are overlapped 23% and 78% levels that would arguably provide more fractal structure for the market, and thus are “attractive” as an ultimate low of this iv. The big question obviously is what happens overnight/tomorrow? A down Friday to finish this or the first day of the next v up, continuing a bounce that starts today? I dunno. BTW this is day 3 of “daily trend strong down” per my measurement tool. The weekly trend is still showing “mild up”.
4 hour chart. Between the channel bounce combined with the clean 50% fibo bounce combined with the “complete structure” re: Lara’s hourly…I think the odds of this iv being over are reasonably high now, as in maybe 70% chance.
Hey Rodney!
im not sure, but haven’t you been long for some time? why would you be nervous if youre sitting on healthy profits? im sure just rereading your post you can see emotion creeping into your decision making. don’t let it!
Number One!
Cheers !