
A correction was expected for this week. Price remains within the channel on the daily chart as expected.
Summary: A pullback may end when price finds support at the lower edge of the maroon Elliott channel, which is drawn on both daily and hourly charts. Thereafter, the upwards trend may resume.
Today there is bullish divergence between price and both of the AD line and On Balance Volume, and bearish divergence between price and inverted VIX. More weight will be given to the AD line and On Balance Volume.
The final target remains the same at 3,045. Alternate monthly wave counts allow for a target as high as 4,119.
The biggest picture, Grand Super Cycle analysis, is here.
Monthly charts were last published here, with video here. There are two further alternate monthly charts here, with video here.
ELLIOTT WAVE COUNTS
The two Elliott wave counts below will be labelled First and Second rather than main and alternate as they may be about of even probability. When the current impulse of primary wave 5 (second wave count) or cycle wave V (first wave count) may be complete, then these two wave counts will diverge on the severity of the expected following bear market. To see an illustration of this future divergence monthly charts should be viewed.
FIRST WAVE COUNT
WEEKLY CHART
Click chart to enlarge.
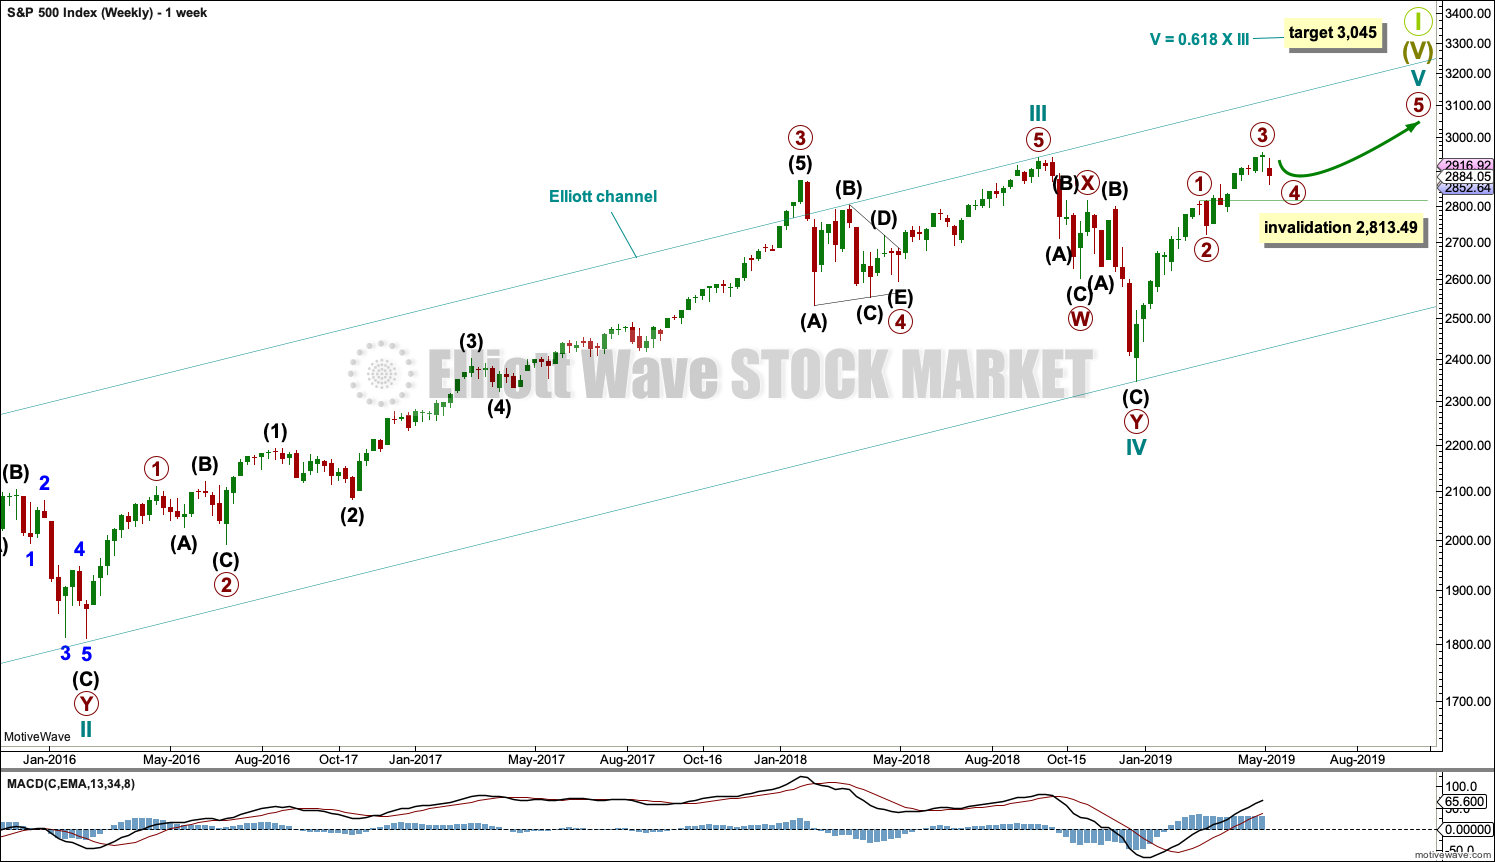
This weekly chart shows all of cycle waves III, IV and V so far.
This wave count expects that when cycle wave V completes Super Cycle wave (V) and Grand Super Cycle wave I, that a huge bear market to potentially last decades may begin. It should move substantially below 666.79.
Cycle wave II fits as a time consuming double combination: flat – X – zigzag. Combinations tend to be more time consuming corrective structures than zigzags. Cycle wave IV has completed as a multiple zigzag that should be expected to be more brief than cycle wave II.
Cycle wave IV may have ended at the lower edge of the Elliott channel.
Within cycle wave V, primary waves 1 through to 3 may now be complete. Primary wave 4 may not move into primary wave 1 price territory below 2,813.49.
Although both cycle waves II and IV are labelled W-X-Y, they are different corrective structures. There are two broad groups of Elliott wave corrective structures: the zigzag family, which are sharp corrections, and all the rest, which are sideways corrections. Multiple zigzags belong to the zigzag family and combinations belong to the sideways family. There is perfect alternation between the possible double zigzag of cycle wave IV and the combination of cycle wave II.
Although there is gross disproportion between the duration of cycle waves II and IV, the size of cycle wave IV in terms of price makes these two corrections look like they should be labelled at the same degree. Proportion is a function of either or both of price and time.
Draw the Elliott channel about Super Cycle wave (V) with the first trend line from the end of cycle wave I (at 2,079.46 on the week beginning 30th November 2014) to the high of cycle wave III, then place a parallel copy on the low of cycle wave II. Cycle wave V may find resistance about the upper edge.
It is possible that cycle wave V may end in October 2019. If it does not end there, or if the AD line makes new all time highs during or after June 2019, then the expectation for cycle wave V to end would be pushed out to March 2020 as the next possibility. Thereafter, the next possibility may be October 2020. March and October are considered as likely months for a bull market to end as in the past they have been popular. That does not mean though that this bull market may not end during any other month.
DAILY CHART
Click chart to enlarge.
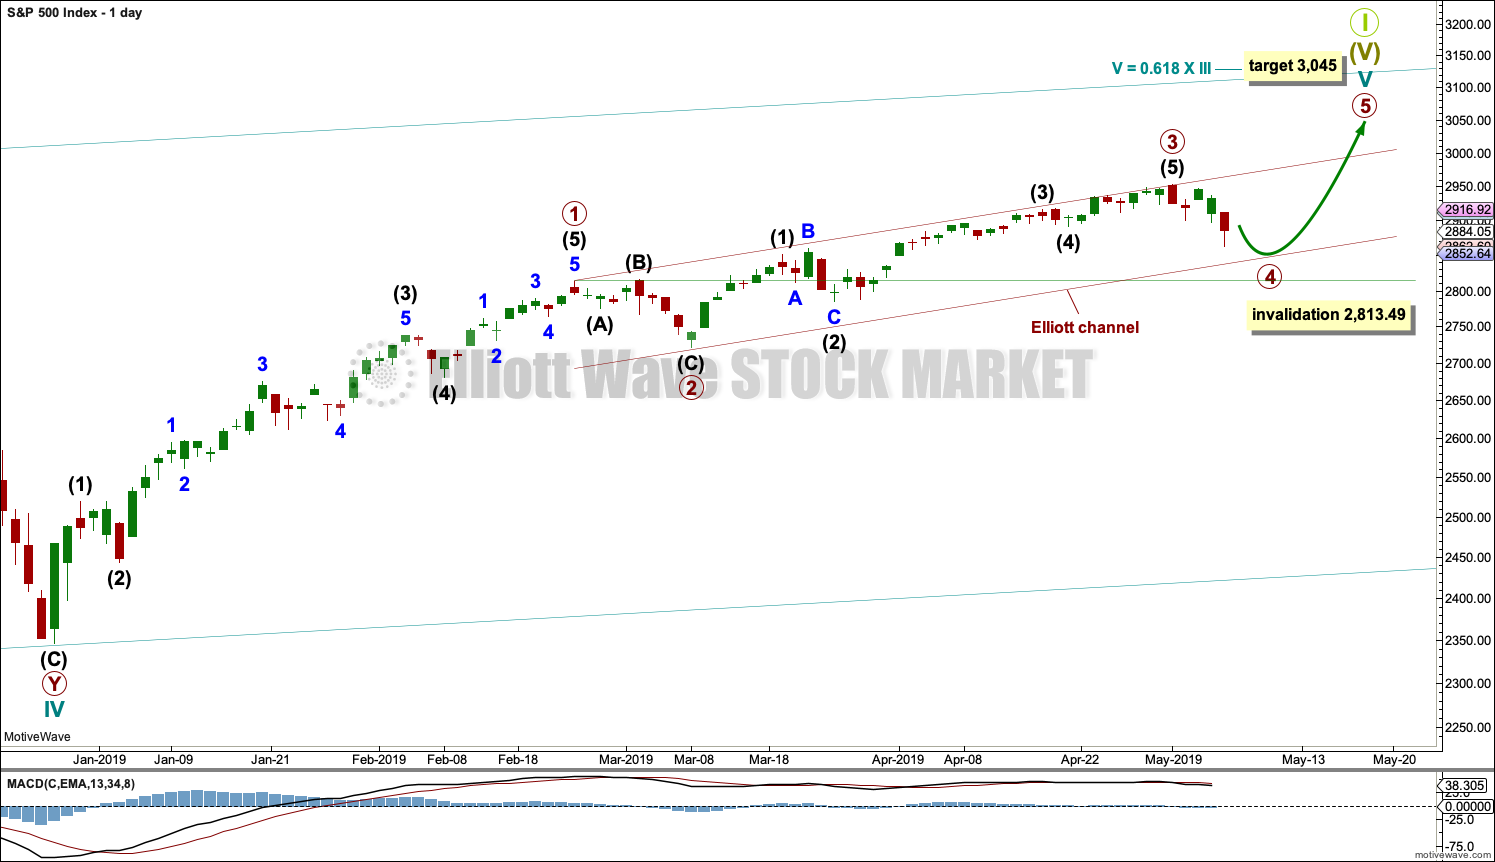
The daily chart will focus on the structure of cycle wave V.
Cycle wave V must subdivide as a five wave motive structure, either an impulse or an ending diagonal. An impulse is much more common and that will be how it is labelled. A diagonal would be considered if overlapping suggests it.
Primary wave 1 may have been a long extension, a smaller fractal of cycle wave I on the monthly chart.
Primary wave 2 may have been a very brief and shallow expanded flat correction, lasting just short of two weeks.
Primary wave 3 may be complete. It exhibits no Fibonacci ratio to primary wave 1 and is shorter than primary wave 1. This limits primary wave 5 to no longer than equality in length with primary wave 3 at 231.86 points.
Primary wave 4 may be expected to exhibit alternation with primary wave 2. Primary wave 4 may subdivide as any one of more than 23 possible corrective Elliott wave structures. The least likely structure would be a flat correction. The most likely structures would be a zigzag, multiple zigzag, combination or triangle. The labelling within primary wave 4 may change as it unfolds. At this stage, it looks like primary wave 4 may be an almost complete double zigzag. It may end when price finds support at the lower edge of the maroon Elliott channel.
A channel is drawn using Elliott’s first technique about the impulse of cycle wave V. Draw the first trend line from the ends of primary waves 1 to 3, then place a parallel copy on the end of primary wave 2. If it is long lasting enough, primary wave 4 may find support about the lower edge of this channel.
Primary wave 4 may not move into primary wave 1 price territory below 2,813.49.
HOURLY CHART
Click chart to enlarge.
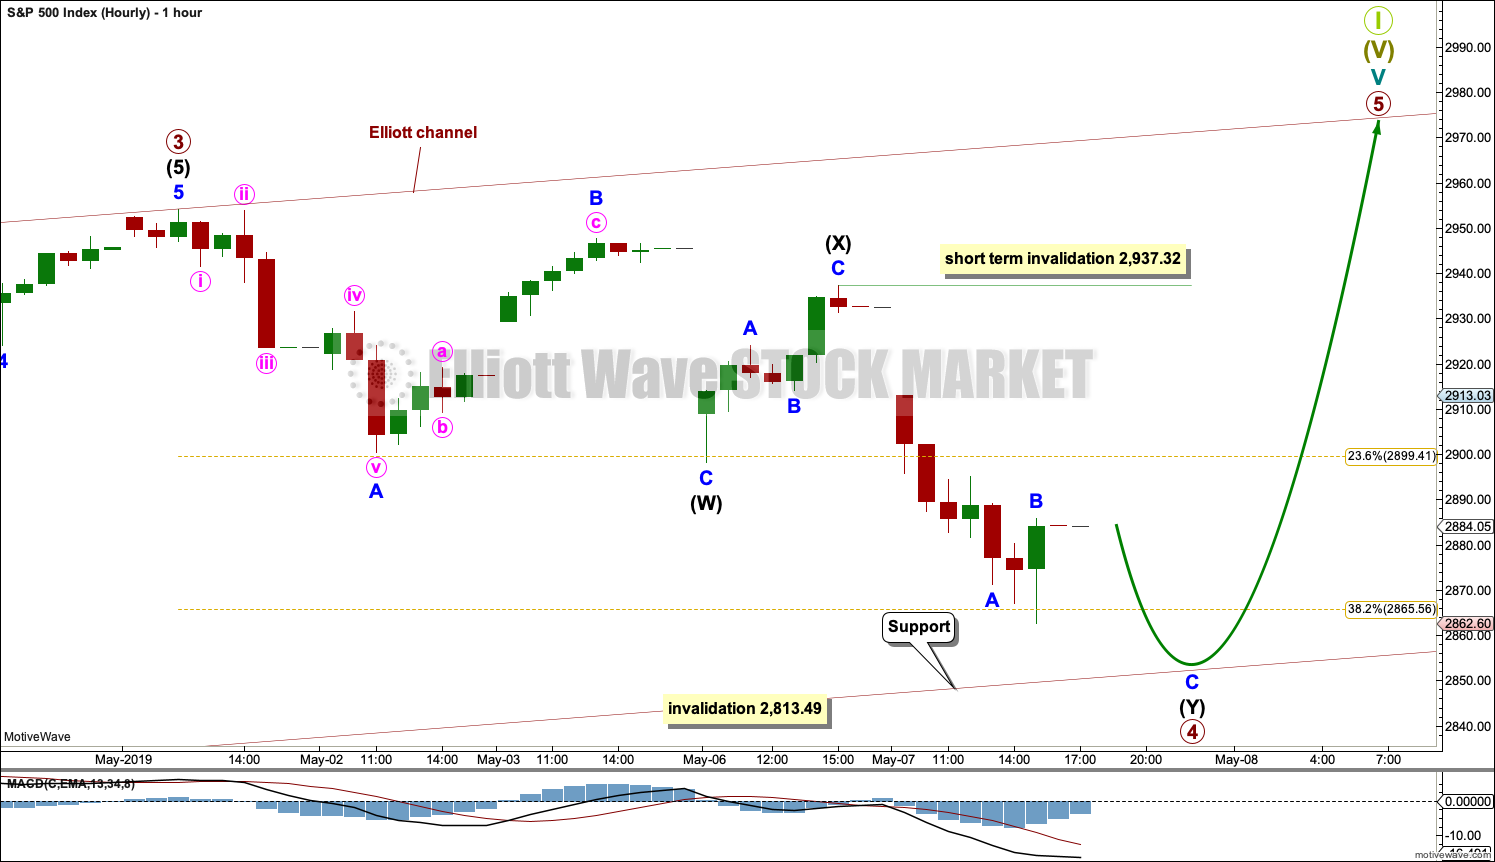
Primary wave 4 may be very close to completion as a double zigzag.
The first zigzag in the double may be complete, labelled intermediate wave (W). The double is joined by a complete three in the opposite direction labelled intermediate wave (X). Intermediate wave (X) subdivides as a zigzag, which is the most common structure for X waves.
The second zigzag in the double may now continue lower. Within the second zigzag, minor wave B may not move beyond the start of minor wave A above 2,937.32. The second zigzag in the double is labelled intermediate wave (Y) and its purpose is to deepen the correction. It may end when price finds support about the lower edge of the maroon Elliott channel.
Primary wave 4 may not move into primary wave 1 price territory below 2,813.49.
SECOND WAVE COUNT
WEEKLY CHART
Click chart to enlarge.
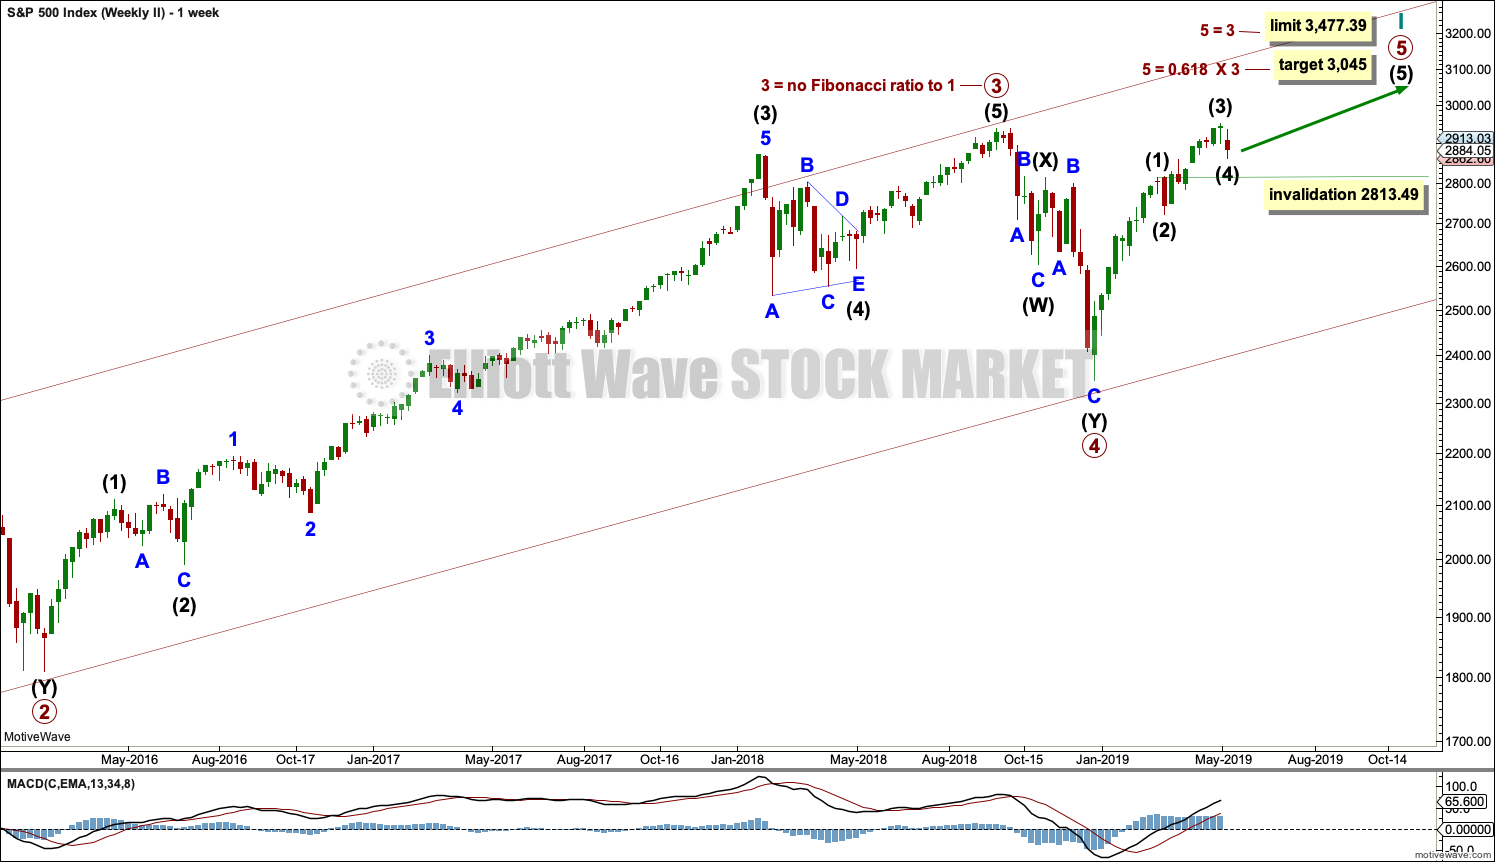
This weekly chart is identical to the first weekly chart, with the sole difference being the degree of labelling.
When cycle wave I is complete, then cycle wave II should meet the technical definition of a bear market as it should retrace more than 20% of cycle wave I, but it may end about either the 0.382 or 0.618 Fibonacci Ratios of cycle wave I. Cycle wave II may end close to the low of primary wave 2 within cycle wave I, which is at 1,810.10.
Thereafter, a new bull market for cycle wave III may begin. It should have support from volume and fundamentals.
The end of Grand Super Cycle wave I may be about 10 years or so away.
TECHNICAL ANALYSIS
WEEKLY CHART
Click chart to enlarge. Chart courtesy of et=”_blank”>StockCharts.com.
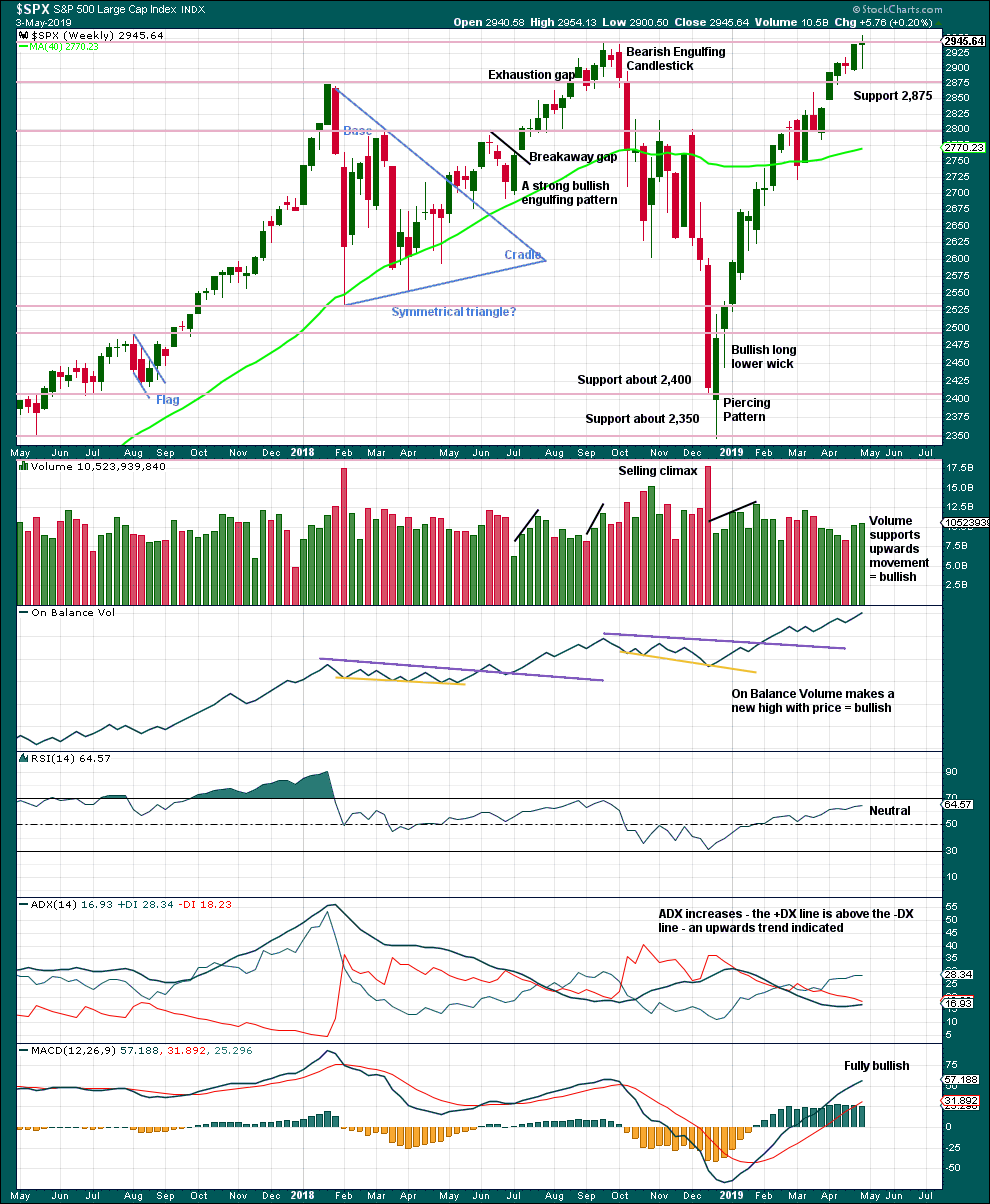
The Doji last week may represent a short pause within the upwards trend, or it may yet form part of a reversal pattern. Doji on their own are not reversal signals.
This chart remains fully bullish.
DAILY CHART
Click chart to enlarge. Chart courtesy of StockCharts.com.
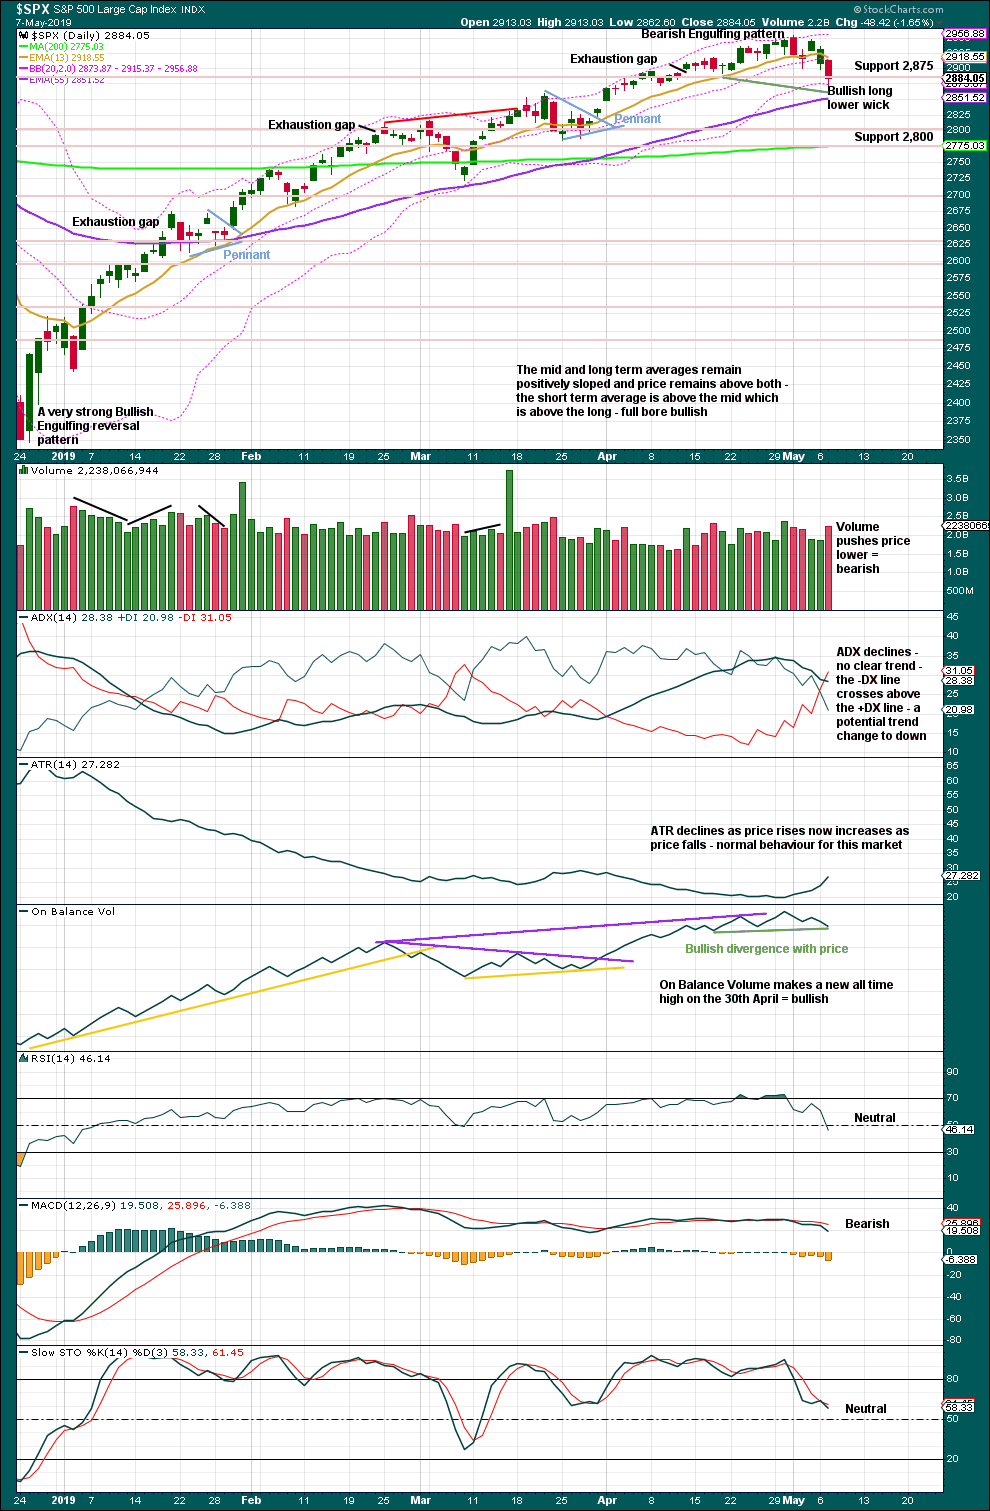
The Bearish Engulfing candlestick engulfs the two prior daily candlesticks. Coming after upwards movement, which has reached extreme, it should be given weight. This is a fairly strong bearish reversal signal.
There is support close by at 2,875.
Strong volume pushing price lower today suggests the pullback is incomplete. Expect more downwards movement here. Next support is about 2,875 and below that about 2,800.
BREADTH – AD LINE
WEEKLY CHART
Click chart to enlarge. Chart courtesy of StockCharts.com. So that colour blind members are included, bearish signals
will be noted with blue and bullish signals with yellow.
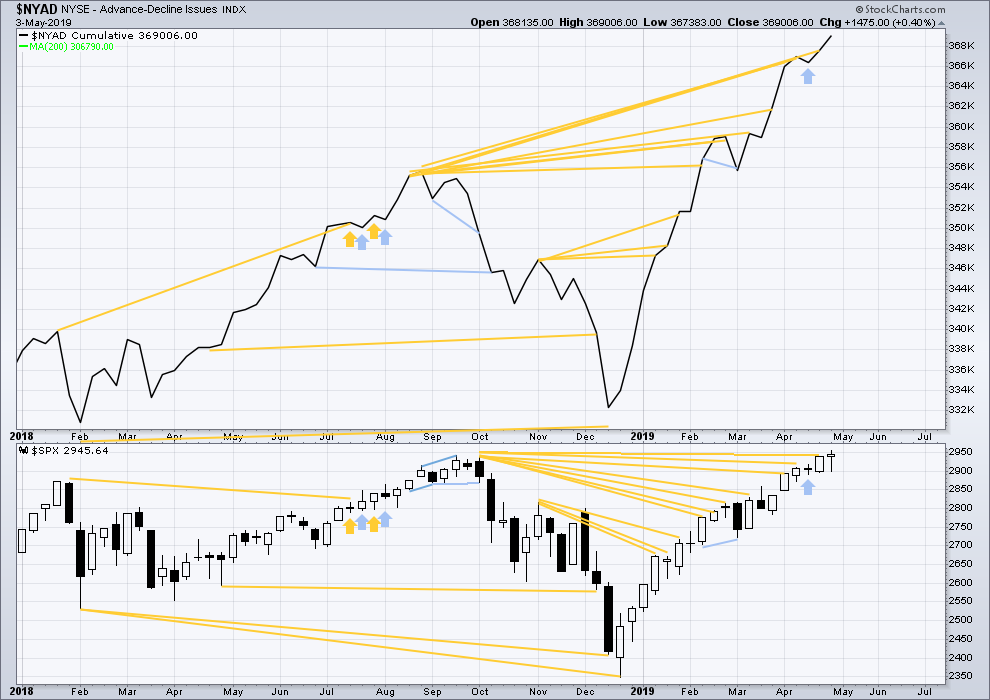
Every single bear market from the Great Depression and onwards has been preceded by a minimum of 4 months divergence between price and the AD line. With the AD line making a new all time high again last week, the end of this bull market and the start of a new bear market must be a minimum of 4 months away, which is the beginning of September 2019 at this time.
Mid-term bullish divergence has been followed by a new all time high from price and may now be resolved. There is no mid nor long-term divergence. Both price and the AD line make new all time highs.
While large caps have made a new all time high this week, mid and small caps did not and remain below their prior all time highs. This rally is led by large caps, which is typical of an ageing bull market.
DAILY CHART
Click chart to enlarge. Chart courtesy of StockCharts.com. So that colour blind members are included, bearish signals
will be noted with blue and bullish signals with yellow.
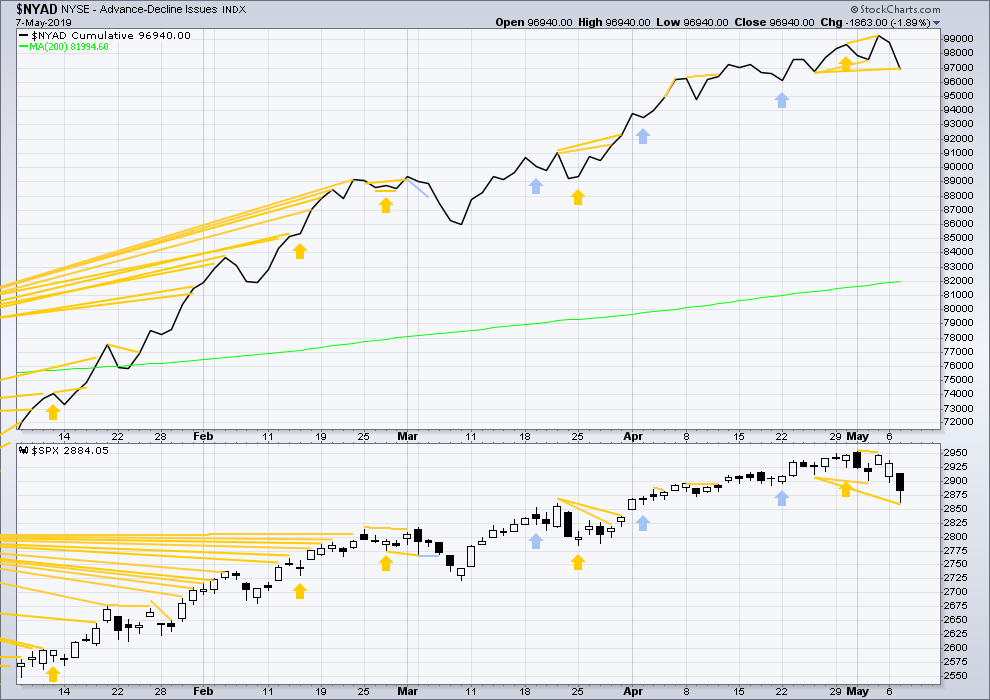
Breadth should be read as a leading indicator.
Today price has made a new swing low below the prior low of the 25th of April, but the AD line has not. Downwards movement lacks support from a corresponding decline in breadth. This divergence is bullish and supports the view that this is a pullback within an ongoing bullish trend.
VOLATILITY – INVERTED VIX CHART
WEEKLY CHART
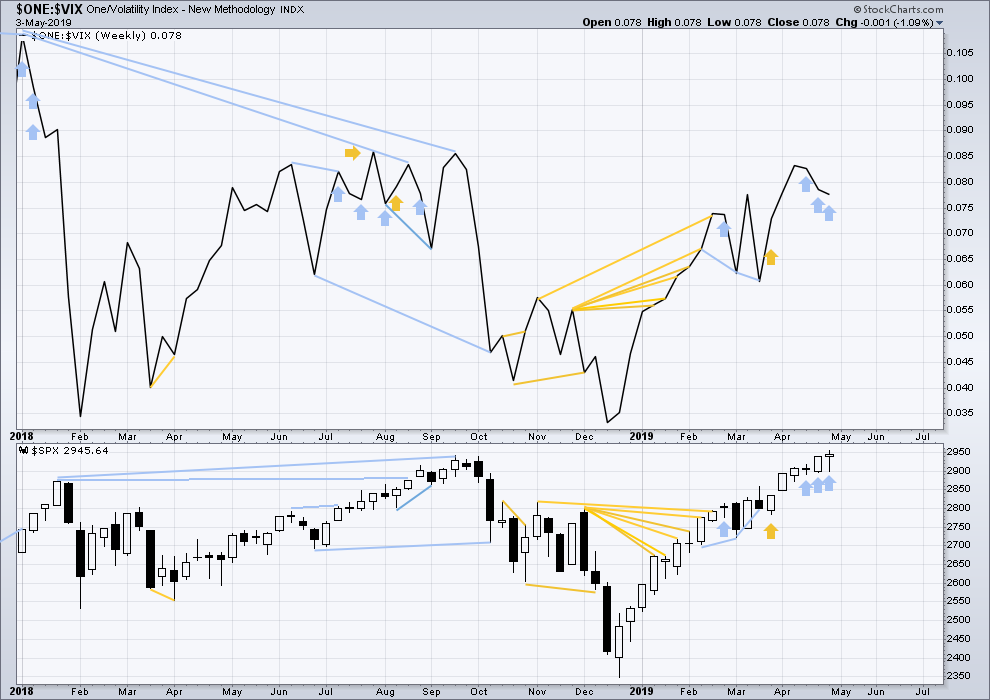
Click chart to enlarge. Chart courtesy of StockCharts.com. So that colour blind members are included, bearish signals
will be noted with blue and bullish signals with yellow.
For now three weeks in a row price has moved higher and inverted VIX has moved lower. This divergence is bearish for the short to mid term and may be warning of an approaching primary (or intermediate) degree correction.
It is noted that this has occurred before at the end of the strong rise in price up to the high on the 26th of January 2018. The three weeks up to that high saw price clearly move higher and inverted VIX clearly move lower. This divergence persisted for three weeks in that instance, and so may persist for a very few weeks again now before price turns.
DAILY CHART
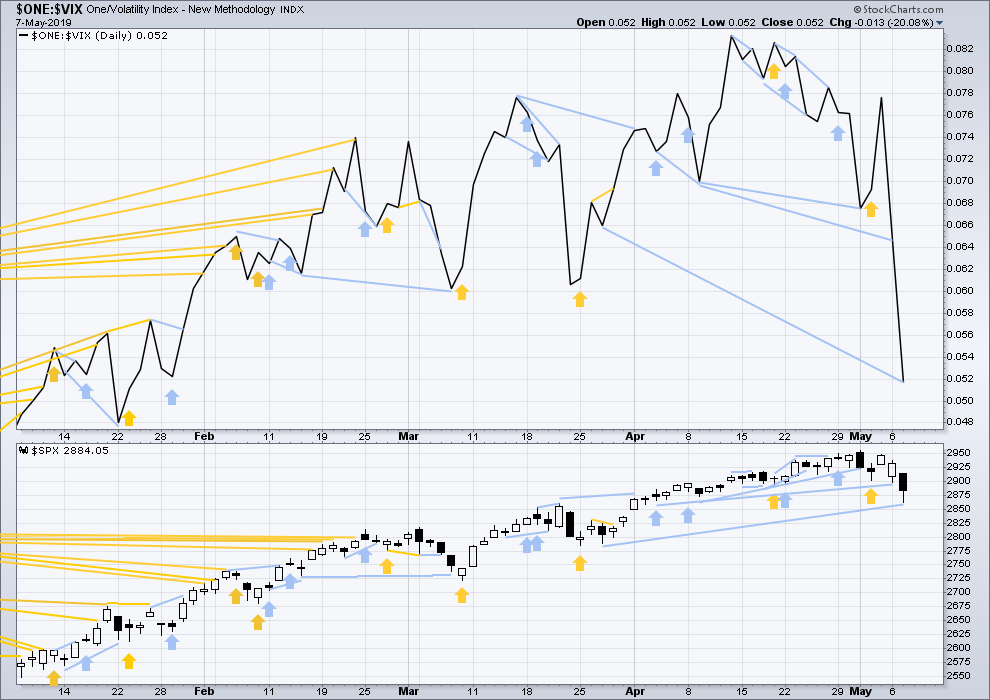
Click chart to enlarge. Chart courtesy of StockCharts.com. So that colour blind members are included, bearish signals
will be noted with blue and bullish signals with yellow.
Today inverted VIX has made a new low below the prior low of the 27th of March, but price has not. This bearish divergence is strong for the mid term.
DOW THEORY
Dow Theory confirmed a bear market in December 2018. This does not necessarily mean a bear market at Grand Super Cycle degree though; Dow Theory makes no comment on Elliott wave counts. On the 25th of August 2015 Dow Theory also confirmed a bear market. The Elliott wave count sees that as part of cycle wave II. After Dow Theory confirmation of a bear market in August 2015, price went on to make new all time highs and the bull market continued.
DJIA: 23,344.52 – a close on the 19th of December at 23,284.97 confirms a bear market.
DJT: 9,806.79 – price has closed below this point on the 13th of December.
S&P500: 2,532.69 – a close on the 19th of December at 2,506.96 provides support to a bear market conclusion.
Nasdaq: 6,630.67 – a close on the 19th of December at 6,618.86 provides support to a bear market conclusion.
With all the indices moving now higher, Dow Theory would confirm a bull market if the following highs are made:
DJIA: 26,951.81
DJT: 11,623.58
S&P500: 2,940.91 – a new all time high has been made on the 29th of April 2019.
Nasdaq: 8,133.30 – a new high has been made on 24th of April 2019.
Published @ 9:34 p.m. EST.
—
Careful risk management protects your trading account(s).
Follow my two Golden Rules:
1. Always trade with stops.
2. Risk only 1-5% of equity on any one trade.
—
New updates to this analysis are in bold.
Good morning everybody. Hourly chart updated:
Minor B looks to have moved higher today, of the count of a double ZZ is correct.
The count still needs minor C to move below the end of minor A to avoid a truncation, and likely come to end at the lower edge of the maroon Elliott channel. That may happen tomorrow.
So…. I see the (b) triangle completing of the B
Should get the (c) up here
And then C down tomorrow?
looks better on the RUT
?
nope
Don’t know.
I do see the lower channel line and I’d say there’s probably some market attraction to kissing it to define it again then a little buying spree. But I also see the current low as a quality pivot, very much in line structurally with what’s we’ve been getting for months. So like every analyst says…could go up, could go down! Lol!!!
Appreciate all the info Kevin, I checked earlier and was afraid the gang was not here
oil has now tapped and turned 3x on the 23.6% retrace level (/CL, 61.0). I’m rather expecting many days here of consolidation on top of this level.
AMD is forming a “cup and handle” structure on the daily. The handle length is now just about the typical high-low periodicity I see on this chart, i.e, a low is due here. Price has tagged and turned off the lower volatility band (purple). And while it’s not on this chart, there’s a volatility squeeze on as well. Lastly, AMD has strong fundamentals. There’s potential here.
in a completely different space…but AAL on the daily chart has very similar structural properties. cup w/handle, some nice shake out moves in the handle, a tightening price range and diminishing volume. Dropping oil should boost airline profits. One to watch, I have an alarm at AAL>35.
CYBR looks very good to me. Strongly and consistently trending up (though daily trend is current assessed as neutral), strong fundamentals, 8 days now of flat top consolidation action with volume withering away: a potential high momentum price break out set up. MACD has been slowly declining throughout the channel move shown, and a spike in momentum/MACD and a move up and away from the 21 ema (blue line) kind of makes sense to me here. I’m long and will consider adding a bit on the start of such a break out (above 131).
#1
Time for a lower low?
I am guessing a one or two day bounce off yesterday’s low followed by a new low. This is a critical juncture for the SPX. We have made a new ATH recently and that is where major tops begin, at ATHs. I don’t want to see us go much lower nor spend a lot of time at the lows. Time to be vigilant remembering October 2018 in the rear view mirror.
Have a good day all. I am on the road today.
This down move is almost exactly the length now of the early March down move (solid white line projected from the 5/1 high).
Symmetry is very popular in SPX. It’s also at the 38% retrace of the 3/8 low to 5/1 high move, so it’s a solid fractal low. It may hold.