
For the very short term, a little downwards movement to 2,894 and at least below 2,900.50 was expected to begin the week. The low for Monday at 2,898.21 fits the expectation reasonably well. Price remains range bound.
Summary: A consolidation may continue sideways for this week and possibly next as well. Within the consolidation, it is possible tomorrow that price may make another new all time high.
The final target remains the same at 3,045. Alternate monthly wave counts allow for a target as high as 4,119.
The biggest picture, Grand Super Cycle analysis, is here.
Monthly charts were last published here, with video here. There are two further alternate monthly charts here, with video here.
ELLIOTT WAVE COUNTS
The two Elliott wave counts below will be labelled First and Second rather than main and alternate as they may be about of even probability. When the current impulse of primary wave 5 (second wave count) or cycle wave V (first wave count) may be complete, then these two wave counts will diverge on the severity of the expected following bear market. To see an illustration of this future divergence monthly charts should be viewed.
FIRST WAVE COUNT
WEEKLY CHART
Click chart to enlarge.
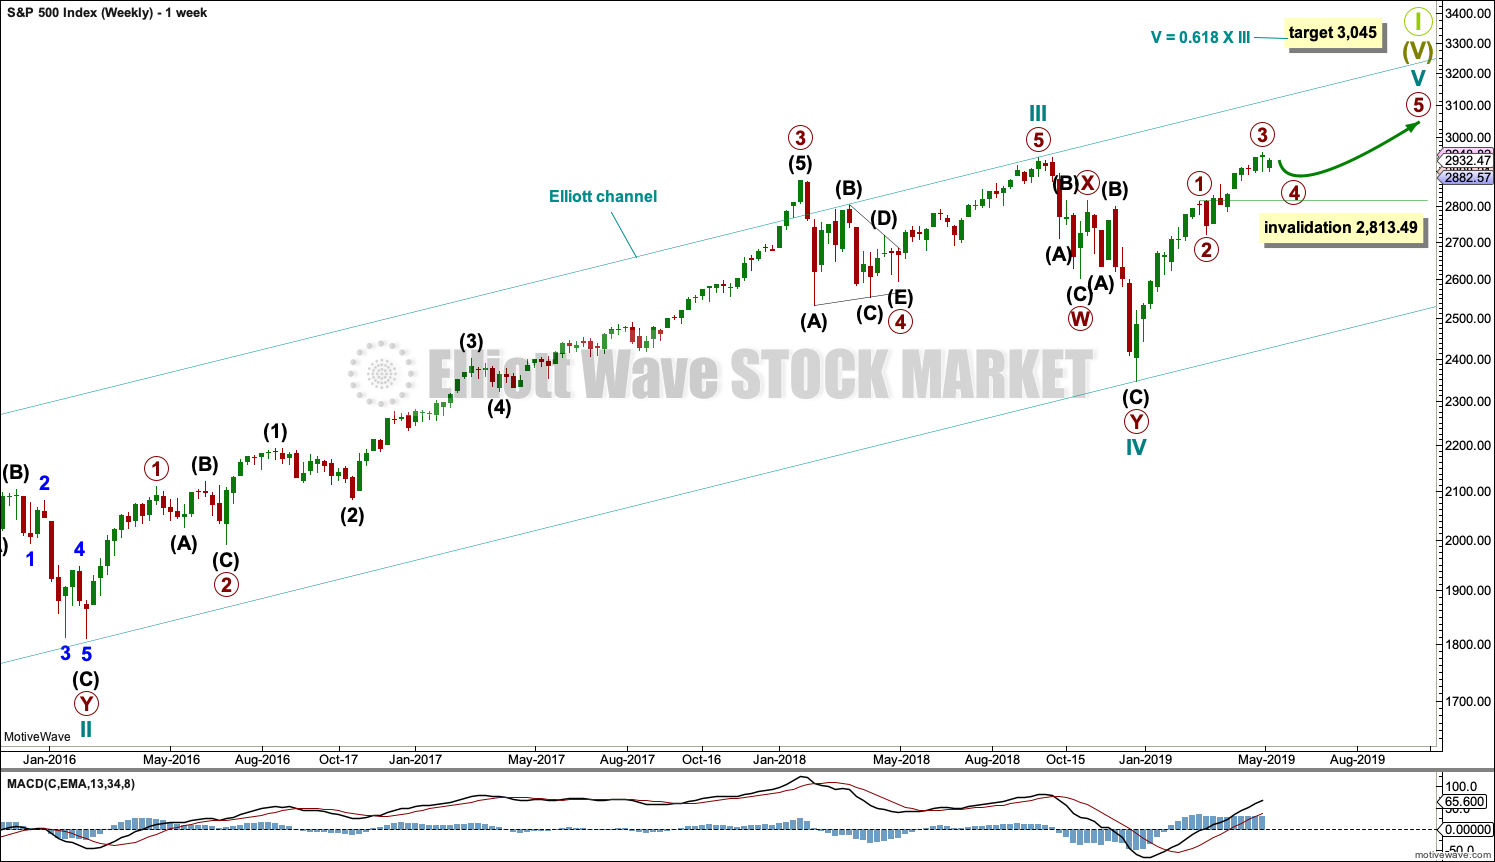
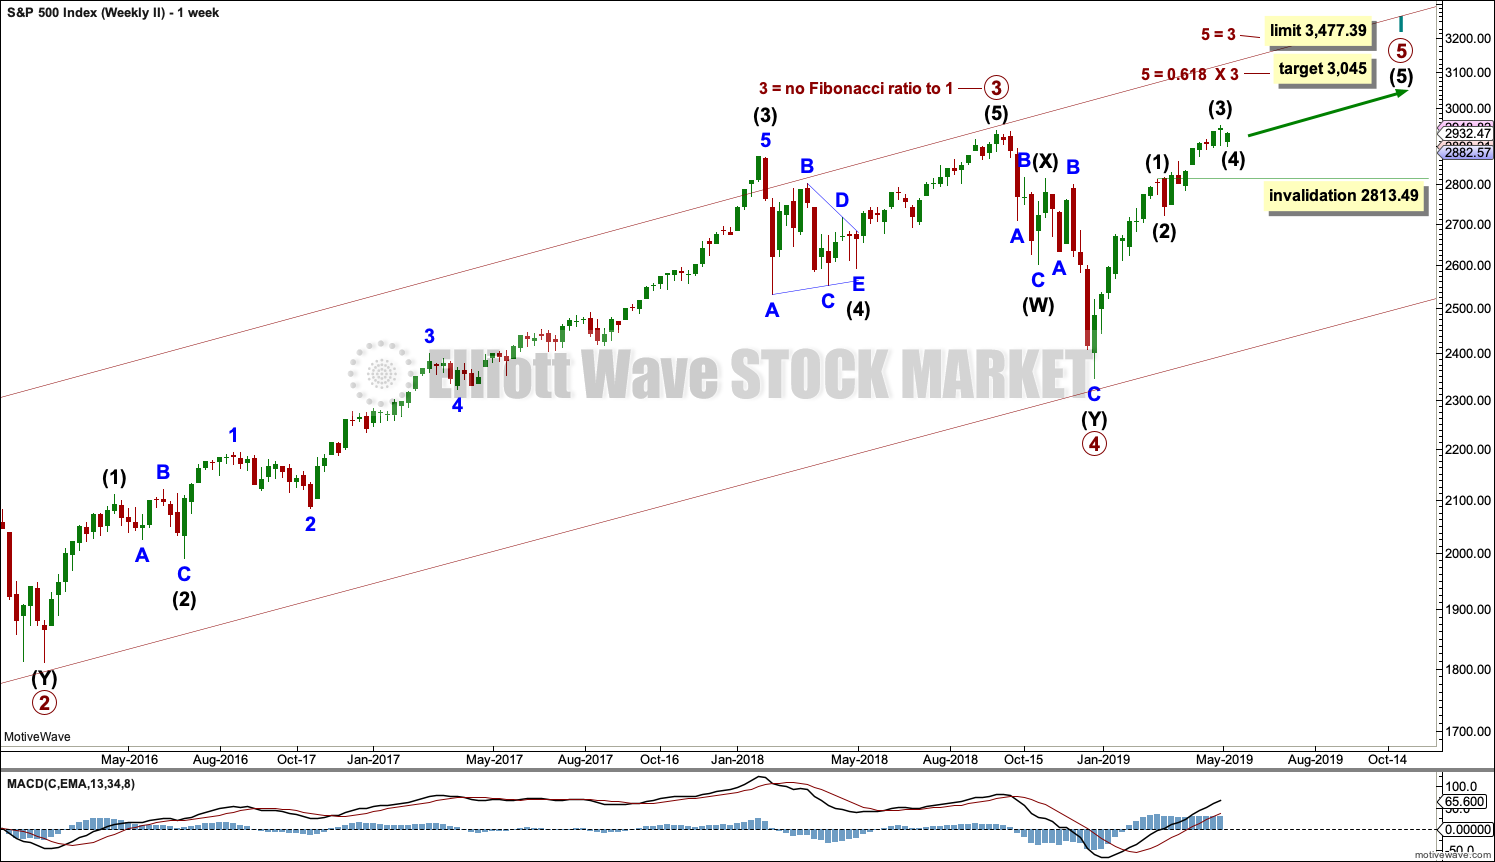
This weekly chart shows all of cycle waves III, IV and V so far.
This wave count expects that when cycle wave V completes Super Cycle wave (V) and Grand Super Cycle wave I, that a huge bear market to potentially last decades may begin. It should move substantially below 666.79.
Cycle wave II fits as a time consuming double combination: flat – X – zigzag. Combinations tend to be more time consuming corrective structures than zigzags. Cycle wave IV has completed as a multiple zigzag that should be expected to be more brief than cycle wave II.
Cycle wave IV may have ended at the lower edge of the Elliott channel.
Within cycle wave V, primary waves 1 through to 3 may now be complete. Primary wave 4 may not move into primary wave 1 price territory below 2,813.49.
Although both cycle waves II and IV are labelled W-X-Y, they are different corrective structures. There are two broad groups of Elliott wave corrective structures: the zigzag family, which are sharp corrections, and all the rest, which are sideways corrections. Multiple zigzags belong to the zigzag family and combinations belong to the sideways family. There is perfect alternation between the possible double zigzag of cycle wave IV and the combination of cycle wave II.
Although there is gross disproportion between the duration of cycle waves II and IV, the size of cycle wave IV in terms of price makes these two corrections look like they should be labelled at the same degree. Proportion is a function of either or both of price and time.
Draw the Elliott channel about Super Cycle wave (V) with the first trend line from the end of cycle wave I (at 2,079.46 on the week beginning 30th November 2014) to the high of cycle wave III, then place a parallel copy on the low of cycle wave II. Cycle wave V may find resistance about the upper edge.
It is possible that cycle wave V may end in October 2019. If it does not end there, or if the AD line makes new all time highs during or after June 2019, then the expectation for cycle wave V to end would be pushed out to March 2020 as the next possibility. Thereafter, the next possibility may be October 2020. March and October are considered as likely months for a bull market to end as in the past they have been popular. That does not mean though that this bull market may not end during any other month.
DAILY CHART
Click chart to enlarge.
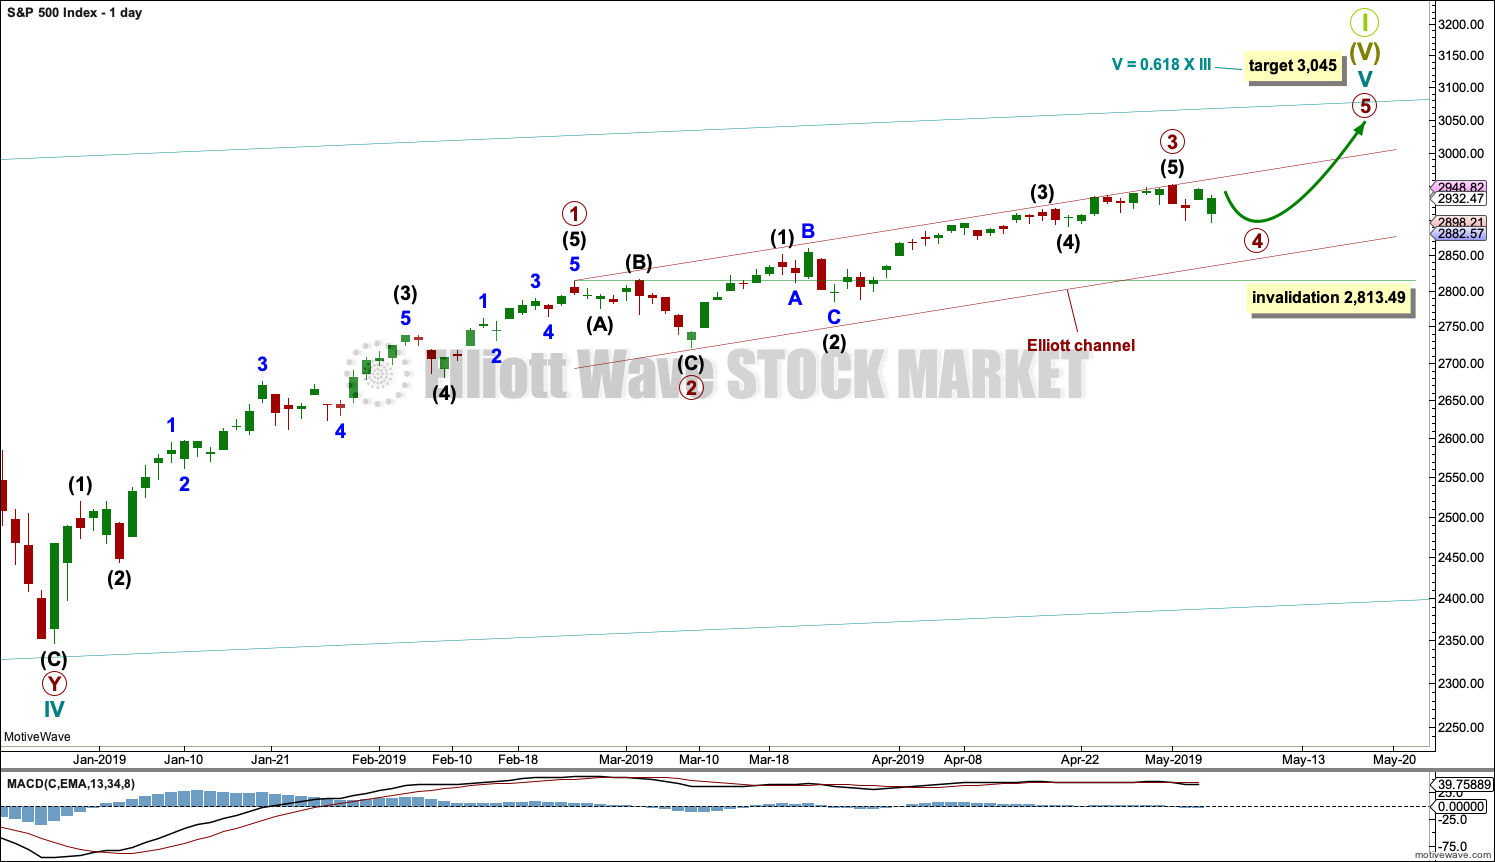
The daily chart will focus on the structure of cycle wave V.
Cycle wave V must subdivide as a five wave motive structure, either an impulse or an ending diagonal. An impulse is much more common and that will be how it is labelled. A diagonal would be considered if overlapping suggests it.
Primary wave 1 may have been a long extension, a smaller fractal of cycle wave I on the monthly chart.
Primary wave 2 may have been a very brief and shallow expanded flat correction, lasting just short of two weeks.
Primary wave 3 may be complete. It exhibits no Fibonacci ratio to primary wave 1 and is shorter than primary wave 1. This limits primary wave 5 to no longer than equality in length with primary wave 3 at 231.86 points.
Primary wave 4 may be expected to exhibit alternation with primary wave 2. Primary wave 4 may subdivide as any one of more than 23 possible corrective Elliott wave structures. The least likely structure would be a flat correction. The most likely structures would be a zigzag, multiple zigzag, combination or triangle. The labelling within primary wave 4 may change as it unfolds.
A channel is drawn using Elliott’s first technique about the impulse of cycle wave V. Draw the first trend line from the ends of primary waves 1 to 3, then place a parallel copy on the end of primary wave 2. If it is long lasting enough, primary wave 4 may find support about the lower edge of this channel.
Primary wave 4 may not move into primary wave 1 price territory below 2,813.49.
HOURLY CHART – COMBINATION
Click chart to enlarge.
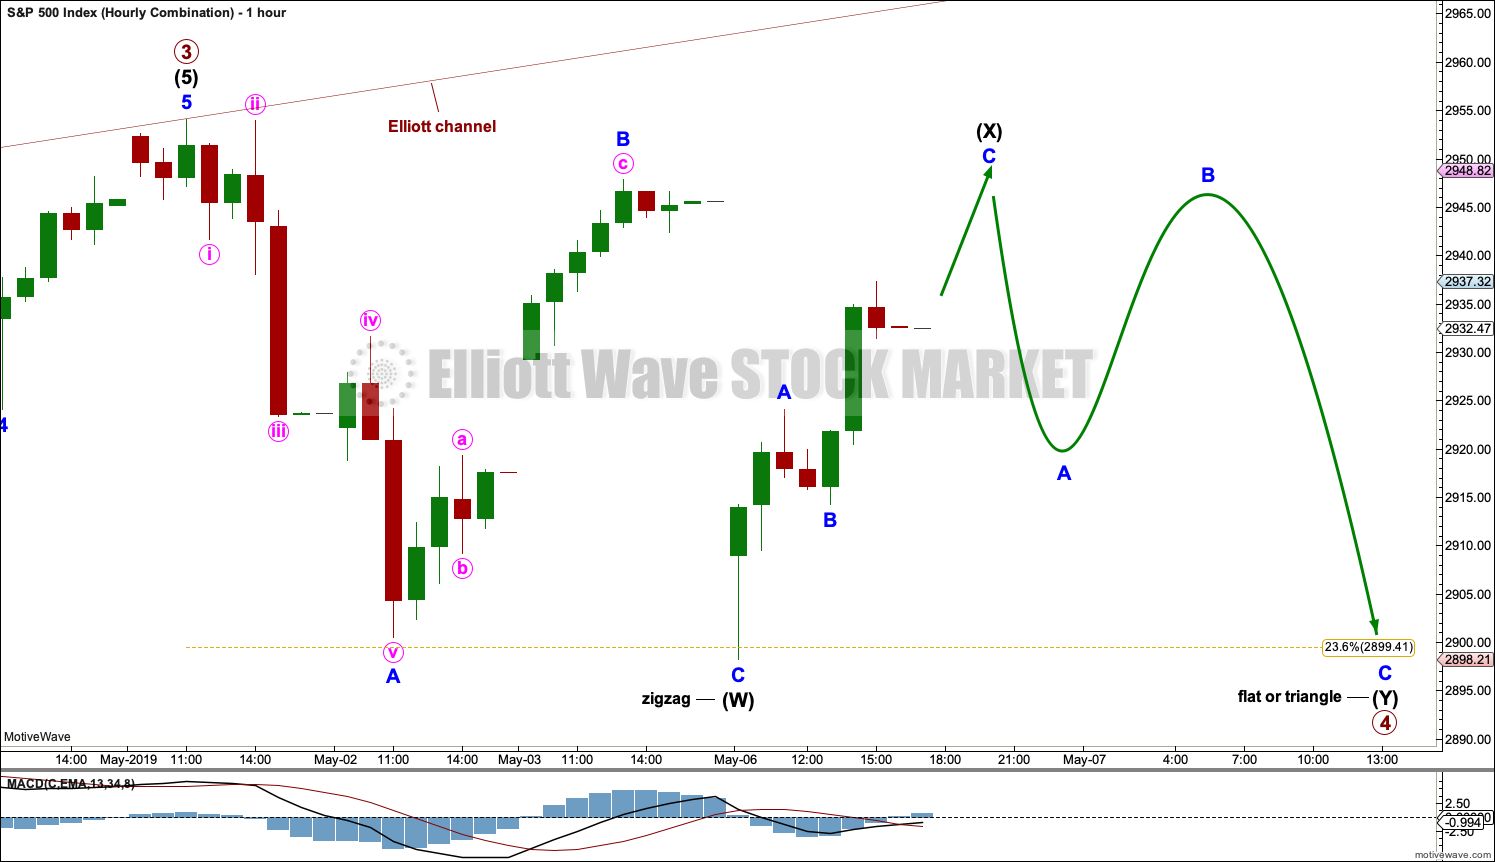
It is time now to begin to separate out different possible structures for primary wave 4 in different hourly charts.
This first hourly chart considers a double combination, which is a fairly common corrective structure. The two most common structures within double combinations are one zigzag and one flat. For this example, intermediate wave (W) now fits as a completed zigzag. The low for today’s session saw minor wave C move below the end of minor wave A, so a truncation was avoided.
Within a combination, intermediate wave (X) must subdivide as a three wave structure, most likely a zigzag. There is no minimum nor maximum required length for intermediate wave (X), and it may make a new price extreme beyond the start of intermediate wave (W) at 2,954.13.
When intermediate wave (X) is complete, then intermediate wave (Y) may subdivide over several days, most likely as a flat correction. It would most likely end about the same level as intermediate wave (W) at 2,898.21, so that the whole structure takes up time and moves price sideways.
HOURLY CHART – TRIANGLE
Click chart to enlarge.
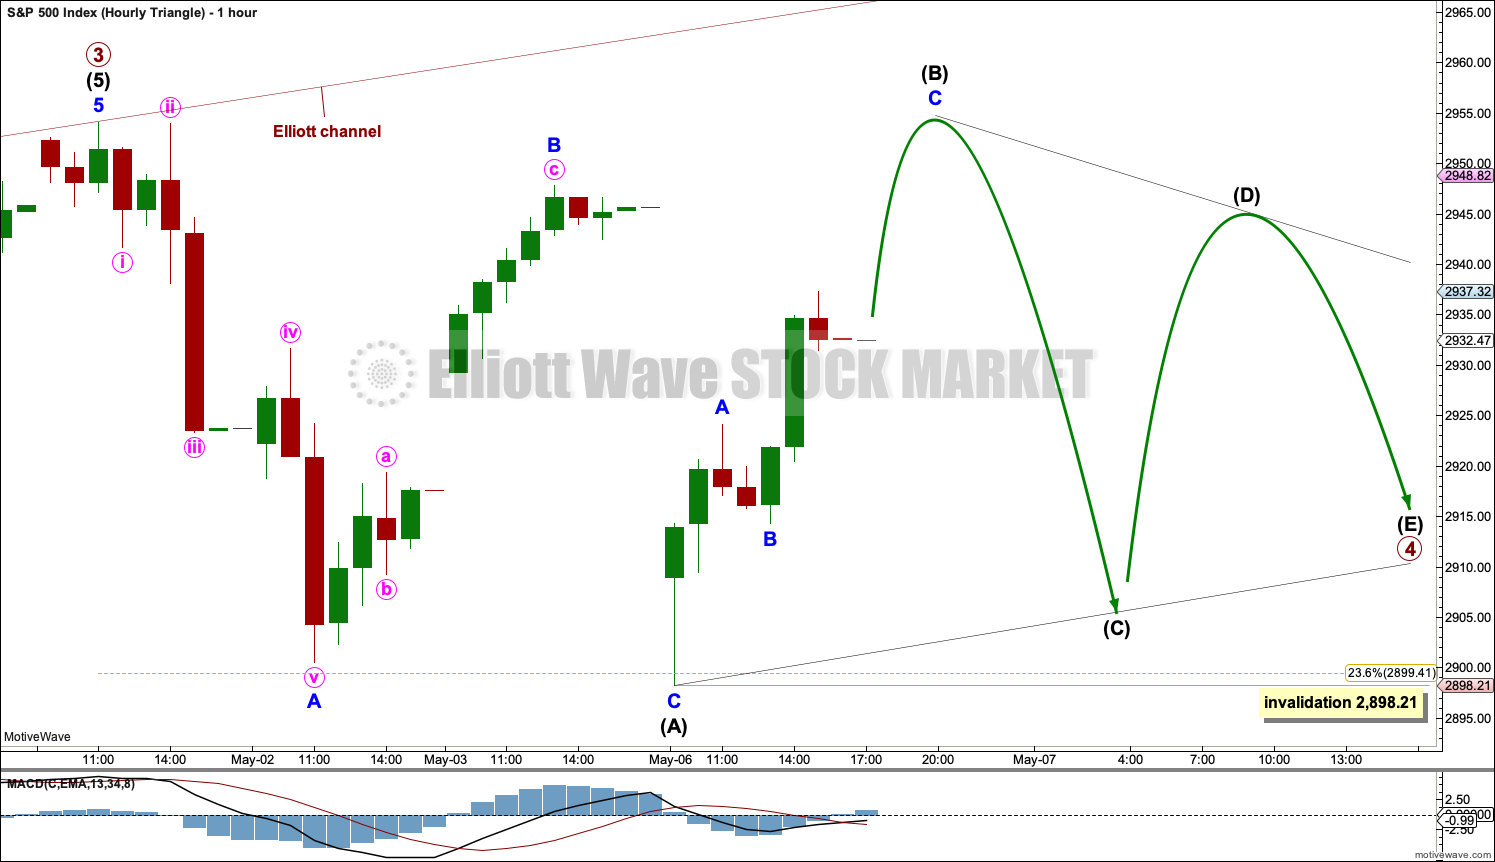
Primary wave 4 may also continue sideways as a triangle. The most common type of triangle is a regular contracting triangle where intermediate wave (B) would not move beyond the start of intermediate wave (A) above 2,954.13. But primary wave 4 may also be a running triangle where intermediate wave (B) may make a new price extreme above the start of intermediate wave (A) above 2,954.13.
Intermediate wave (C) may not move beyond the end of intermediate wave (A) below 2,898.21.
Intermediate wave (D) may not move beyond the end of intermediate wave (B) for a contracting triangle. For a barrier triangle, it may end about the same level as long as the (B)-(D) trend line looks flat.
Finally, intermediate wave (E) may not move beyond the end of intermediate wave (C).
A triangle may see price move sideways in an ever decreasing range for another one to two weeks or so.
One of the five sub-waves of a triangle usually unfolds as a more complicated multiple, almost always a double zigzag. The most common triangle sub-wave to do this is wave C, but it may be any sub-wave.
SECOND WAVE COUNT
WEEKLY CHART
Click chart to enlarge.
This weekly chart is identical to the first weekly chart, with the sole difference being the degree of labelling.
When cycle wave I is complete, then cycle wave II should meet the technical definition of a bear market as it should retrace more than 20% of cycle wave I, but it may end about either the 0.382 or 0.618 Fibonacci Ratios of cycle wave I. Cycle wave II may end close to the low of primary wave 2 within cycle wave I, which is at 1,810.10.
Thereafter, a new bull market for cycle wave III may begin. It should have support from volume and fundamentals.
The end of Grand Super Cycle wave I may be about 10 years or so away.
TECHNICAL ANALYSIS
WEEKLY CHART
Click chart to enlarge. Chart courtesy of et=”_blank”>StockCharts.com.
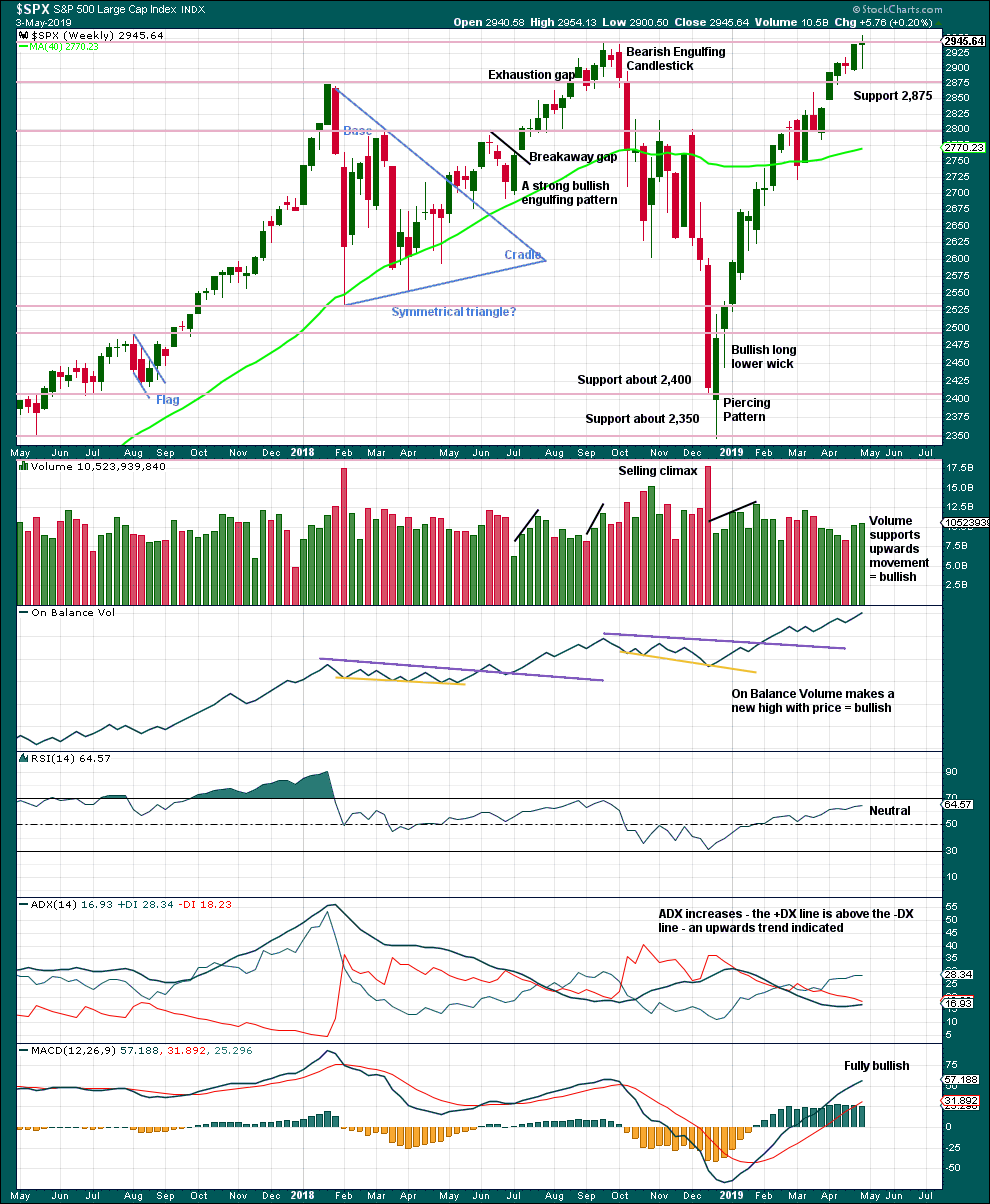
The Doji last week may represent a short pause within the upwards trend, or it may yet form part of a reversal pattern. Doji on their own are not reversal signals.
This chart remains fully bullish.
DAILY CHART
Click chart to enlarge. Chart courtesy of StockCharts.com.
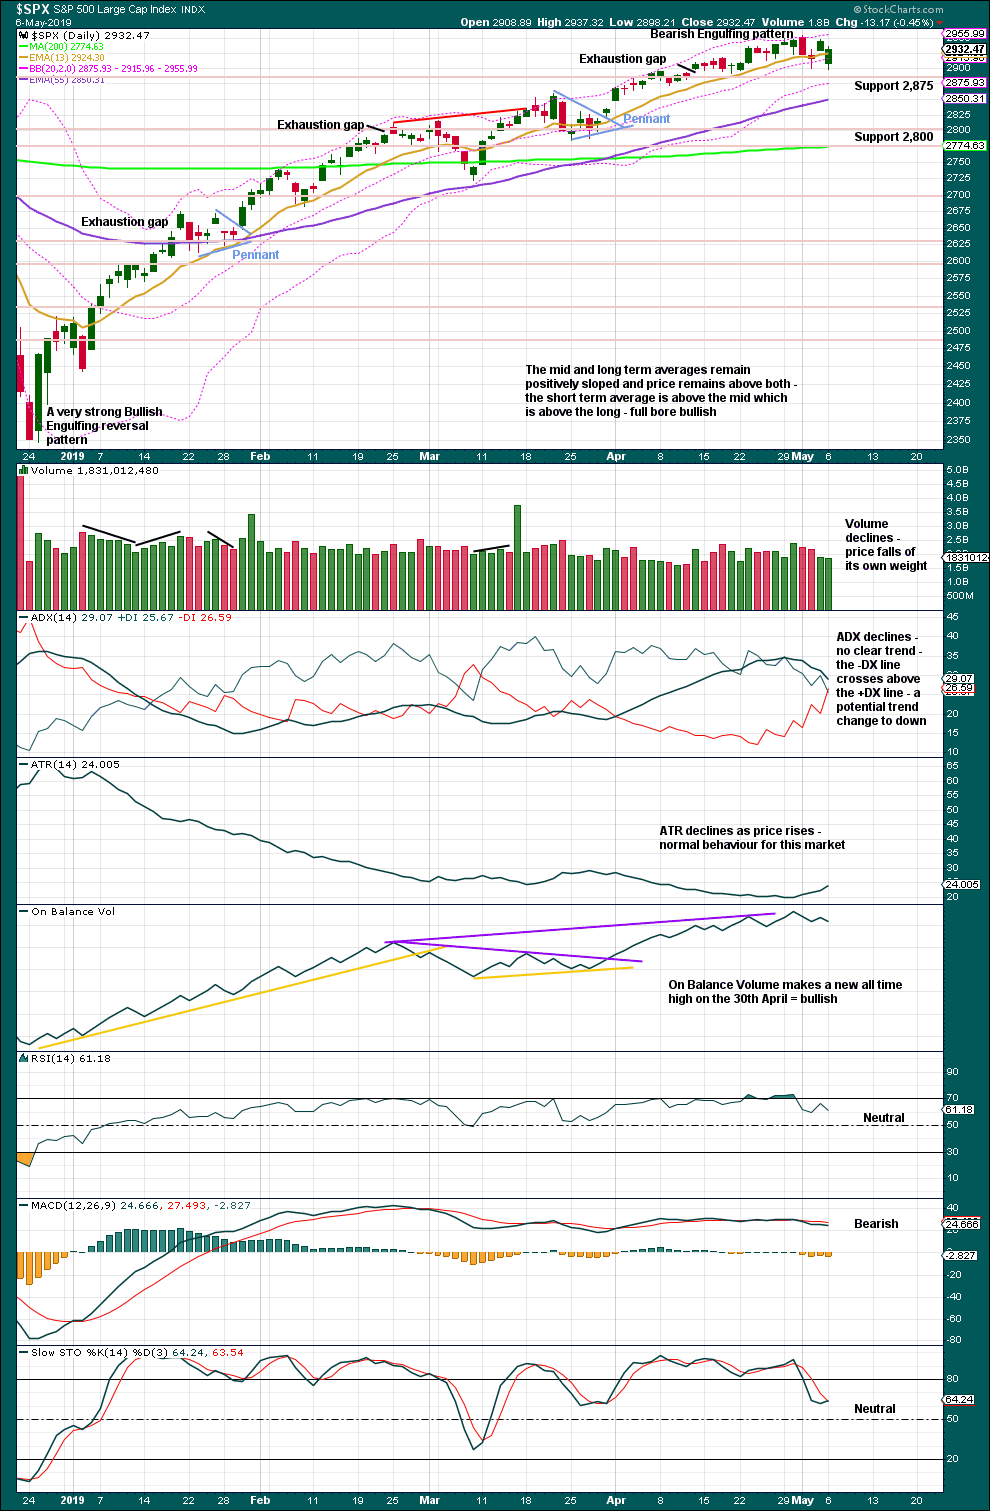
The Bearish Engulfing candlestick engulfs the two prior daily candlesticks. Coming after upwards movement, which has reached extreme, it should be given weight. This is a fairly strong bearish reversal signal.
There is support close by at 2,875.
Weak volume for the last two sessions supports the view that price may now be consolidating.
BREADTH – AD LINE
WEEKLY CHART
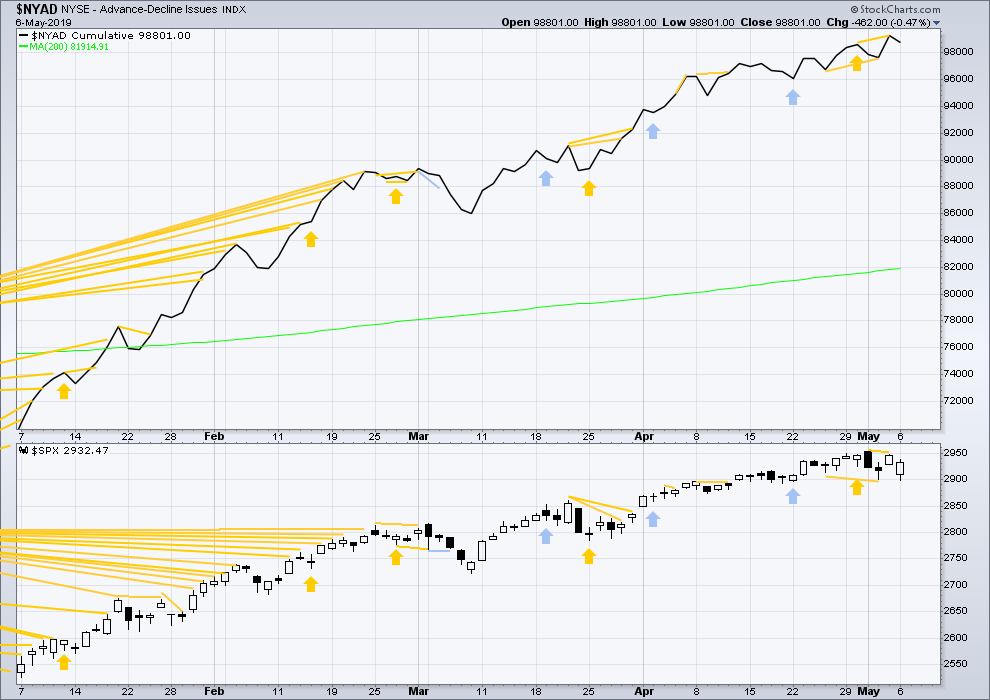
Click chart to enlarge. Chart courtesy of StockCharts.com. So that colour blind members are included, bearish signals
will be noted with blue and bullish signals with yellow.
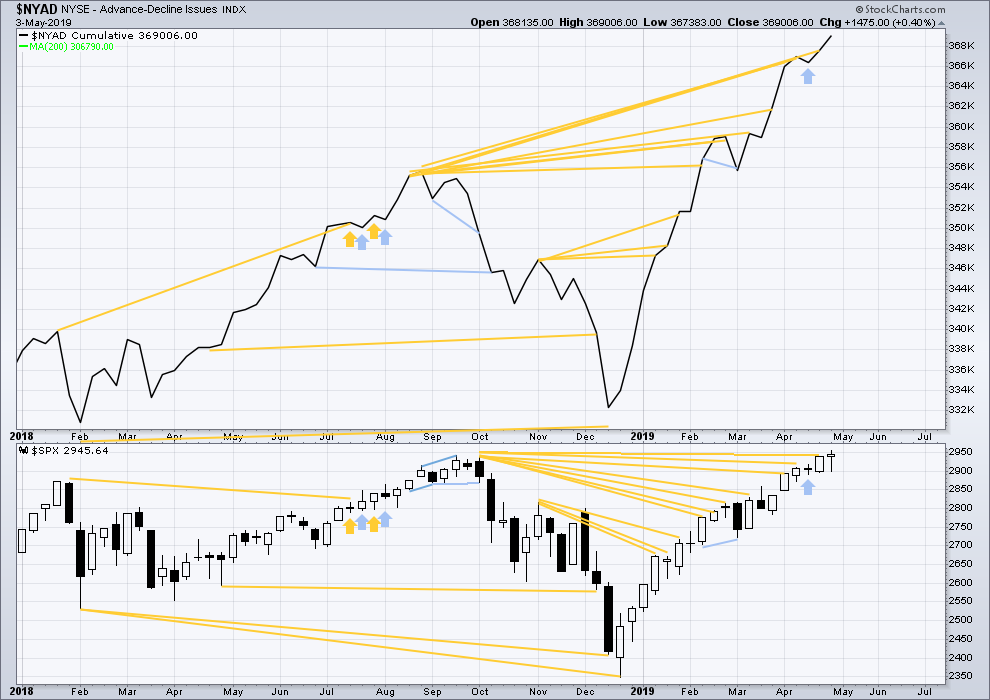
Every single bear market from the Great Depression and onwards has been preceded by a minimum of 4 months divergence between price and the AD line. With the AD line making a new all time high again last week, the end of this bull market and the start of a new bear market must be a minimum of 4 months away, which is the beginning of September 2019 at this time.
Mid-term bullish divergence has been followed by a new all time high from price and may now be resolved. There is no mid nor long-term divergence. Both price and the AD line make new all time highs.
While large caps have made a new all time high this week, mid and small caps did not and remain below their prior all time highs. This rally is led by large caps, which is typical of an ageing bull market.
DAILY CHART
Click chart to enlarge. Chart courtesy of StockCharts.com. So that colour blind members are included, bearish signals
will be noted with blue and bullish signals with yellow.
Breadth should be read as a leading indicator.
Bullish divergence noted on Friday for the short term has not been followed by upwards movement as Monday was a downwards day. This divergence may have failed, or it may yet be followed by another new all time high this week.
Today both price and the AD line have moved lower. There is no new divergence.
VOLATILITY – INVERTED VIX CHART
WEEKLY CHART
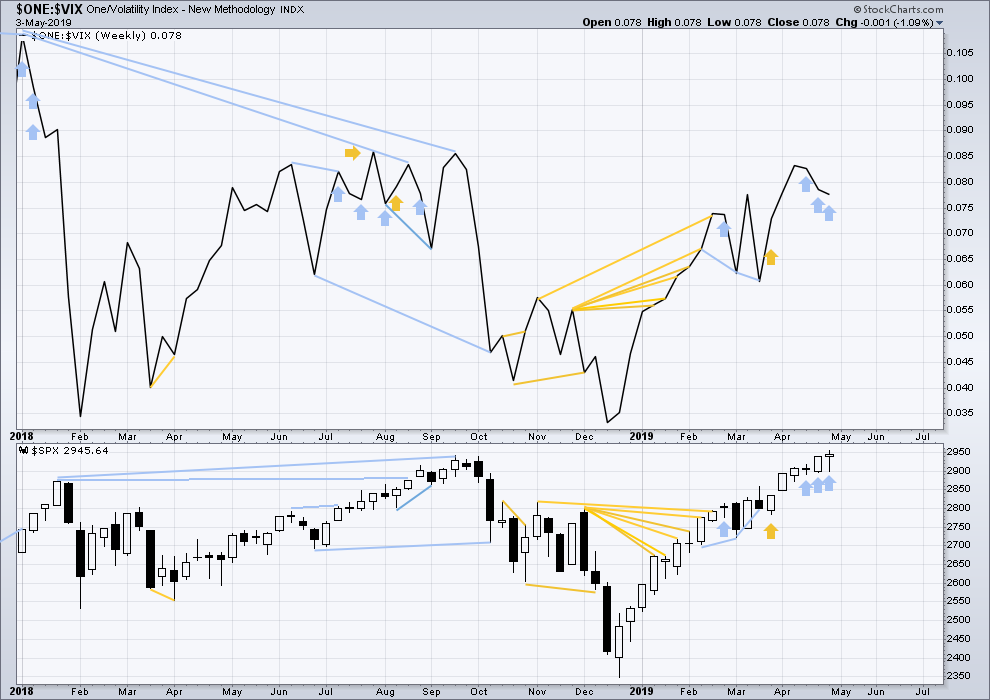
Click chart to enlarge. Chart courtesy of StockCharts.com. So that colour blind members are included, bearish signals
will be noted with blue and bullish signals with yellow.
For now three weeks in a row price has moved higher and inverted VIX has moved lower. This divergence is bearish for the short to mid term and may be warning of an approaching primary (or intermediate) degree correction.
It is noted that this has occurred before at the end of the strong rise in price up to the high on the 26th of January 2018. The three weeks up to that high saw price clearly move higher and inverted VIX clearly move lower. This divergence persisted for three weeks in that instance, and so may persist for a very few weeks again now before price turns.
DAILY CHART
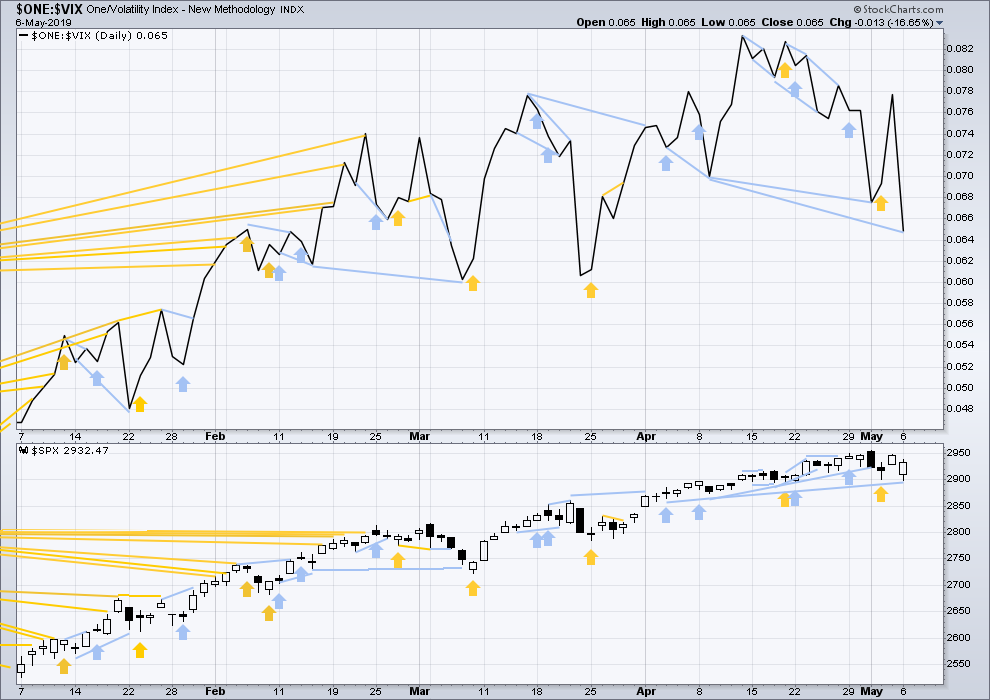
Click chart to enlarge. Chart courtesy of StockCharts.com. So that colour blind members are included, bearish signals
will be noted with blue and bullish signals with yellow.
Today both price and inverted VIX have moved lower. Inverted VIX has made a new low below the prior mid term low of the 8th of April, but price has not. This divergence is bearish for the short to mid term.
DOW THEORY
Dow Theory confirmed a bear market in December 2018. This does not necessarily mean a bear market at Grand Super Cycle degree though; Dow Theory makes no comment on Elliott wave counts. On the 25th of August 2015 Dow Theory also confirmed a bear market. The Elliott wave count sees that as part of cycle wave II. After Dow Theory confirmation of a bear market in August 2015, price went on to make new all time highs and the bull market continued.
DJIA: 23,344.52 – a close on the 19th of December at 23,284.97 confirms a bear market.
DJT: 9,806.79 – price has closed below this point on the 13th of December.
S&P500: 2,532.69 – a close on the 19th of December at 2,506.96 provides support to a bear market conclusion.
Nasdaq: 6,630.67 – a close on the 19th of December at 6,618.86 provides support to a bear market conclusion.
With all the indices moving now higher, Dow Theory would confirm a bull market if the following highs are made:
DJIA: 26,951.81
DJT: 11,623.58
S&P500: 2,940.91 – a new all time high has been made on the 29th of April 2019.
Nasdaq: 8,133.30 – a new high has been made on 24th of April 2019.
Published @ 7:31 p.m. EST.
—
Careful risk management protects your trading account(s).
Follow my two Golden Rules:
1. Always trade with stops.
2. Risk only 1-5% of equity on any one trade.
—
New updates to this analysis are in bold.
A few members have asked for extra analysis and I don’t want you all to think I’m ignoring the requests (except I kinda am, but for reasons) so I think it may be a good idea to update you all on work behind the scenes.
1. Sophie is no longer training with me. Currently I don’t have a trainee and I’m considering looking for one. I’d like to expand markets analysed to cover currencies again, and have another analyst so that I can have a holiday again one day (but offline, going bush).
2. The book is pretty much written, but I’m still finishing up the research behind it to then add to the book with some good data. This is extremely time consuming but I’m not able to put enough time on it to move it as fast as I’d like. An ongoing project.
3. I’m developing an approach for my own investing using a top down macro economic analysis of the business cycle, and Relative Rotation graphs of sectors and equities. It took weeks to get the RRG charts to work. I have to do the NZ market analysis manually which takes hours and is tedious but necessary. I’ve spent a lot of time on this recently because I want to invest my own $. Once I’ve perfected the approach I’m considering doing this for the US market as another product, once a month. But to legally advise on individual equities I need to become an Authorised Financial Advisor (not just registered) which leads to…
4. I’ve begun the process of becoming authorised, this will take months. I need to complete 5 papers. The content is really easy, it’s just a time thing. I’m trying to move this forward each day just a little.
And finally, I need to surf for my health and soul. More time.
So I have on my list of markets to do for you (in order): ASX, USD index, FTSE. In posting this message here I’m holding myself to get one done each week, with ASX first this week.
Good for you Lara. I think this is all great. But I do worry about people who are high achievers and sometimes take on too much. So I am glad you are taking this one step at a time. I am sorry that Sophie did not work out. I sure hope you get a break in the next few months. Going ‘bush’ is my kind of break. As far as I am concerned, when this correction looks to be over and we are moving back up, take a week or more. Skip a video or two. You skipped you full holiday over the Christmas season for us. I don’t expect you to provide this analysis without some vacation time and I think the vast majority of your subscribers would agree. You need your breaks just like the rest of us. Take a couple of weeks. And good luck on all the rest.
PS – I didn’t know you were writing a book. Please sign the first copy and send it to me. I will be pleased to pay the premium price.
Thanks Rodney, but I feel like I get a break every time I go surfing!
The book is an attempt to make the classic “Elliott wave Principle” by Frost and Prechter, clearer. I find some of the rules and guidelines need some interpretation. Also, to add my own experience of specific markets.
Hourly chart updated:
Well, that’s frustrating. I considered a combination and a triangle, but didn’t publish one of the other several possibilities of a double zigzag.
It looks like a double zigzag.
Those are pretty common. They tend to be relatively quick compared to all the other types of structures. This one may be over fairly quickly now, and if price gets down to the lower edge of the maroon Elliott channel look for it to be very likely to strongly bounce up off that line.
Excellent. Here is a tidbit, when VIX is up 25% or more in one day, the odds favor a lower low in the SPX coming up. It fits perfect with the double zig-zag.
I was surprised that the target for this P4 was only 2,900.
If this is the last big correction before the start of a significant bear market, wouldn’t we expect this one to be fairly significant?
I’m shoring a little bit of volatility here, but giving myself a few days to work into the position because it feels like catching a knife.
Alot of us lean more toward the alternate weekly, where there are years of bull market to go before the end of the GSC wave 1.
Don’t forget we need to see major divergences form 4+ months in advance of a major bear market. No such present today.
As for the main weekly, a primary 5 of that small a size in time and price would be very odd proportionality. So I rather suspect one way or another, that count structure evolves as one way or another, this bull market extends. Could be wrong!
A good reminder about the breadth divergences which almost always precede the end of a bull market. On days like today with high volatility and a relatively large drop it helps to calm the nerves. 2nd and 4th waves are difficult to trade relatively speaking and generally only done well by the very nimble and constantly vigilant day traders.
I spoke of the VIX and $NYMO with regards to their BB. Curently the SPX is right at the lower BB. If $NYMO and SPX both close below their daily lower BB and VIX closes above its daily BB, then we have a set up for the trifecta ‘buy’ signal started.
What we look for after that is for all three to close within their daily BBs to trigger the signal. An excellent opportunity with close by stop loss orders to reduce risk.
NDX resting on overlapped fibo’s at 2620-40 (a 23% and 38%). SPX on overlapped fibos at 2887-94 (23%, 78%, and a 100%). RUT scribbling on a 50%
Turn time?
I closed my oil shorts, and started a small long position…..
VIX closed above its daily BB yesterday. Now we look for a day with a close inside the BB followed by the next day with a daily close below that and we have completed an SPX buy signal. VIX often rides several days above its BB. So it may do so here as well. But once we get the daily close back inside, it is the start of the set up for a ‘go long’ signal.
If the SPX was doing the opposite at the same time (closing below its daily BB etc) then the signal would be even stronger. But, alas, it is not.
BTW, I am still looking for the McClellan Oscillator ($NYMO) to reset below -40 as I mentioned yesterday. It is currently at -42. But only the daily close counts.
I’m using this pullback as an opportunity to pick up some hot stocks. So far I’ve taken ALGN, FRPT (before it made it’s big move up today, fortunately!), NOW, MRCY. Looking for others. Want to cash on what should per Lara’s current count be a BIG BIG 3 up coming soon to a market near you.
AIG gapped up big…nice for my little bull call spread! Just a matter of 9 days of maturing now.
The next wave up for the second wave count is expected to be a fifth wave (intermediate) of a fifth wave (primary) of a first wave (cycle).
Not a third wave.
Not sure which wave count you’re referring to Kevin? I don’t think any of them see a third wave up next?
McClellan Oscillator (-48) is now below it lower BB. If it closes below the BB, followed by a daily close above its lower BB is a buy (long) signal. Again, coupled with a VIX signal noted above, it becomes a strong signal. We wait for today’s close to see if we get the set up. Usually, but not always, these ‘go long’ signals can provide a very strong rally.
Even after many decades of studying EW theory / charts, but especially the past eight years with Lara, I continue to be amazed at the predictive ability of EW applied to US equity markets. The past several days with dramatic swings in both directions are a prime example. As we open this morning, I repeat what I said yesterday morning, Wowza!!!
Next wave down coming up at the open and we may even see a dramatic reversal today. What a great market for many traders who don’t have EW (Lara) at their disposal to get whipsawed repeatedly. My old friend Vern would say, “The banksters are fleecing the flock.”
Well, longer term, I see it all as a launching pad to 3000 and above. Why? Because of Lara’s counts and analysis of course and my long term view (months & years) which have been repeatedly stated on this forum.
Have a great day everyone. Where I live (NoWhereVille), we are enjoying sunny skies every day with temps in the mid 80’s. In my location we have 320+ days of sunshine per year with only 9 inches of rain / precipitation per year. Winter (northern hemisphere) brings 95% of our cloudy days. It is nothing but sunshine from here to October.
Nothin’ but sunshine, oh yea.
Nothin’ but sunshine, oh yea.
Looks good to me. Thanks Lara and all EWSM members.
Peter, you beat me again by a hair. Hmmmm.
1 is fun!