
For the very short term, a consolidation or bounce was expected. A bounce for Friday overall fits this expectation. Price remained below the invalidation point.
Summary: A pullback or consolidation here for primary wave 4 may now last about a couple of weeks or so and may end either about 2,894 or the lower edge of the maroon Elliott channel on the daily chart.
For the short term, some downwards movement may begin next week to 2,894. Overall, primary wave 4 may move sideways in a range bound movement.
The final target remains the same at 3,045. Alternate monthly wave counts allow for a target as high as 4,119.
The biggest picture, Grand Super Cycle analysis, is here.
Monthly charts were last published here, with video here. There are two further alternate monthly charts here, with video here.
ELLIOTT WAVE COUNTS
The two Elliott wave counts below will be labelled First and Second rather than main and alternate as they may be about of even probability. When the current impulse of primary wave 5 (second wave count) or cycle wave V (first wave count) may be complete, then these two wave counts will diverge on the severity of the expected following bear market. To see an illustration of this future divergence monthly charts should be viewed.
FIRST WAVE COUNT
WEEKLY CHART
Click chart to enlarge.
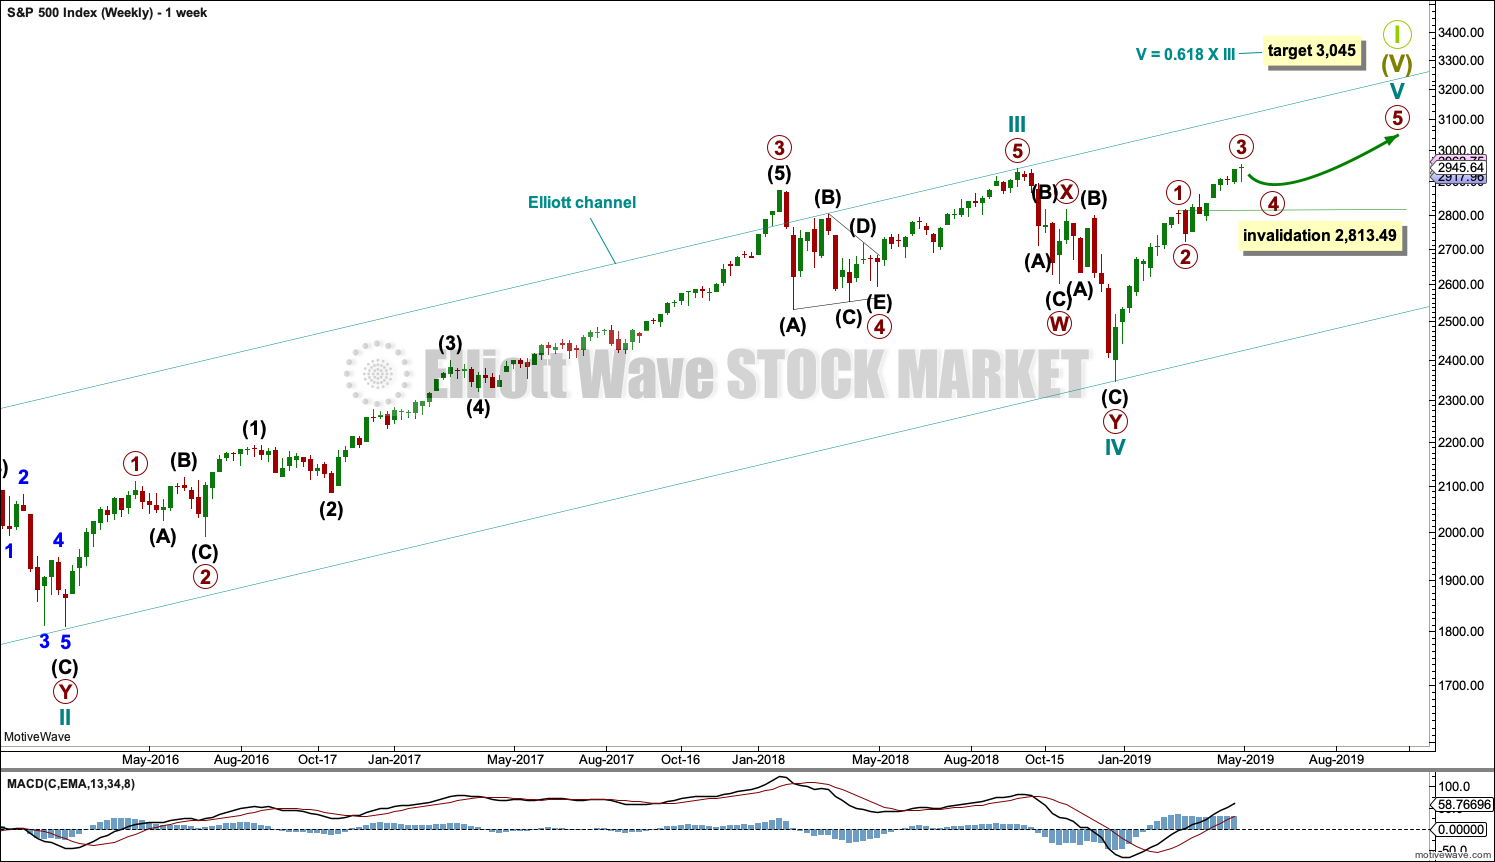
This weekly chart shows all of cycle waves III, IV and V so far.
This wave count expects that when cycle wave V completes Super Cycle wave (V) and Grand Super Cycle wave I, that a huge bear market to potentially last decades may begin. It should move substantially below 666.79.
Cycle wave II fits as a time consuming double combination: flat – X – zigzag. Combinations tend to be more time consuming corrective structures than zigzags. Cycle wave IV has completed as a multiple zigzag that should be expected to be more brief than cycle wave II.
Cycle wave IV may have ended at the lower edge of the Elliott channel.
Within cycle wave V, primary waves 1 through to 3 may now be complete. Primary wave 4 may not move into primary wave 1 price territory below 2,813.49.
Although both cycle waves II and IV are labelled W-X-Y, they are different corrective structures. There are two broad groups of Elliott wave corrective structures: the zigzag family, which are sharp corrections, and all the rest, which are sideways corrections. Multiple zigzags belong to the zigzag family and combinations belong to the sideways family. There is perfect alternation between the possible double zigzag of cycle wave IV and the combination of cycle wave II.
Although there is gross disproportion between the duration of cycle waves II and IV, the size of cycle wave IV in terms of price makes these two corrections look like they should be labelled at the same degree. Proportion is a function of either or both of price and time.
Draw the Elliott channel about Super Cycle wave (V) with the first trend line from the end of cycle wave I (at 2,079.46 on the week beginning 30th November 2014) to the high of cycle wave III, then place a parallel copy on the low of cycle wave II. Cycle wave V may find resistance about the upper edge.
It is possible that cycle wave V may end in October 2019. If it does not end there, or if the AD line makes new all time highs during or after June 2019, then the expectation for cycle wave V to end would be pushed out to March 2020 as the next possibility. Thereafter, the next possibility may be October 2020. March and October are considered as likely months for a bull market to end as in the past they have been popular. That does not mean though that this bull market may not end during any other month.
DAILY CHART
Click chart to enlarge.
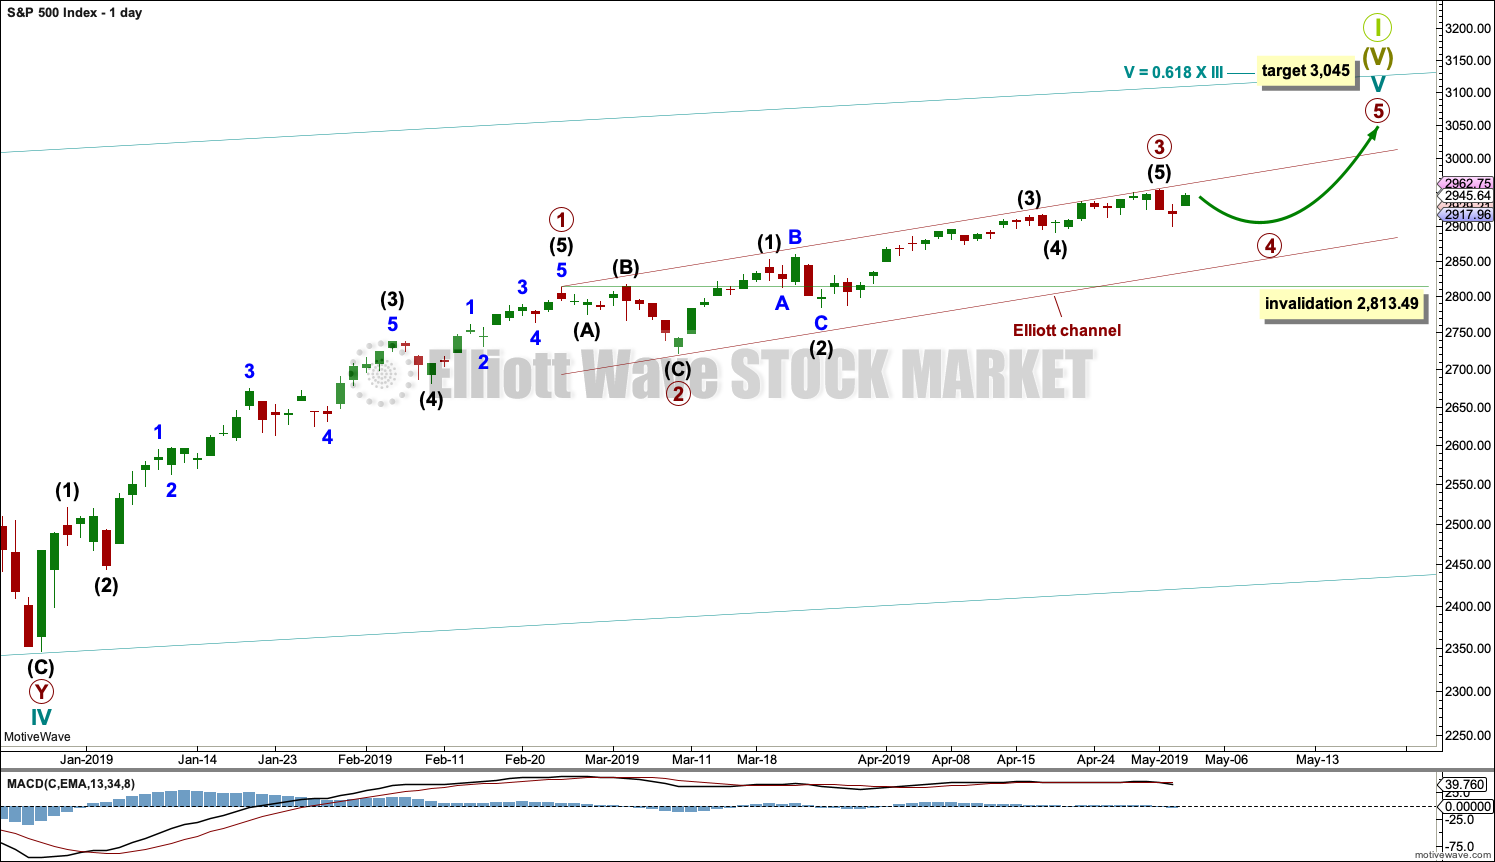
The daily chart will focus on the structure of cycle wave V.
Cycle wave V must subdivide as a five wave motive structure, either an impulse or an ending diagonal. An impulse is much more common and that will be how it is labelled. A diagonal would be considered if overlapping suggests it.
Primary wave 1 may have been a long extension, a smaller fractal of cycle wave I on the monthly chart.
Primary wave 2 may have been a very brief and shallow expanded flat correction, lasting just short of two weeks.
Primary wave 3 may be complete. It exhibits no Fibonacci ratio to primary wave 1 and is shorter than primary wave 1. This limits primary wave 5 to no longer than equality in length with primary wave 3 at 231.86 points.
Primary wave 4 may be expected to exhibit alternation with primary wave 2. Primary wave 4 may most likely unfold as a single or multiple zigzag, but it may also unfold as a triangle or combination. The least likely structure would be a flat.
A channel is drawn using Elliott’s first technique about the impulse of cycle wave V. Draw the first trend line from the ends of primary waves 1 to 3, then place a parallel copy on the end of primary wave 2. If it is long lasting enough, primary wave 4 may find support about the lower edge of this channel.
Primary wave 4 may not move into primary wave 1 price territory below 2,813.49.
HOURLY CHART
Click chart to enlarge.
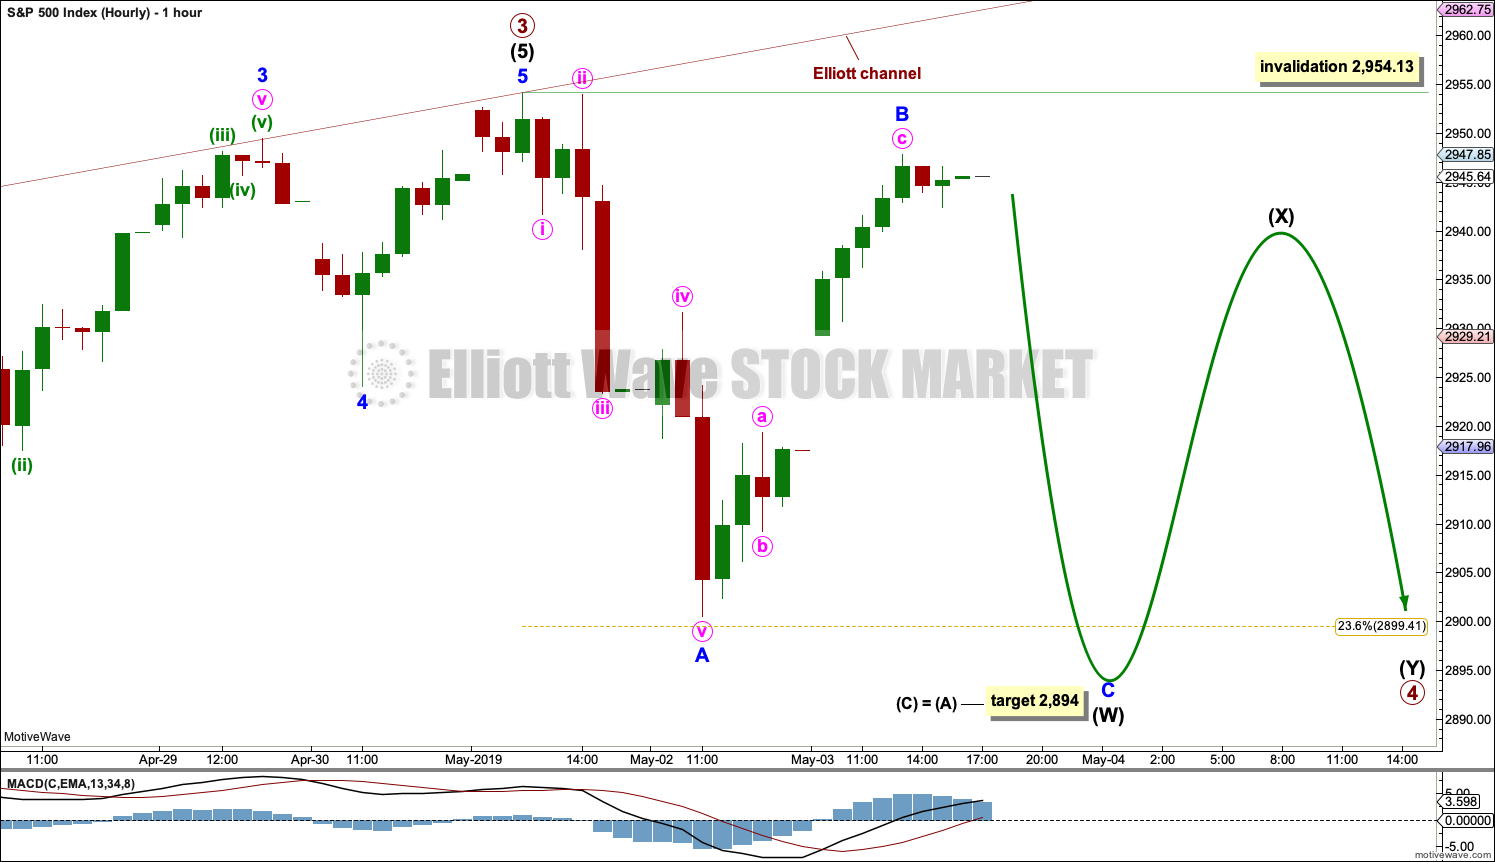
Primary wave 4 may subdivide as any one of more than 23 possible corrective Elliott wave structures. The least likely structure would be a flat correction. The most likely structures would be a zigzag, multiple zigzag, combination or triangle. The labelling within primary wave 4 may change as it unfolds.
At the end of the week, the degree of labelling within primary wave 4 is moved down one degree. The first structure in a double combination may be unfolding as a zigzag, labelled intermediate wave (W). When complete, the zigzag may be then joined by a three in the opposite direction labelled intermediate wave (X), which would most likely unfold as a zigzag. The second structure in a combination may then unfold as either a flat (most likely) or a triangle (unlikely).
Primary wave 4 may also be unfolding as a triangle. This would expect sideways movement in an ever decreasing range for a couple of weeks or so.
On the five minute chart, the downwards wave labelled minor wave A fits best as a five wave impulse, but it may also be seen as a three wave zigzag. If it is a five, then minor wave B may not move beyond its start above 2,954.13. If it is a three, then minor wave B may make a new high above 2,954.13. Unfortunately, the S&P does not always have fives that look clearly like fives and threes that look clearly like threes on all time frames; some flexibility is required. At the hourly chart time frame, it does look best as a five.
SECOND WAVE COUNT
WEEKLY CHART
Click chart to enlarge.
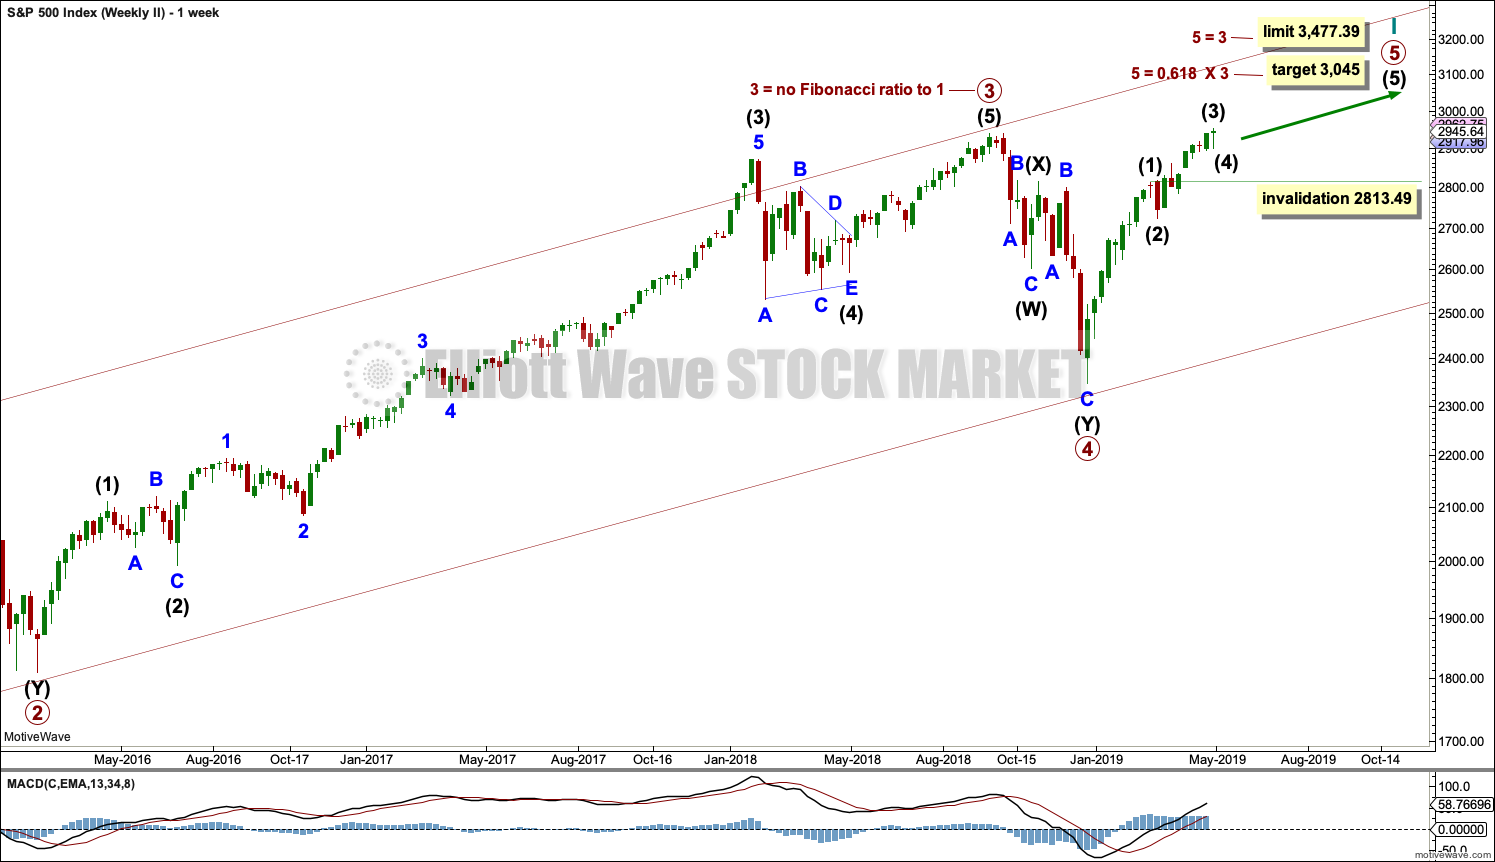
This weekly chart is identical to the first weekly chart, with the sole difference being the degree of labelling.
When cycle wave I is complete, then cycle wave II should meet the technical definition of a bear market as it should retrace more than 20% of cycle wave I, but it may end about either the 0.382 or 0.618 Fibonacci Ratios of cycle wave I. Cycle wave II may end close to the low of primary wave 2 within cycle wave I, which is at 1,810.10.
Thereafter, a new bull market for cycle wave III may begin. It should have support from volume and fundamentals.
The end of Grand Super Cycle wave I may be about 10 years or so away.
TECHNICAL ANALYSIS
WEEKLY CHART
Click chart to enlarge. Chart courtesy of et=”_blank”>StockCharts.com.
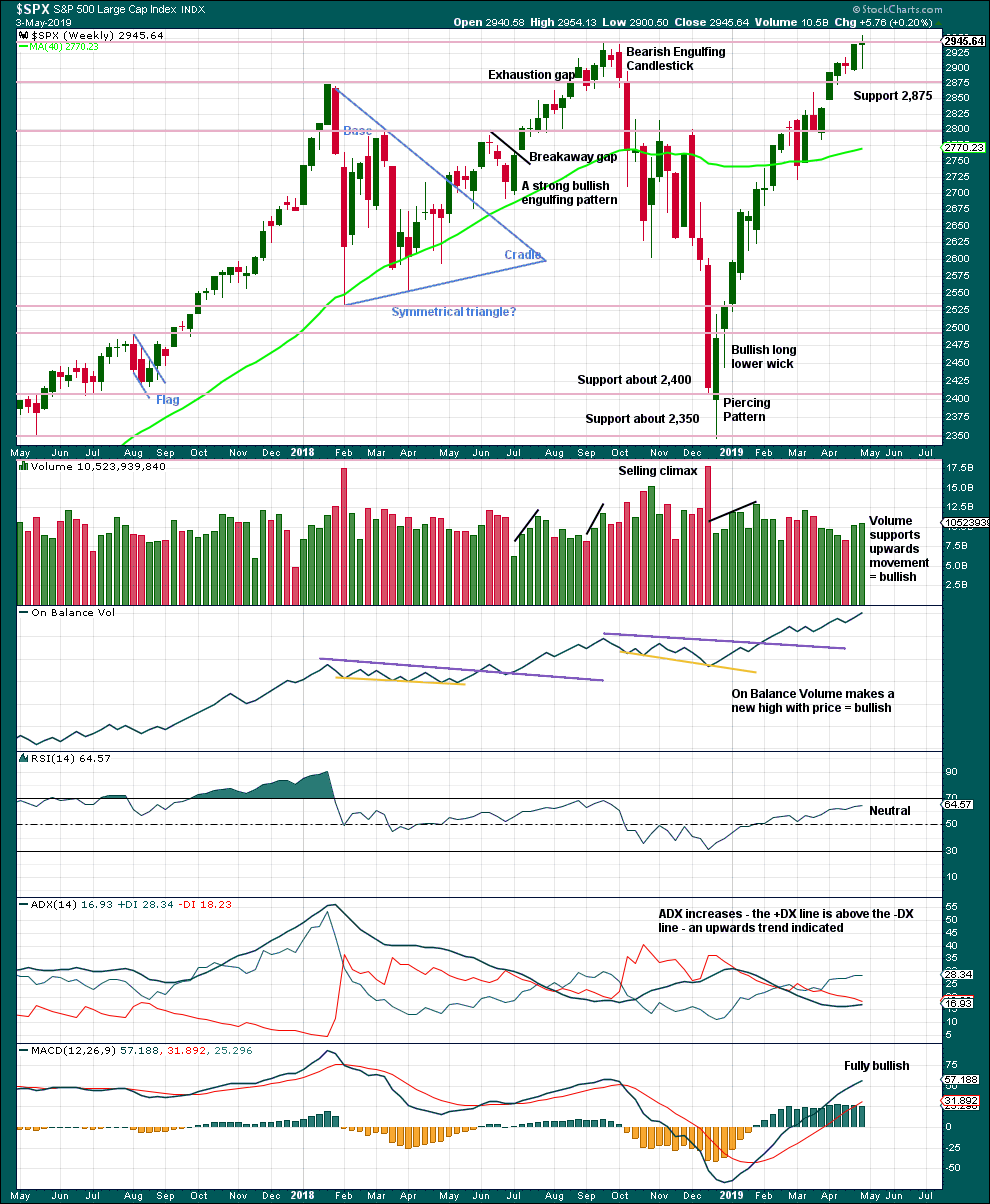
The Doji this week may represent a short pause within the upwards trend, or it may yet form part of a reversal pattern. Doji on their own are not reversal signals.
This chart remains fully bullish.
DAILY CHART
Click chart to enlarge. Chart courtesy of StockCharts.com.
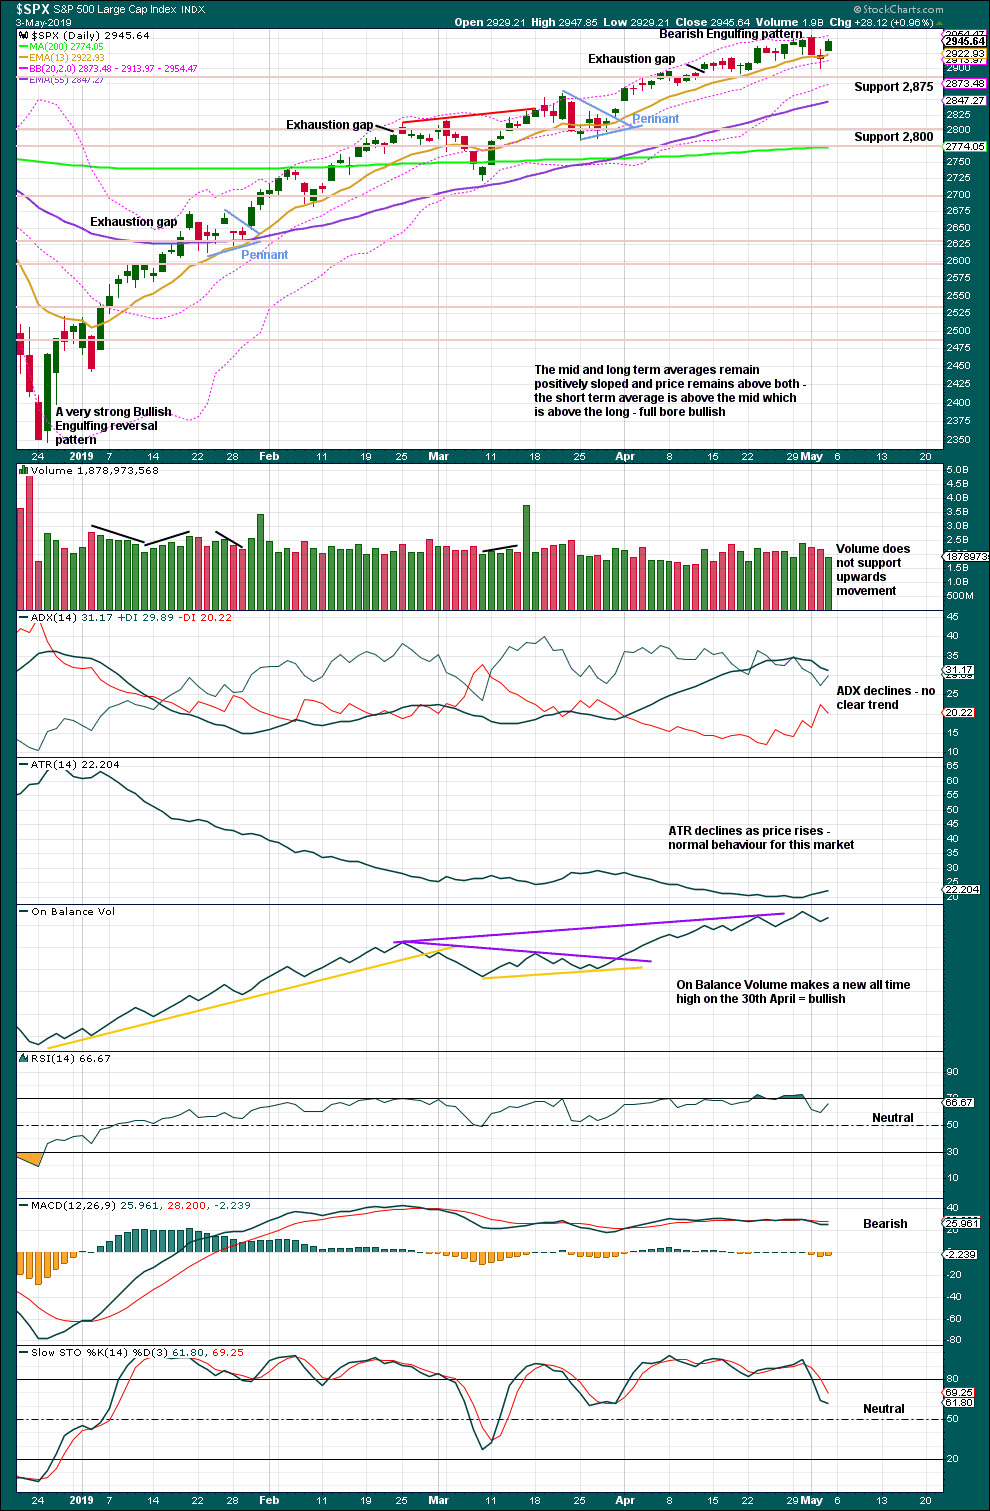
The December 2018 low is expected to remain intact. The two 90% upwards days on 26th December 2018 and 6th January 2019 indicate this upwards trend has internal strength.
The Bearish Engulfing candlestick engulfs the two prior daily candlesticks. Coming after upwards movement, which has reached extreme, it should be given weight. This is a fairly strong bearish reversal signal.
There is support close by at 2,875.
Friday’s upwards day has weak volume. This may fit as a B wave.
BREADTH – AD LINE
WEEKLY CHART
Click chart to enlarge. Chart courtesy of StockCharts.com. So that colour blind members are included, bearish signals
will be noted with blue and bullish signals with yellow.
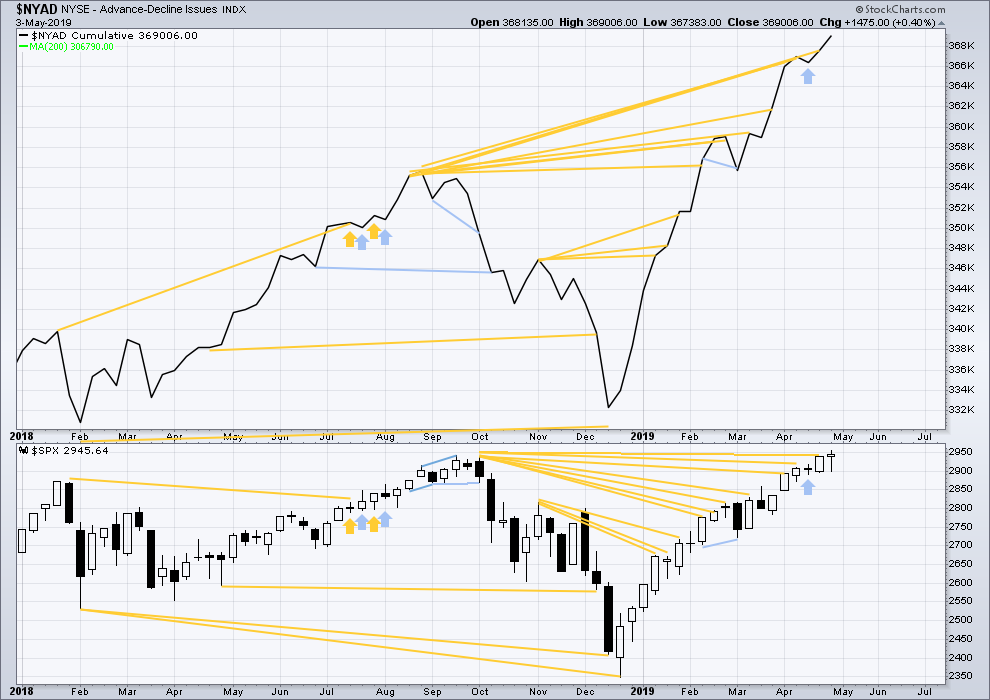
Every single bear market from the Great Depression and onwards has been preceded by a minimum of 4 months divergence between price and the AD line. With the AD line making a new all time high again this week, the end of this bull market and the start of a new bear market must be a minimum of 4 months away, which is the beginning of September 2019 at this time.
Mid-term bullish divergence has been followed by a new all time high from price and may now be resolved. There is no mid nor long-term divergence. Both price and the AD line make new all time highs.
While large caps have made a new all time high this week, mid and small caps did not and remain below their prior all time highs. This rally is led by large caps, which is typical of an ageing bull market.
DAILY CHART
Click chart to enlarge. Chart courtesy of StockCharts.com. So that colour blind members are included, bearish signals
will be noted with blue and bullish signals with yellow.
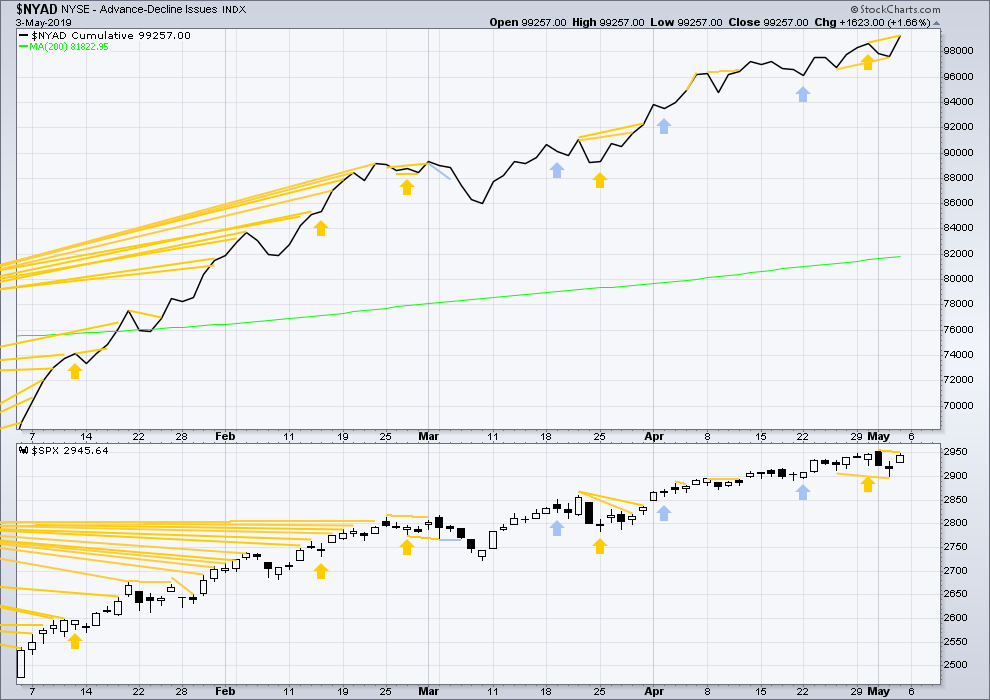
Breadth should be read as a leading indicator.
Both price and the AD line moved higher on Friday, but the AD line made a new short-term high while price did not. This divergence is bullish for the short term and does not support the Elliott wave count. It suggests price may make another new all time high early next week.
VOLATILITY – INVERTED VIX CHART
WEEKLY CHART
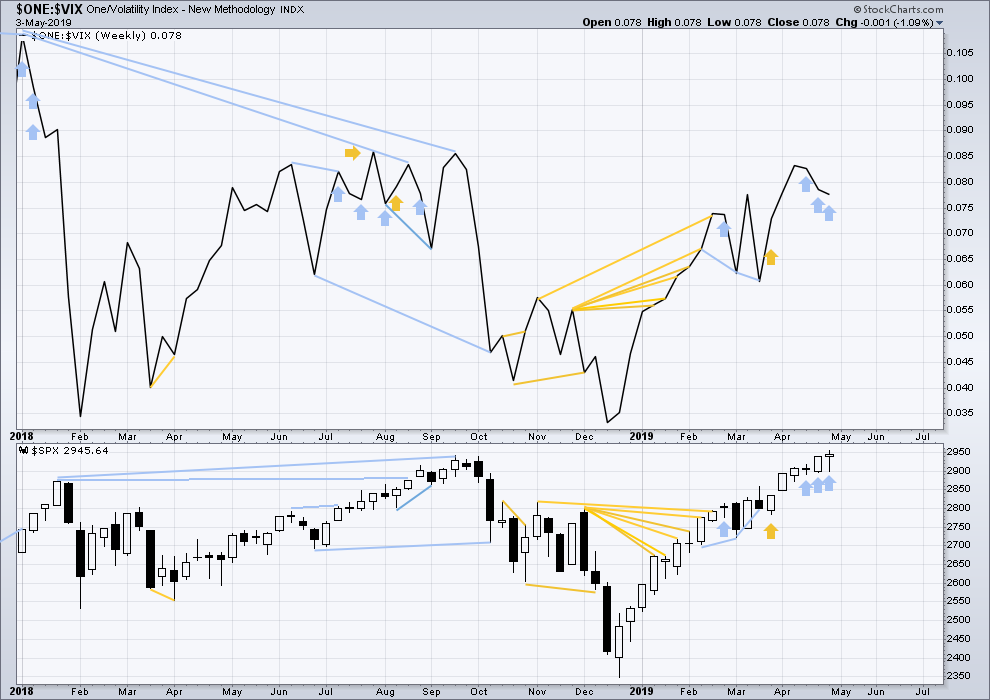
Click chart to enlarge. Chart courtesy of StockCharts.com. So that colour blind members are included, bearish signals
will be noted with blue and bullish signals with yellow.
For now three weeks in a row price has moved higher and inverted VIX has moved lower. This divergence is bearish for the short to mid term and may be warning of an approaching primary (or intermediate) degree correction.
It is noted that this has occurred before at the end of the strong rise in price up to the high on the 26th of January 2018. The three weeks up to that high saw price clearly move higher and inverted VIX clearly move lower. This divergence persisted for three weeks in that instance, and so may persist for a very few weeks again now before price turns.
DAILY CHART
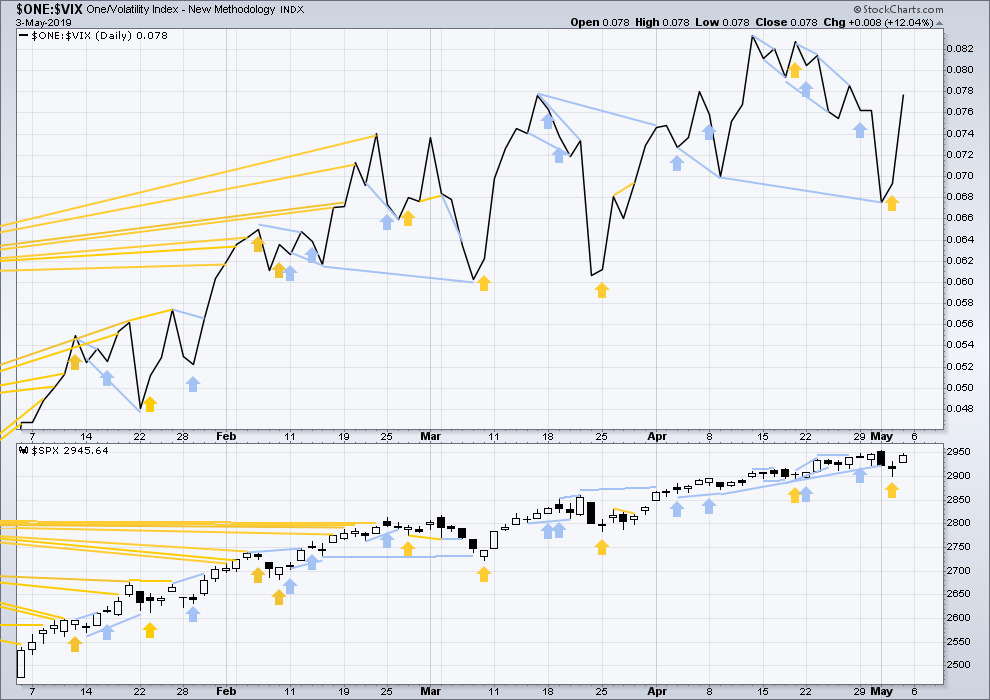
Click chart to enlarge. Chart courtesy of StockCharts.com. So that colour blind members are included, bearish signals
will be noted with blue and bullish signals with yellow.
Short-term bullish divergence noted on Thursday has been followed by an upwards day for Friday. This divergence may now be resolved.
On Friday both inverted VIX and price have moved higher, but neither have made new short-term highs. There is no short-term divergence.
DOW THEORY
Dow Theory confirmed a bear market in December 2018. This does not necessarily mean a bear market at Grand Super Cycle degree though; Dow Theory makes no comment on Elliott wave counts. On the 25th of August 2015 Dow Theory also confirmed a bear market. The Elliott wave count sees that as part of cycle wave II. After Dow Theory confirmation of a bear market in August 2015, price went on to make new all time highs and the bull market continued.
DJIA: 23,344.52 – a close on the 19th of December at 23,284.97 confirms a bear market.
DJT: 9,806.79 – price has closed below this point on the 13th of December.
S&P500: 2,532.69 – a close on the 19th of December at 2,506.96 provides support to a bear market conclusion.
Nasdaq: 6,630.67 – a close on the 19th of December at 6,618.86 provides support to a bear market conclusion.
With all the indices moving now higher, Dow Theory would confirm a bull market if the following highs are made:
DJIA: 26,951.81
DJT: 11,623.58
S&P500: 2,940.91 – a new all time high has been made on the 29th of April 2019.
Nasdaq: 8,133.30 – a new high has been made on 24th of April 2019.
Published @ 12:47 a.m. EST on May 4, 2019.
—
Careful risk management protects your trading account(s).
Follow my two Golden Rules:
1. Always trade with stops.
2. Risk only 1-5% of equity on any one trade.
—
New updates to this analysis are in bold.
Hourly chart update:
The low today is slightly below the low labelled minor wave A, and so within intermediate (W) or (A), minor C has avoided a truncation. This may now be a complete zigzag.
The zigzag labelled intermediate (W) or (A) may be either wave W of a combination, or wave A of a triangle. It may also be wave A of a flat, but that is the least likely structure for primary 4 to be.
Intermediate (X) or (B) may now complete, and in doing so it may make a new all time high. The upper invalidation point is now removed. A new high may be part of intermediate (X) of a combination, or intermediate (B) of a running triangle.
And another big move after the close….
Wow. Yet ANOTHER big reversal type day. Getting a lot of those in the last week, in both directions. Makes me think of the old adage…”churning at the top”.
I am thinking triangle as the launching pad for the next move up. We shall see as time goes by.
But it doesn’t look like we are going to get the McClellan Oscillator reset I spoke to earlier. I would have liked to see that happen.
Thanks to Rodney and Kevin. Your input is appreciated.
At the open, $NYMO is at -40. I want to see a close below -40 which will give us a reset. Then a move above zero and +20 will give a confirmation of the next bull leg up.
I am thinking the current correction, will be the last good opportunity to go long before the assault on SPX 3000 and 3050. It may conclude today or later this week but, perhaps more likely, as Lara shows a combination is is going to take a few weeks of sideways to downwards action before it is over,
The McClellan oscillator resetting is a intermediate term positive. In addition, other overbought oscillators will let off a little steam while returning to a more neutral position.
Good morning to all. I was wondering how much emphasis , if any, you guys place on after hours trading in your analysis? Any guidance would be appreciated.
Thanks
For me, not very much at all for the simple fact the after hours, extended sessions, or over night trading data is not used in the EW charts. One might even say I give it ‘zero’ emphasis.
Now, as far as the premarket trading this morning, all I can say is “Wowza!”
I like to look at /ES with overnight data. It “fills in” the picture for me a bit, and I like to use it to run additional (different, really) fibonacci retrace and extension levels.
For example right now, it’s much more clear from the /ES data that price is in a ii up in what “should be” a five wave down move. I.e, don’t get sucked into this immediate “bounce”. A iii down of this C wave “should be” (one can never be certain) coming. SP500 AD right now is an extremely weak 40/464.
This…
I think it’s a great opportunity to make decisions based on the close… but considering its limit order only volumne is a key indicator AH. Without V, imho, after hours is mostly dominated by little retail guys and gals buying odd lots at random prices.
Nice way not to let anyone go short the market. The ES opened 30 points down and plummeted from there. If you weren’t short on Friday, you lost this big massive wave down…
And that’s what Lara’s count does for yah 🙂
In hindsight… it makes perfect sense that insiders getting first hand knowledge of the coming announcement would sell longs and go short, initiating this 4th wave. Announcement comes, market dives… new low (C)(4), let the news wring out and chop up any retail left…[maybe (x)(y)(4)
…remove a major chunk of cash from the market, convince everyone the bull market is over, cover, go long into the (5).. fbelieve the term commonly used is “bingo-bango”
Thanks to Lara’s consistent foresight I had the courage to hold and add to my shorts. I feel like the curtain is constantly being pulled back with this service.
Monday will be exciting no matter what happens!
Thanks Lara!
Lara,
May the 4th be with you.
Great analysis and commentary as always.
With the breakout to a new ATH, the updated point & figure chart has a target of SPX 3959! Of course, we take things one day at a time. Remember, we are in an uptrend. Surprises certainly may still be to the upside until proven otherwise.
On another topic, yesterday I made the full day of round trip travel to see my orthopedic surgeon. He said I am right where I should be in my 1 year long recovery. He was pleased enough to authorize the second shoulder replacement which will be scheduled for mid to late August of this year. Before that my wife will retire from her Kindergarten teacher career in early June. We will make a 10 day trip to Chicago to see family. Then a two week solo trek in the wildernesses of the northern Rockies. Followed by a 17 day vacation with my wife and two granddaughters who will be 4 & 7 at the time. First to a summer theme park of roller coasters and water slides. Then to the Pacific ocean coast / beaches.
Oh, BTW, #1 for the weekend!
Have a good one everybody.
I like that P&F report, ty Rodney. Lots of evidence that overall, up is more likely than down here in the long term.
Best of health!
– #2
Very happy to hear your shoulder is recovering well!
And thanks for sharing your travel plans, it sounds awesome