
The low today invalidated one hourly chart.
The Elliott wave count has support from a candlestick reversal pattern.
Summary: Primary wave 3 may now be complete. A pullback or consolidation here for primary wave 4 may now last about a couple of weeks or so and may end either about 2,899 or the lower edge of the maroon Elliott channel on the daily chart.
Today the expectation for primary wave 4 to begin has support from a Bearish Engulfing pattern on the daily chart and a cluster of bearish signals from VIX, the last of which is quite strong.
The final target remains the same at 3,045. Alternate monthly wave counts allow for a target as high as 4,119.
The biggest picture, Grand Super Cycle analysis, is here.
Monthly charts were last published here, with video here. There are two further alternate monthly charts here, with video here.
ELLIOTT WAVE COUNTS
The two Elliott wave counts below will be labelled First and Second rather than main and alternate as they may be about of even probability. When the current impulse of primary wave 5 (second wave count) or cycle wave V (first wave count) may be complete, then these two wave counts will diverge on the severity of the expected following bear market. To see an illustration of this future divergence monthly charts should be viewed.
FIRST WAVE COUNT
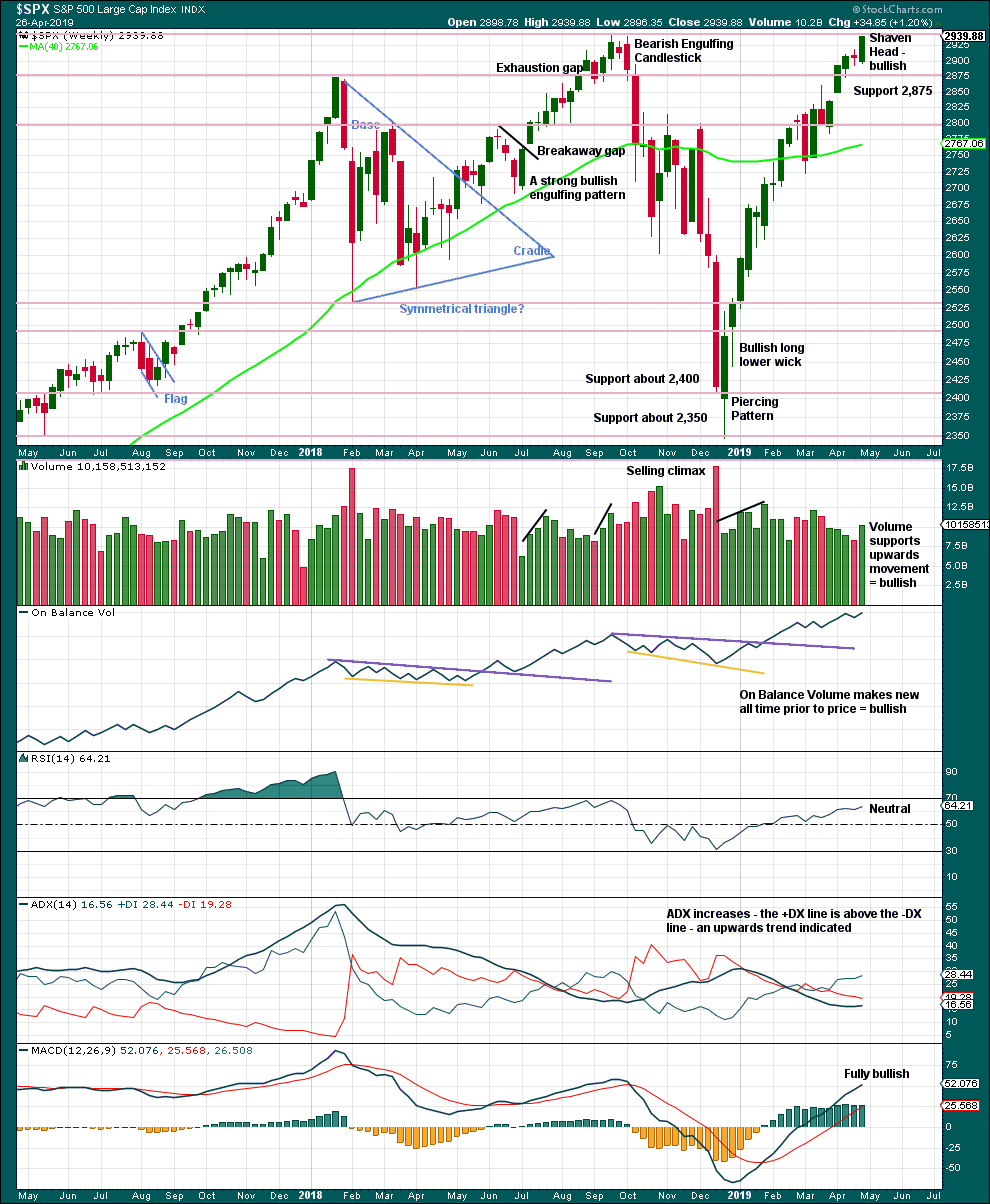
WEEKLY CHART
Click chart to enlarge.
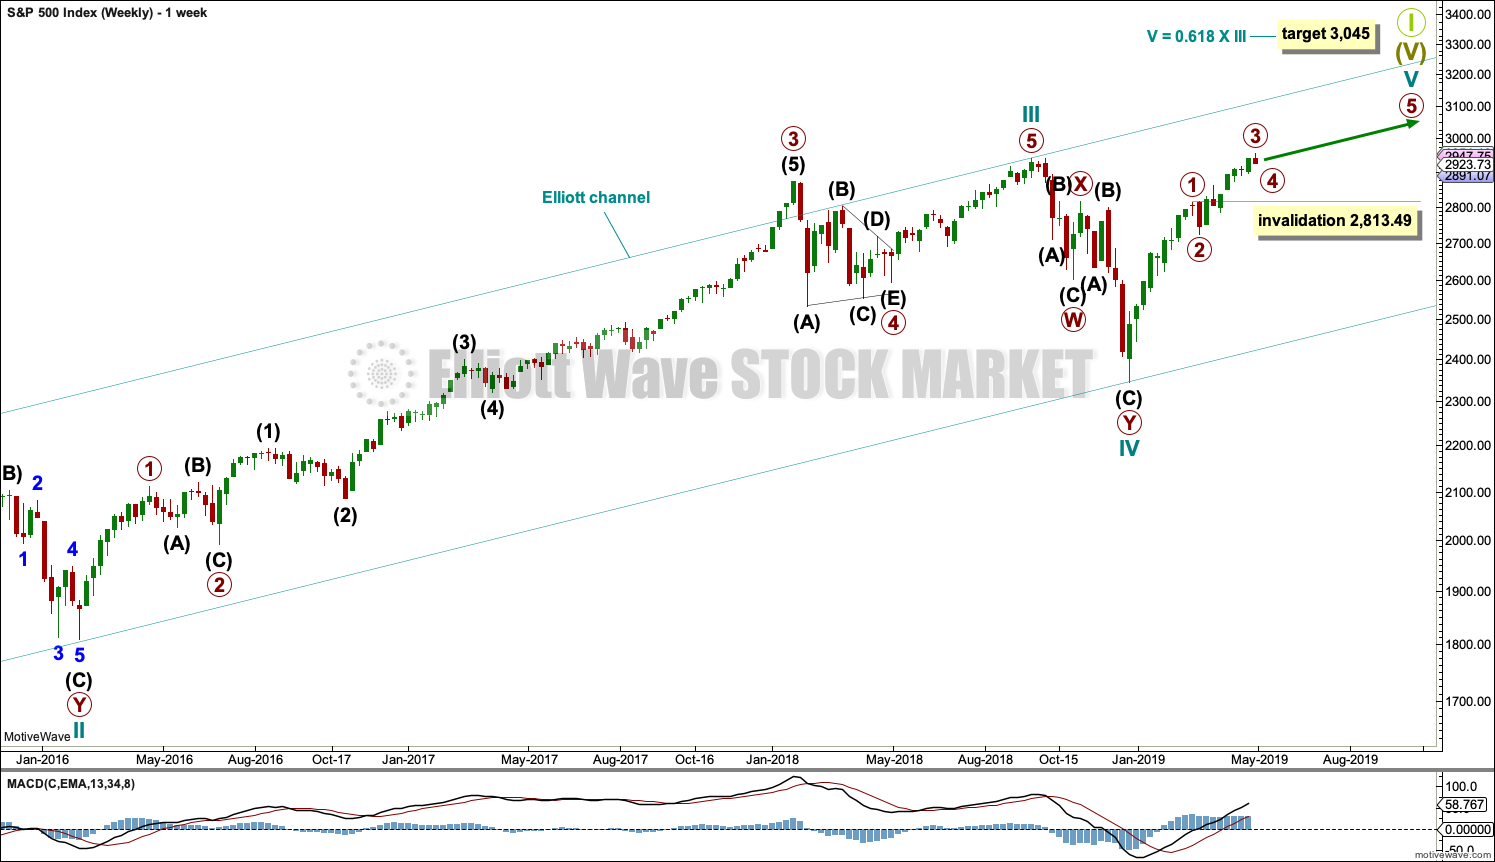
This weekly chart shows all of cycle waves III, IV and V so far.
This wave count expects that when cycle wave V completes Super Cycle wave (V) and Grand Super Cycle wave I, that a huge bear market to potentially last decades may begin. It should move substantially below 666.79.
Cycle wave II fits as a time consuming double combination: flat – X – zigzag. Combinations tend to be more time consuming corrective structures than zigzags. Cycle wave IV has completed as a multiple zigzag that should be expected to be more brief than cycle wave II.
Cycle wave IV may have ended at the lower edge of the Elliott channel.
Within cycle wave V, primary waves 1 through to 3 may now be complete. Primary wave 4 may not move into primary wave 1 price territory below 2,813.49.
Although both cycle waves II and IV are labelled W-X-Y, they are different corrective structures. There are two broad groups of Elliott wave corrective structures: the zigzag family, which are sharp corrections, and all the rest, which are sideways corrections. Multiple zigzags belong to the zigzag family and combinations belong to the sideways family. There is perfect alternation between the possible double zigzag of cycle wave IV and the combination of cycle wave II.
Although there is gross disproportion between the duration of cycle waves II and IV, the size of cycle wave IV in terms of price makes these two corrections look like they should be labelled at the same degree. Proportion is a function of either or both of price and time.
Draw the Elliott channel about Super Cycle wave (V) with the first trend line from the end of cycle wave I (at 2,079.46 on the week beginning 30th November 2014) to the high of cycle wave III, then place a parallel copy on the low of cycle wave II. Cycle wave V may find resistance about the upper edge.
It is possible that cycle wave V may end in October 2019. If it does not end there, or if the AD line makes new all time highs during or after June 2019, then the expectation for cycle wave V to end would be pushed out to March 2020 as the next possibility. Thereafter, the next possibility may be October 2020. March and October are considered as likely months for a bull market to end as in the past they have been popular. That does not mean though that this bull market may not end during any other month.
DAILY CHART
Click chart to enlarge.
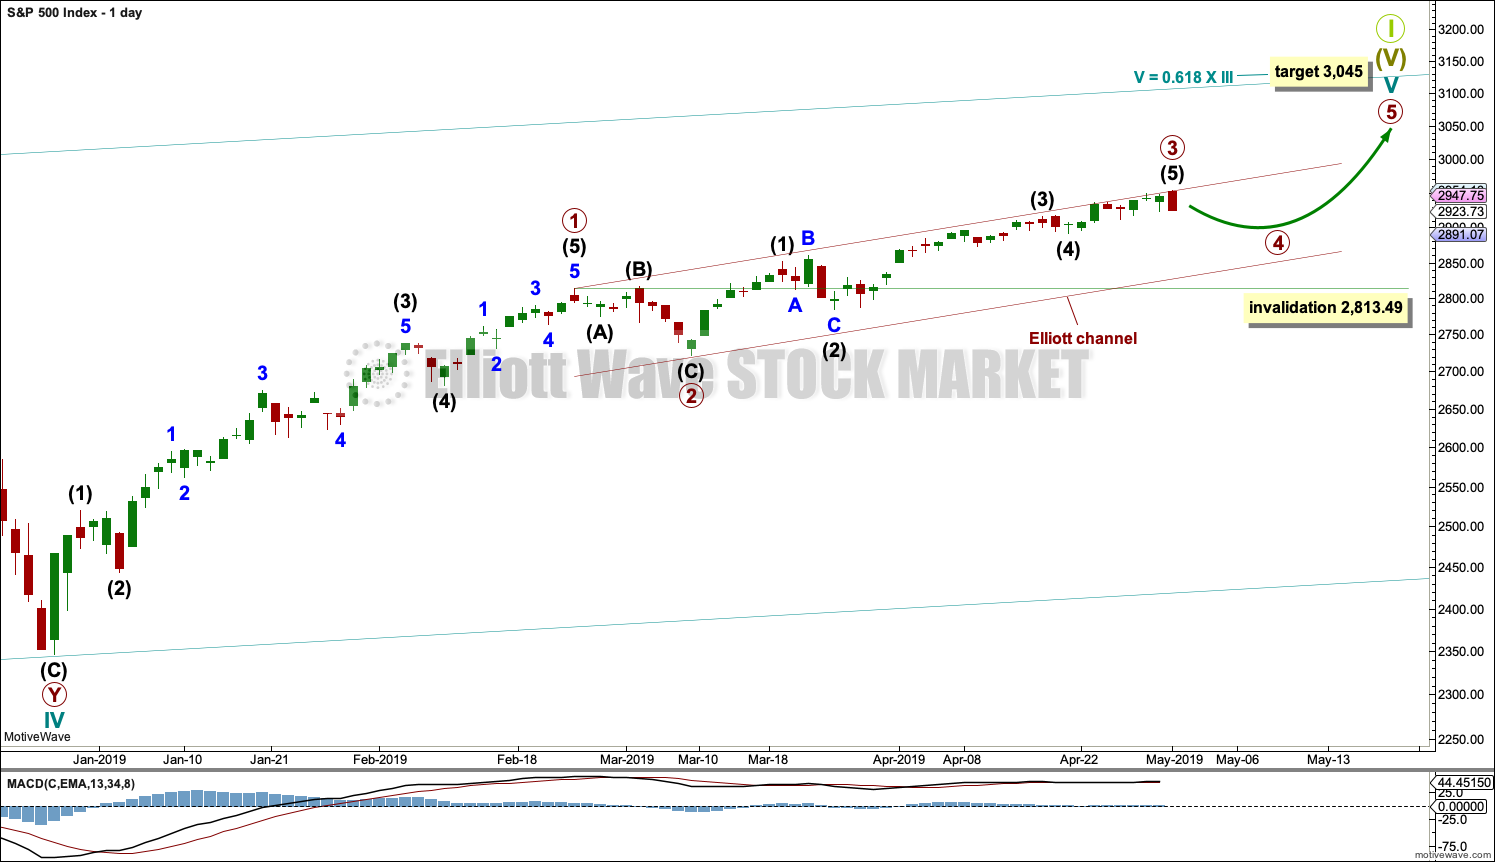
The daily chart will focus on the structure of cycle wave V.
Cycle wave V must subdivide as a five wave motive structure, either an impulse or an ending diagonal. An impulse is much more common and that will be how it is labelled. A diagonal would be considered if overlapping suggests it.
Primary wave 1 may have been a long extension, a smaller fractal of cycle wave I on the monthly chart.
Primary wave 2 may have been a very brief and shallow expanded flat correction, lasting just short of two weeks.
Primary wave 3 may be complete at today’s high. It exhibits no Fibonacci ratio to primary wave 1 and is shorter than primary wave 1. This limits primary wave 5 to no longer than equality in length with primary wave 3 at 231.86 points.
Primary wave 4 may be expected to exhibit alternation with primary wave 2. Primary wave 4 may most likely unfold as a single or multiple zigzag, but it may also unfold as a triangle or combination. The least likely structure would be a flat.
A channel is drawn using Elliott’s first technique about the impulse of cycle wave V. Draw the first trend line from the ends of primary waves 1 to 3, then place a parallel copy on the end of primary wave 2. If it is long lasting enough, primary wave 4 may find support about the lower edge of this channel.
Primary wave 4 may not move into primary wave 1 price territory below 2,813.49.
HOURLY CHART
Click chart to enlarge.
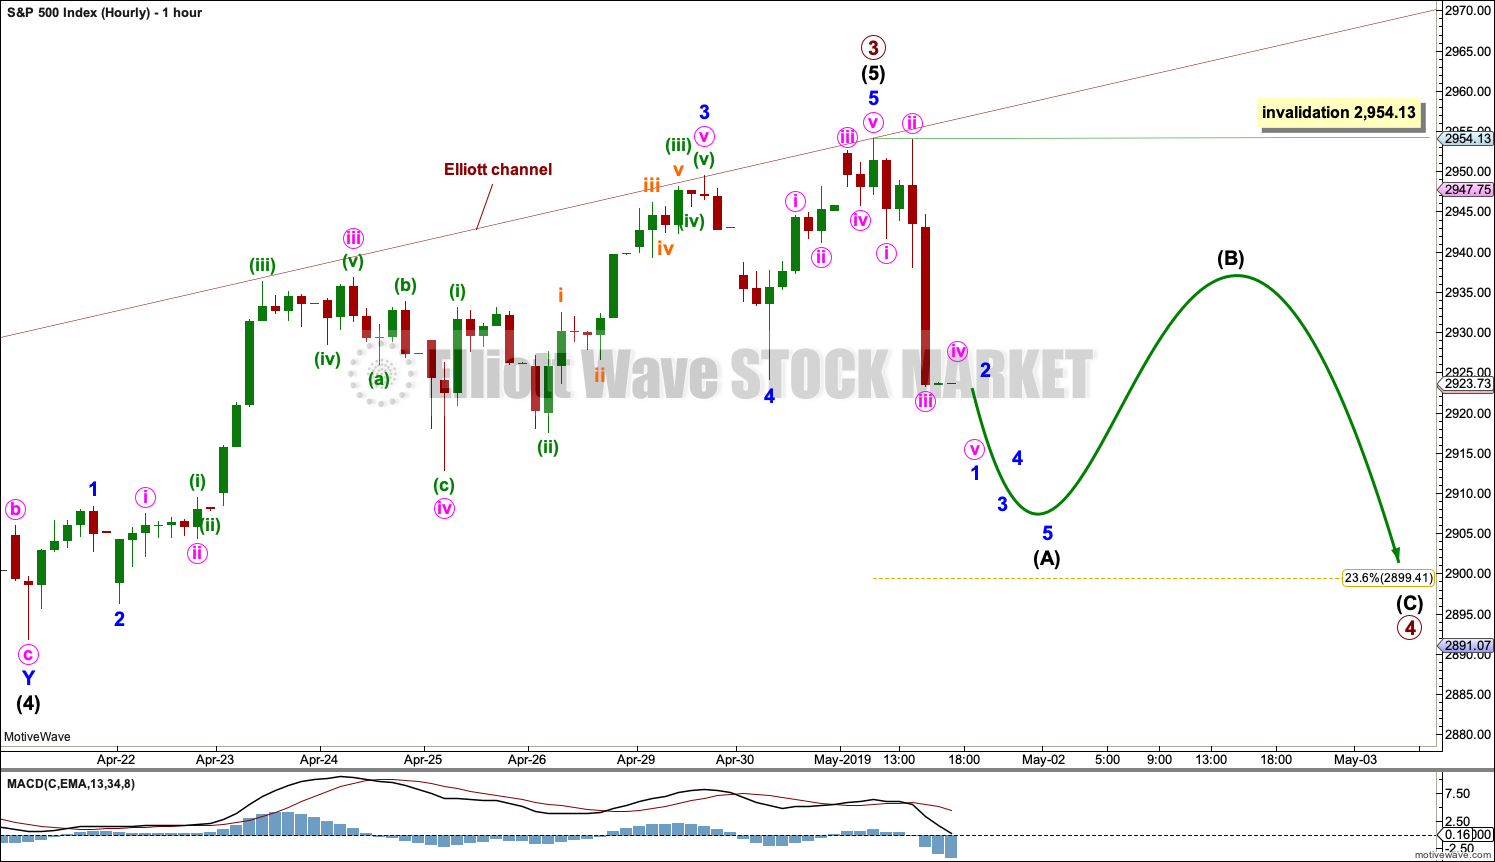
If primary wave 4 has begun, then it should exhibit a five down at the hourly chart level.
Primary wave 4 would most likely subdivide as a single or double zigzag. Within these structures, the first wave labelled wave A should subdivide as a five wave structure, and within this minor wave 1 may be incomplete. Minor wave 2 may not move beyond the start of minor wave 1 above 2,949.52.
Primary wave 4 may end within the price territory of the fourth wave of one lesser degree; within this range sits the 0.236 Fibonacci ratio of primary wave 3. This gives a reasonable target for primary wave 4 to end.
SECOND WAVE COUNT
WEEKLY CHART
Click chart to enlarge.
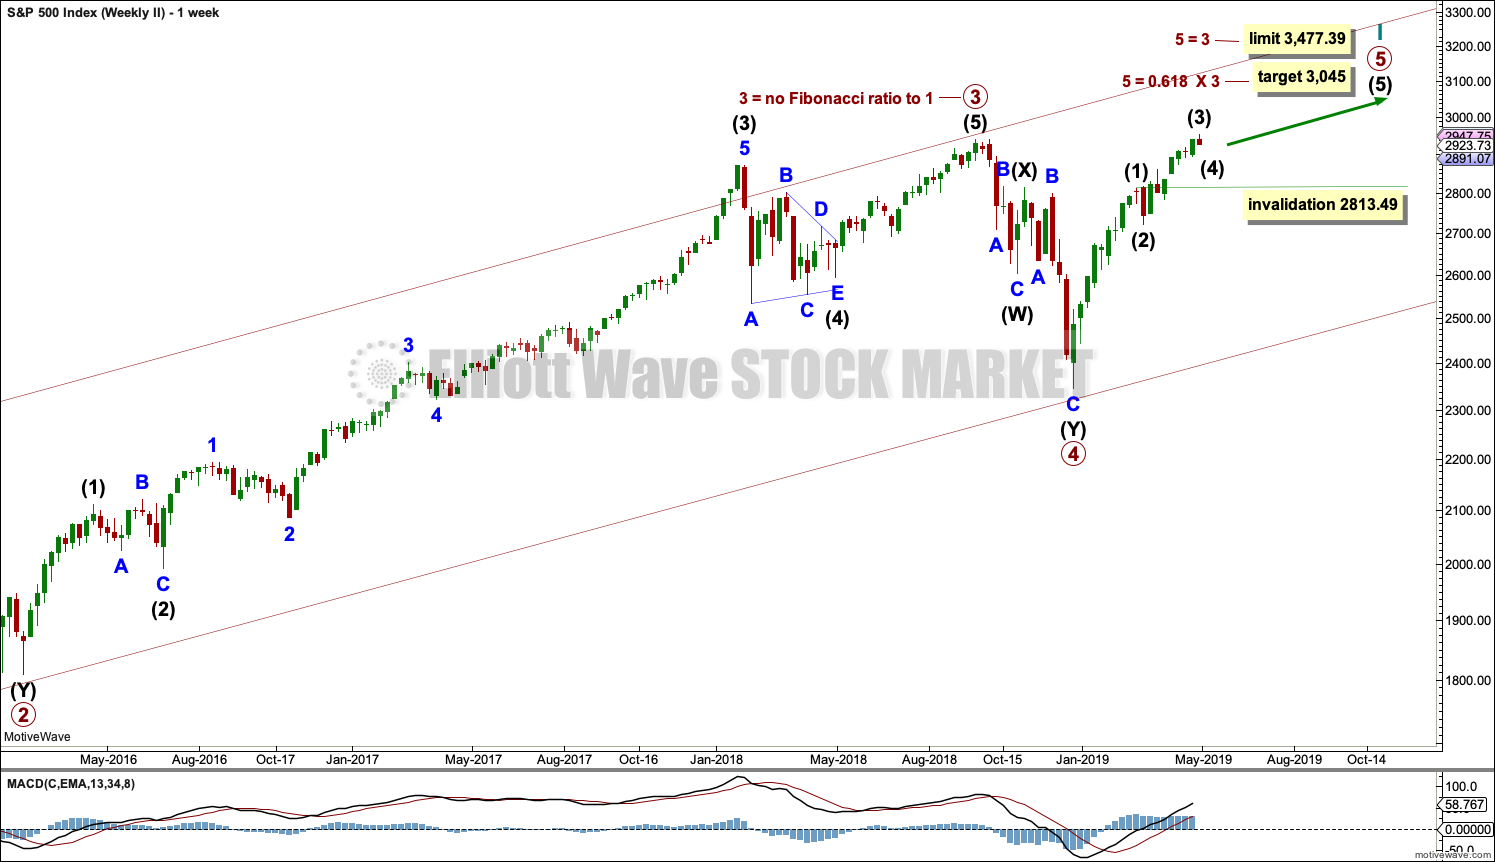
This weekly chart is identical to the first weekly chart, with the sole difference being the degree of labelling.
When cycle wave I is complete, then cycle wave II should meet the technical definition of a bear market as it should retrace more than 20% of cycle wave I, but it may end about either the 0.382 or 0.618 Fibonacci Ratios of cycle wave I. Cycle wave II may end close to the low of primary wave 2 within cycle wave I, which is at 1,810.10.
Thereafter, a new bull market for cycle wave III may begin. It should have support from volume and fundamentals.
The end of Grand Super Cycle wave I may be about 10 years or so away.
TECHNICAL ANALYSIS
WEEKLY CHART
Click chart to enlarge. Chart courtesy of et=”_blank”>StockCharts.com.
Next resistance is about the prior all time high about 2,940.
This chart is fully bullish.
DAILY CHART
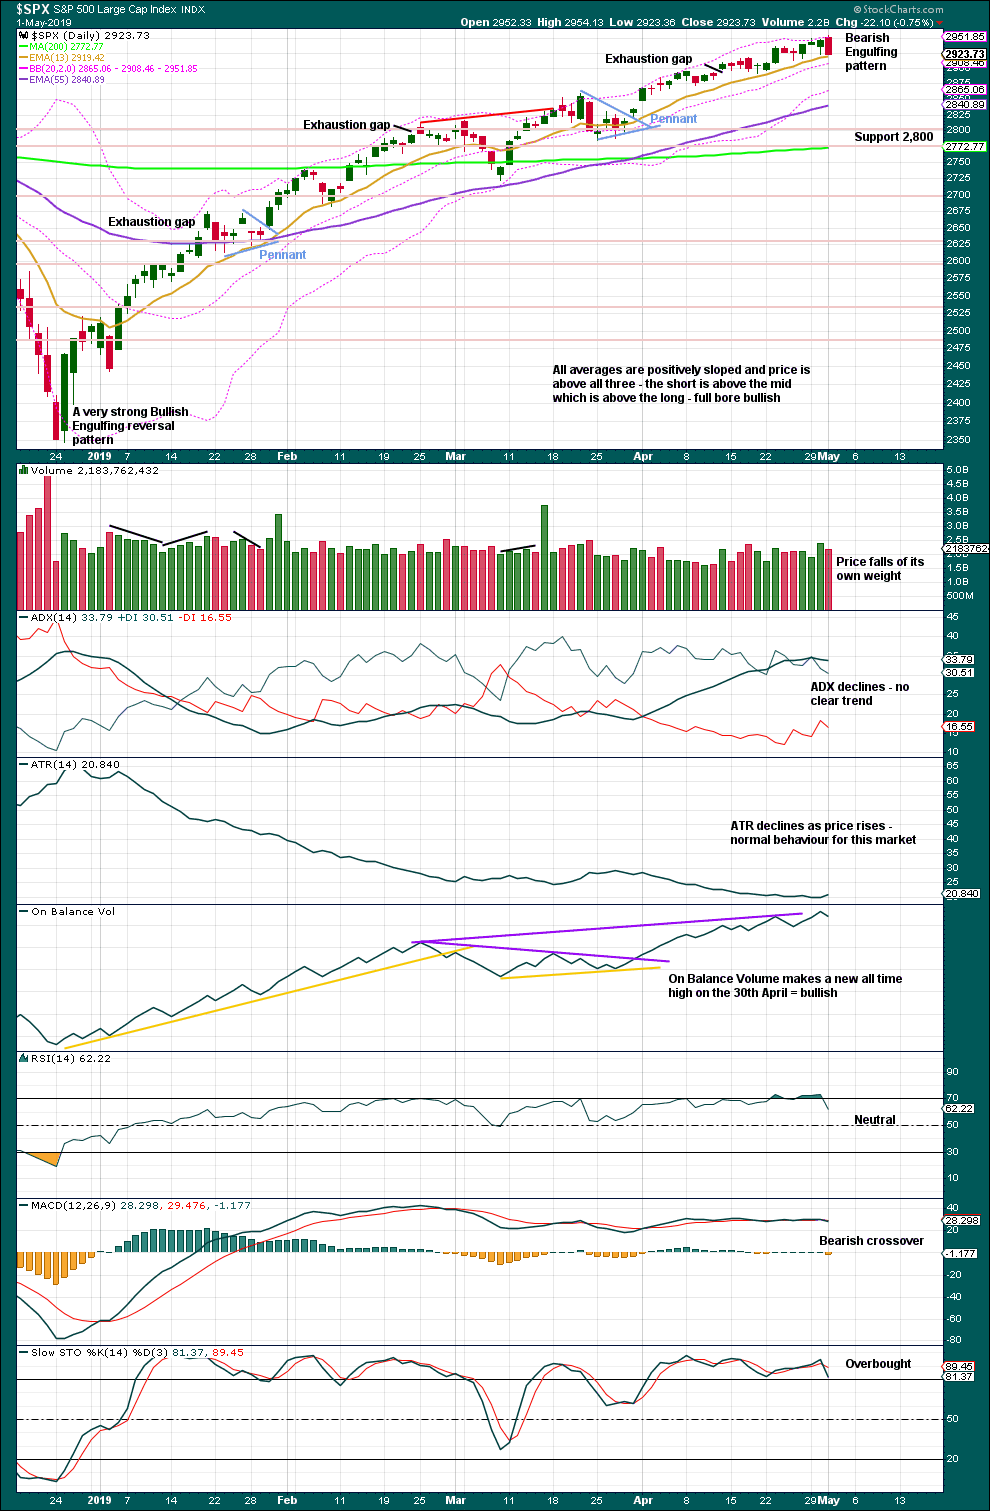
Click chart to enlarge. Chart courtesy of StockCharts.com.
The December 2018 low is expected to remain intact. The two 90% upwards days on 26th December 2018 and 6th January 2019 indicate this upwards trend has internal strength.
The Bearish Engulfing candlestick engulfs the two prior daily candlesticks. Coming after upwards movement, which has reached extreme, it should be given weight. This is a fairly strong bearish reversal signal.
BREADTH – AD LINE
WEEKLY CHART
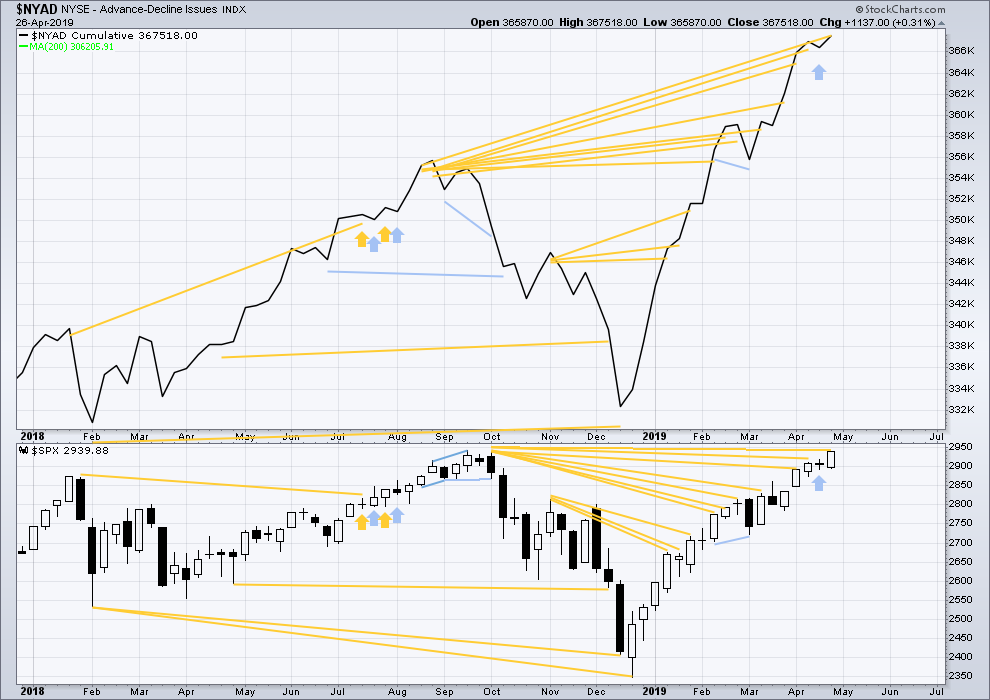
Click chart to enlarge. Chart courtesy of StockCharts.com. So that colour blind members are included, bearish signals
will be noted with blue and bullish signals with yellow.
Every single bear market from the Great Depression and onwards has been preceded by a minimum of 4 months divergence between price and the AD line. With the AD line making a new all time high again in April, the end of this bull market and the start of a new bear market must be a minimum of 4 months away, which is the end of August 2019 at this time.
Last week the AD line makes another new all time high with price failing to make a corresponding new all time high by the slimmest of margins at 1.03 points.
Mid and large caps have both made new highs above the swing high of the 25th of February, but small caps have not. However, small caps AD line has made a new all time high on the 12th of April indicating broad strength underlying this market. Mid and small caps continue to lag. This rise is driven primarily by large caps, which is typical for an aged bull market.
DAILY CHART
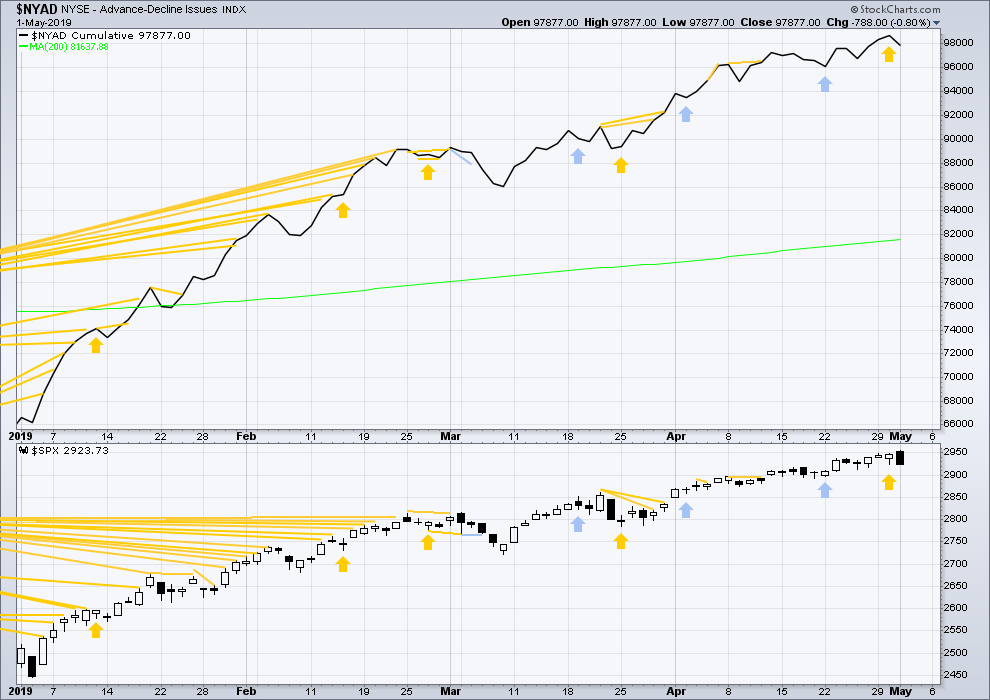
Click chart to enlarge. Chart courtesy of StockCharts.com. So that colour blind members are included, bearish signals
will be noted with blue and bullish signals with yellow.
Breadth should be read as a leading indicator.
Both price and the AD line have moved lower today. Downwards movement has support from declining market breadth. The AD line is not falling any faster than price. There is no short-term divergence.
VOLATILITY – INVERTED VIX CHART
WEEKLY CHART
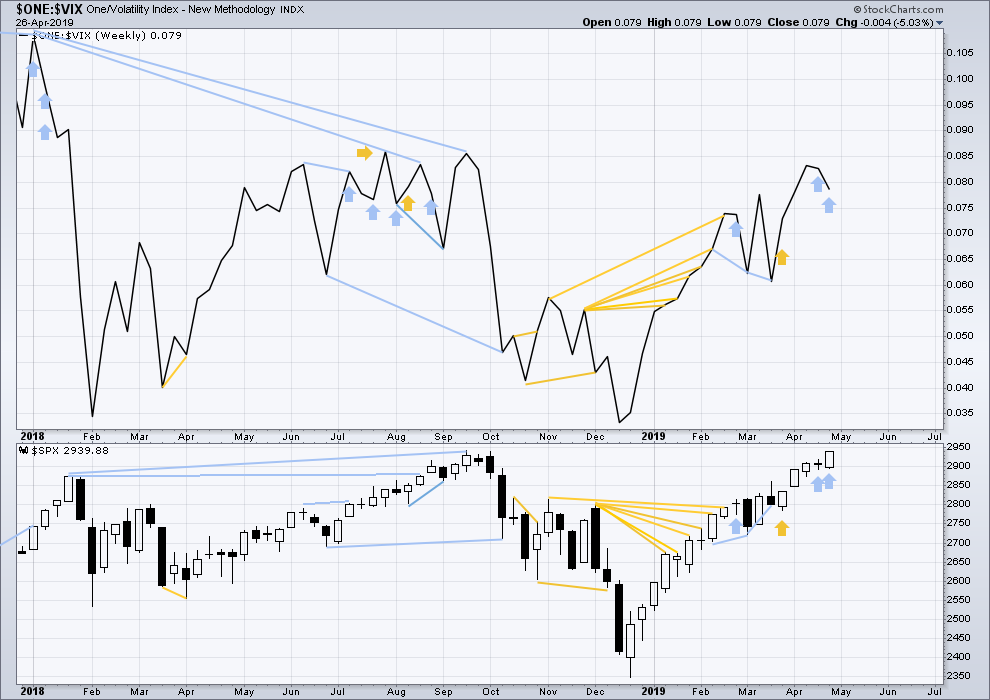
Click chart to enlarge. Chart courtesy of StockCharts.com. So that colour blind members are included, bearish signals
will be noted with blue and bullish signals with yellow.
For two weeks in a row price has moved higher and inverted VIX has moved lower. The week before last was not so clear as the weekly price candlestick was red, but last week is clear. Price has moved strongly higher, but inverted VIX has moved strongly lower. This divergence is bearish for the short to mid term and may be warning of an approaching primary (or intermediate) degree correction.
It is noted that this has occurred before at the end of the strong rise in price up to the high on the 26th of January 2018. The three weeks up to that high saw price clearly move higher and inverted VIX clearly move lower. This divergence persisted for three weeks in that instance, and so may persist for a very few weeks again now before price turns.
DAILY CHART
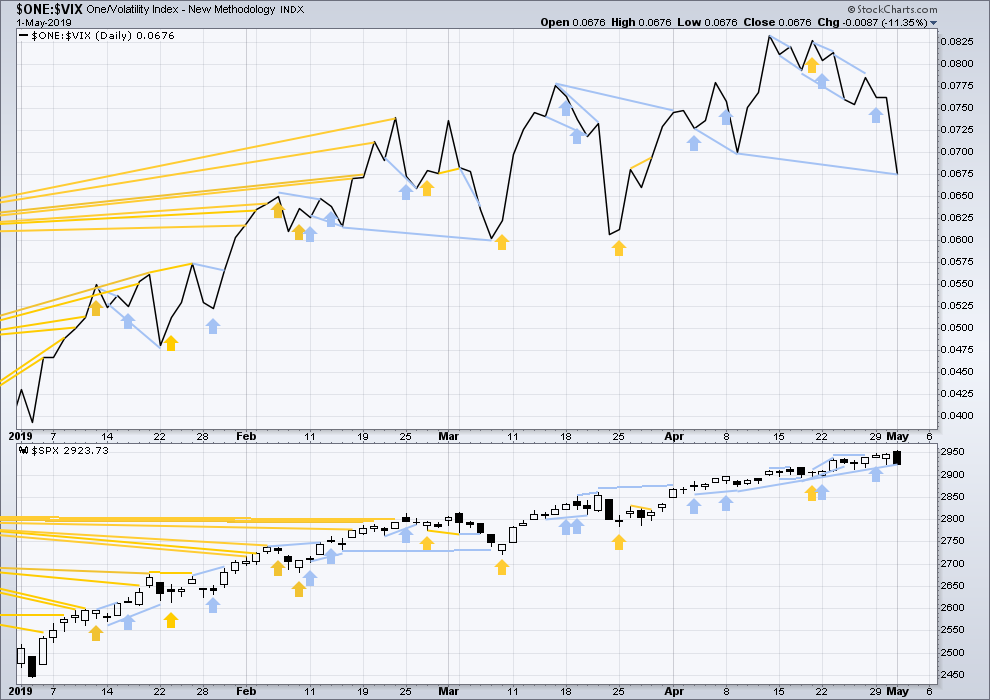
Click chart to enlarge. Chart courtesy of StockCharts.com. So that colour blind members are included, bearish signals
will be noted with blue and bullish signals with yellow.
Both price and inverted VIX moved lower today. Inverted VIX has made a new swing low below the low of the 9th of April, but price has not. The fall in price comes with a strong increase in VIX. This divergence is bearish for the mid term.
In conjunction with a now cluster of bearish signals from inverted VIX, this is given some reasonable weight in this analysis.
DOW THEORY
Dow Theory confirmed a bear market in December 2018. This does not necessarily mean a bear market at Grand Super Cycle degree though; Dow Theory makes no comment on Elliott wave counts. On the 25th of August 2015 Dow Theory also confirmed a bear market. The Elliott wave count sees that as part of cycle wave II. After Dow Theory confirmation of a bear market in August 2015, price went on to make new all time highs and the bull market continued.
DJIA: 23,344.52 – a close on the 19th of December at 23,284.97 confirms a bear market.
DJT: 9,806.79 – price has closed below this point on the 13th of December.
S&P500: 2,532.69 – a close on the 19th of December at 2,506.96 provides support to a bear market conclusion.
Nasdaq: 6,630.67 – a close on the 19th of December at 6,618.86 provides support to a bear market conclusion.
With all the indices moving now higher, Dow Theory would confirm a bull market if the following highs are made:
DJIA: 26,951.81
DJT: 11,623.58
S&P500: 2,940.91 – a new all time high has been made on the 29th of April 2019.
Nasdaq: 8,133.30 – a new high has been made on 24th of April 2019.
Published @ 09:33 p.m. EST.
—
Careful risk management protects your trading account(s).
Follow my two Golden Rules:
1. Always trade with stops.
2. Risk only 1-5% of equity on any one trade.
—
New updates to this analysis are in bold.
Hourly chart updated:
I am moving the degree of labelling in the first wave down of P4 all up one degree, considering the length of it within the channel.
Intermediate (A) may now be a complete impulse. Intermediate (B) may be beginning. It may take its time and may be a very complicated choppy movement. We may see overlapping sideways movement for a week or so here.
Then a downwards breakout for intermediate (C).
Next target for primary 4 is the 0.382 Fibonacci ratio at 2,865.56. Next target after that is the lower edge of the maroon Elliott channel which you can see on the daily chart.
my first target for this sell off is 2886 where there’s multiple fibo support and a bunch of swing highs.
After that, I see it down to the 2860-67 level (a 38% at 2867 and a major swing high at 2860 on 3/21). Symmetric projections of the prior couple of consolidation moves point to the deeper zone as the likely eventual bottom here. But first…this initial 5 wave looks close to complete, and there should be an ABC bounce eh? So far the action is tracking very similar to the 3/4-7 down move.
RUT has a double top in place. If that plays out, the measured move takes price down to below 1400 (current price is 1569). Oh, shock and awe! Just happens to be just about the 62% retrace level of the entire Dec low – April high move. Don’t know if that’s what going to happen here of course but…it is setting up that way at the moment.
Agree, looking at spy 288.9 for support
If Lara’s call is even remotely correct, price will be going far deeper than that in the next day or three. You are probably referring to a short term “B wave” (or 2 wave) bounce point, which is now underway I think, and price got close to 289 but not quite.
yup, bought SPXL at the low, since “I also hate B waves”i don’t want to deal with options during them
RUT very strong today, massive reversal on the hourly on a turn off overlapped 78% and 62% retrace levels. Scratching my head a little re: primary 4 call for SPX. SPX is acting according to Hoyle so far, per the hourly main. But RUT’s strength is surprising and a I think a note of caution for those expecting significant downwards movement over the next few days here (yet the bears went into hibernation but I know they are stirring around in their dens now).
And RUT does a U turn and sells off hard. Crazy action today. Consistent with price being in some kind of big ii or iv, for sure.
yes, its been a great day for trading so far
Lara can you comment on how you see the feasibility of an expanding triangle off the Jan ’18 highs, making the move up from the Dec’18 lows a D wave, which has an ABC structure where the B is what you are showing as the primary 2 in the daily main. Rational or a wild flight of the imagination?
In my now 11 years of daily EW analysis, and research on the daily charts of Gold, S&P500 and Bitcoin, I have not seen a movement which after the fact needed to be labelled as an expanding triangle.
The shorter answer is, I have never seen one.
So, the probability is exceptionally low. Other possibilities should be explored first.
Awesome, thank you.
Yippee! #1 today. Good mojo coming my way.