
Overall, upwards movement continues as expected. The Elliott wave target remains the same.
Two hourly charts are published today for the short-term picture.
Summary: The upwards trend remains intact and there is underlying strength in this market still. The next mid-term target is at 3,010.
A cluster of bearish signals from VIX sounds a warning of a possible approaching larger consolidation or pullback. Near-term caution is warranted at this time.
The final target remains the same at 3,045. Alternate monthly wave counts allow for a target as high as 4,119.
The biggest picture, Grand Super Cycle analysis, is here.
Monthly charts were last published here, with video here. There are two further alternate monthly charts here, with video here.
ELLIOTT WAVE COUNTS
The two Elliott wave counts below will be labelled First and Second rather than main and alternate as they may be about of even probability. When the current impulse of primary wave 5 (second wave count) or cycle wave V (first wave count) may be complete, then these two wave counts will diverge on the severity of the expected following bear market. To see an illustration of this future divergence monthly charts should be viewed.
FIRST WAVE COUNT
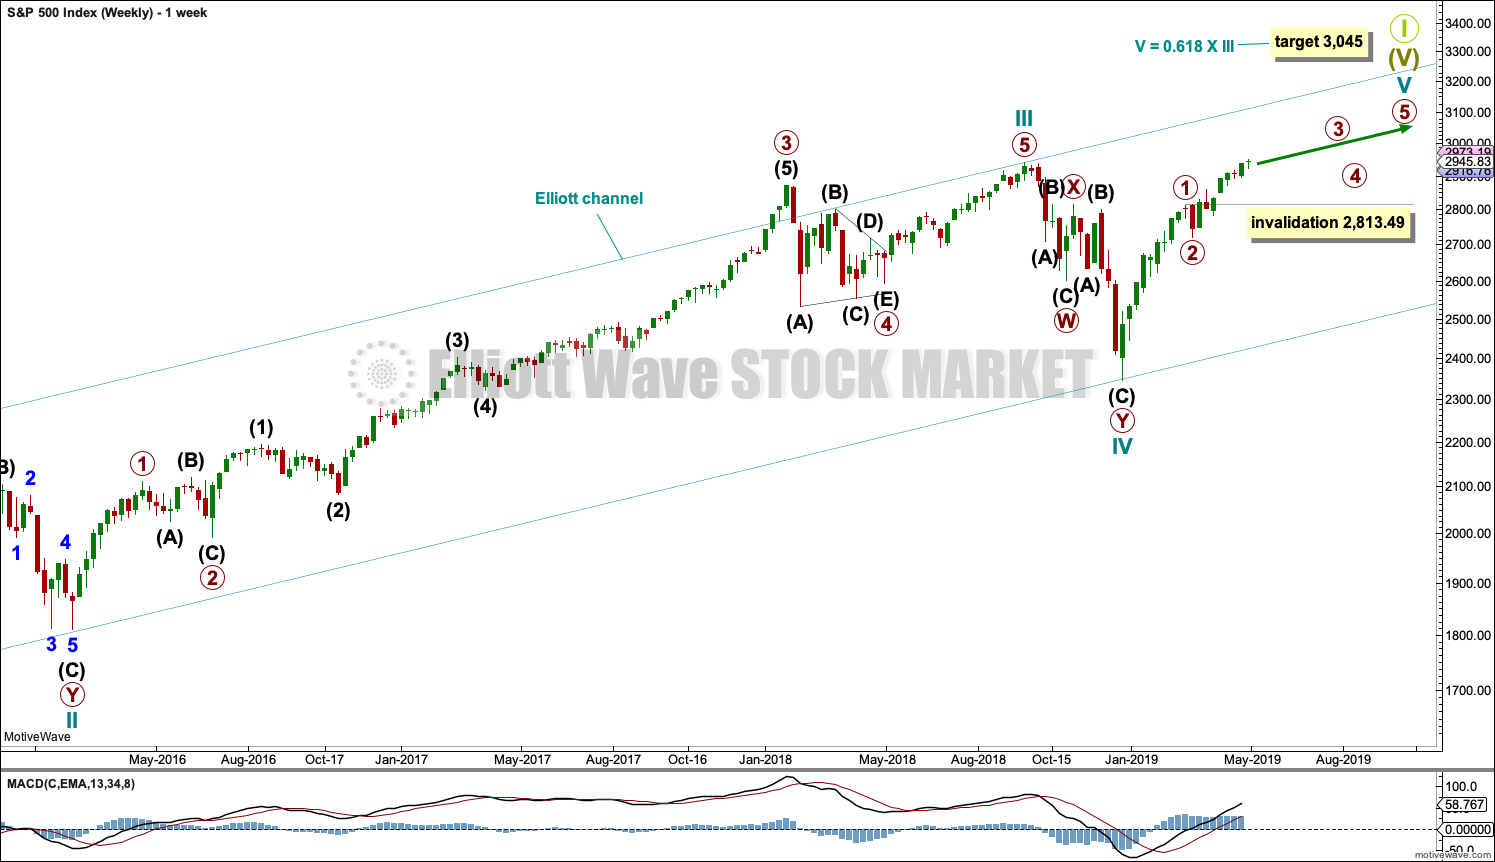
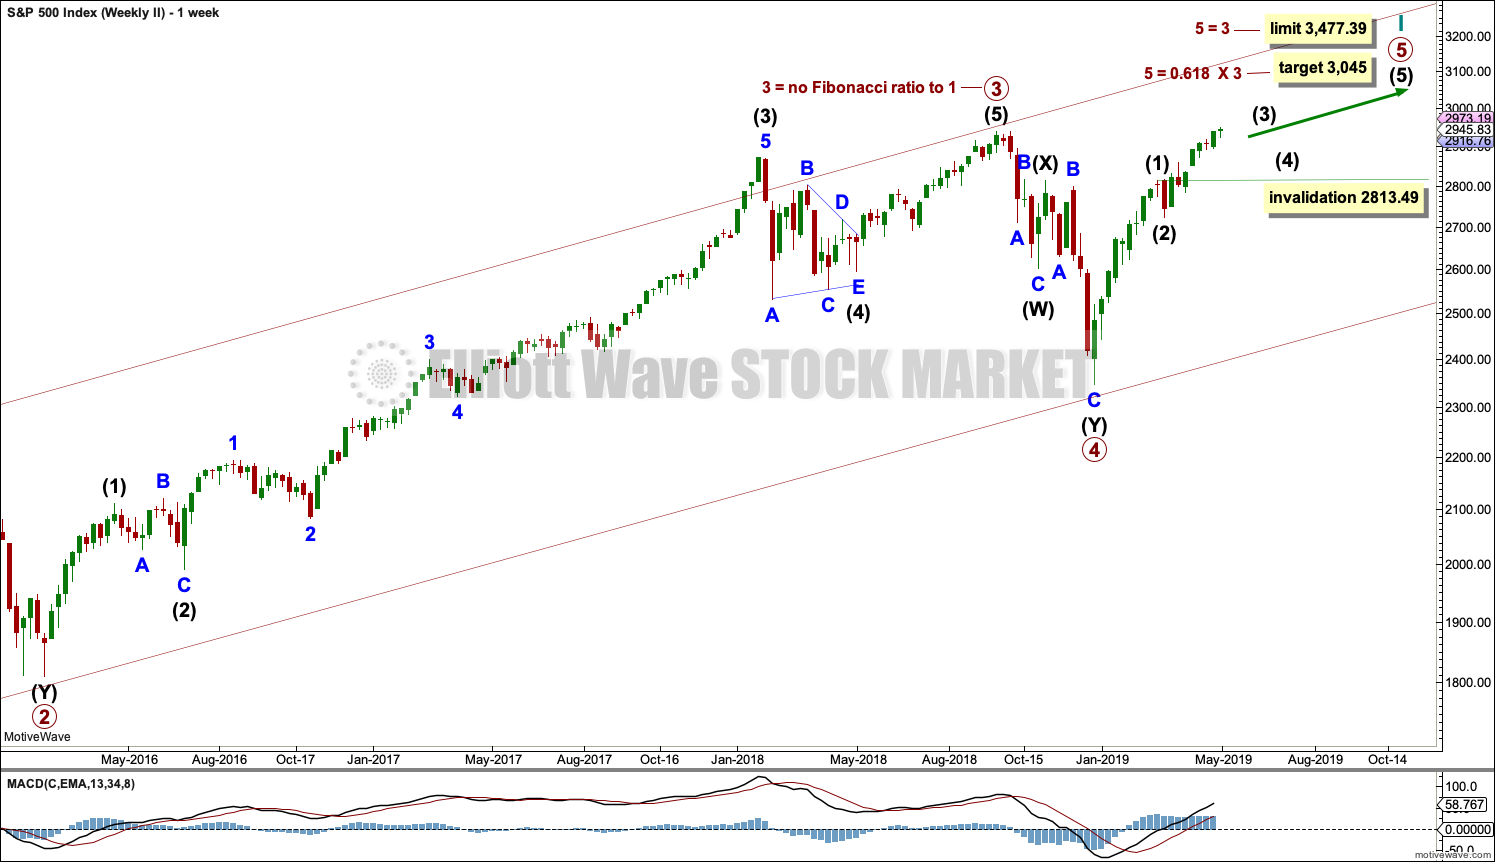
WEEKLY CHART
Click chart to enlarge.
This weekly chart shows all of cycle waves III, IV and V so far.
This wave count expects that when cycle wave V completes Super Cycle wave (V) and Grand Super Cycle wave I, that a huge bear market to potentially last decades may begin. It should move substantially below 666.79.
Cycle wave II fits as a time consuming double combination: flat – X – zigzag. Combinations tend to be more time consuming corrective structures than zigzags. Cycle wave IV has completed as a multiple zigzag that should be expected to be more brief than cycle wave II.
Cycle wave IV may have ended at the lower edge of the Elliott channel.
Within cycle wave V, primary waves 1 and 2 may now be complete. Primary wave 3 has moved above the end of primary wave 1. When it arrives, primary wave 4 may not move into primary wave 1 price territory below 2,813.49.
Although both cycle waves II and IV are labelled W-X-Y, they are different corrective structures. There are two broad groups of Elliott wave corrective structures: the zigzag family, which are sharp corrections, and all the rest, which are sideways corrections. Multiple zigzags belong to the zigzag family and combinations belong to the sideways family. There is perfect alternation between the possible double zigzag of cycle wave IV and the combination of cycle wave II.
Although there is gross disproportion between the duration of cycle waves II and IV, the size of cycle wave IV in terms of price makes these two corrections look like they should be labelled at the same degree. Proportion is a function of either or both of price and time.
Draw the Elliott channel about Super Cycle wave (V) with the first trend line from the end of cycle wave I (at 2,079.46 on the week beginning 30th November 2014) to the high of cycle wave III, then place a parallel copy on the low of cycle wave II. Cycle wave V may find resistance about the upper edge.
It is possible that cycle wave V may end in October 2019. If it does not end there, or if the AD line makes new all time highs during or after June 2019, then the expectation for cycle wave V to end would be pushed out to March 2020 as the next possibility. Thereafter, the next possibility may be October 2020. March and October are considered as likely months for a bull market to end as in the past they have been popular. That does not mean though that this bull market may not end during any other month.
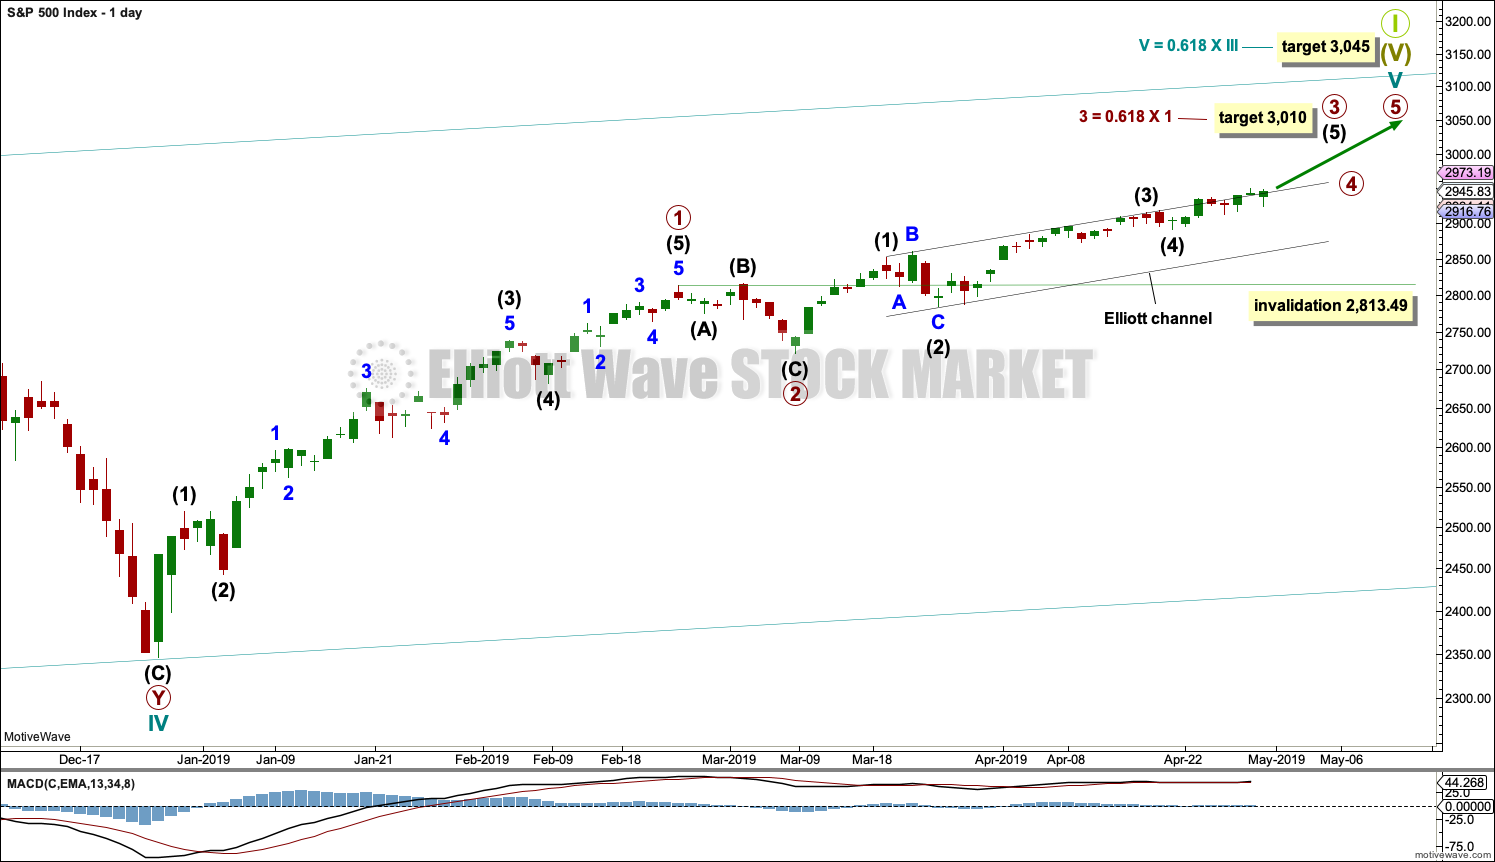
DAILY CHART
Click chart to enlarge.
The daily chart will focus on the structure of cycle wave V.
Cycle wave V must subdivide as a five wave motive structure, either an impulse or an ending diagonal. An impulse is much more common and that will be how it is labelled. A diagonal would be considered if overlapping suggests it.
Primary wave 1 may have been a long extension, a smaller fractal of cycle wave I on the monthly chart.
Primary wave 2 may have been a very brief and shallow expanded flat correction.
Within primary wave 3, intermediate waves (1) through to (4) may be complete. Intermediate wave (5) to end primary wave 3 may end soon or may yet continue to extend. When it is complete, then primary wave 3 may be complete.
Primary wave 4 may not move into primary wave 1 price territory below 2,813.49.
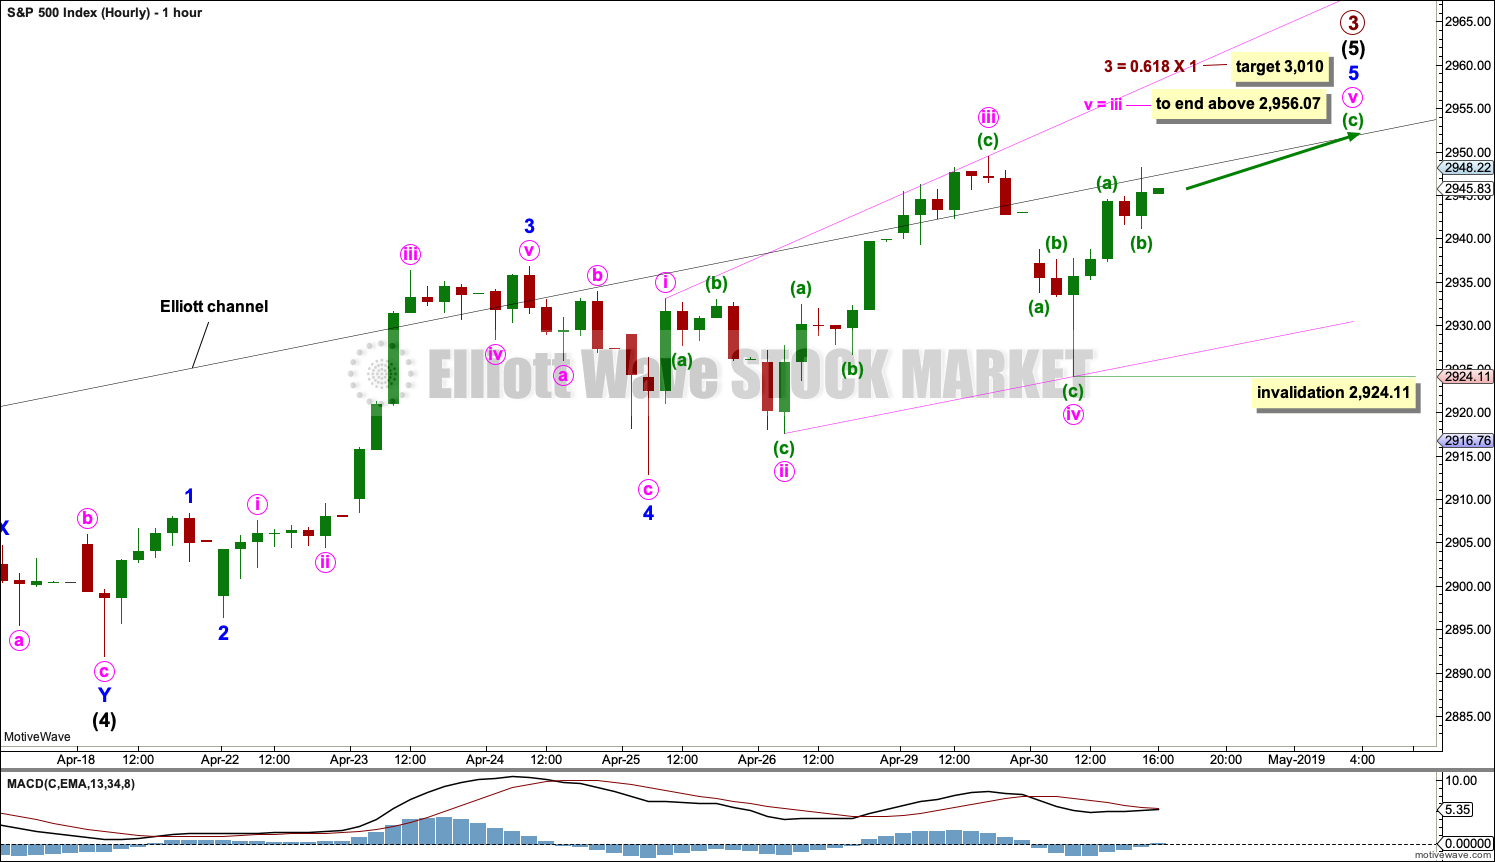
HOURLY CHART
Click chart to enlarge.
So far minor waves 1 through to 4 within intermediate wave (5) may all be complete. Minor wave 3 is just 2.7 points short of 2.618 the length of minor wave 1. With a Fibonacci ratio already between two of the three actionary waves within intermediate wave (5), minor wave 5 may not exhibit a Fibonacci ratio to either of minor waves 1 or 3. The target calculation will be left at primary degree.
Minor wave 5 may be unfolding as an ending expanding diagonal. Within an expanding diagonal, minute wave v must be longer than minute wave iii. The target remains the same and would see the diagonal meet all Elliott wave rules.
Within an ending diagonal, all sub-waves must subdivide as zigzags. Within the zigzag of minute wave v, if minuette wave (b) is yet to unfold, then it may not move beyond the start of minuette wave (a) below 2,924.11.
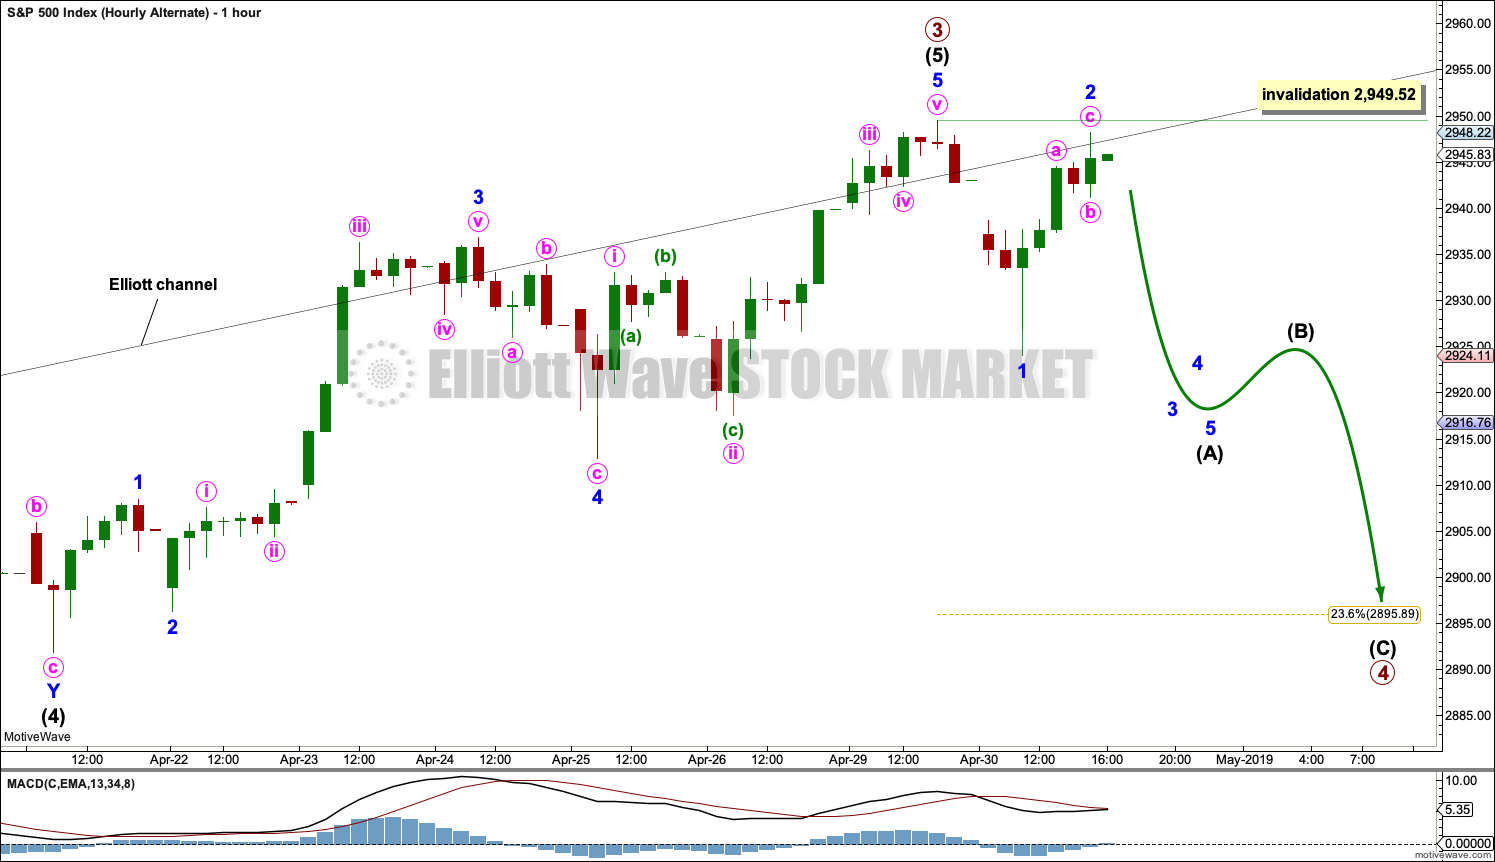
ALTERNATE HOURLY CHART
Click chart to enlarge.
It is possible today that primary wave 3 may be over and primary wave 4 may have just begun. However, this alternate wave count does not have support from classic technical analysis today.
If primary wave 4 has begun, then it should exhibit a five down at the hourly chart level. This will be labelled intermediate wave (A), and it would be incomplete. Minor wave 2 may not move beyond the start of minor wave 1 above 2,949.52.
Primary wave 4 may end within the price territory of the fourth wave of one lesser degree; within this range sits the 0.236 Fibonacci ratio of primary wave 3. This gives a reasonable target for primary wave 4 to end.
SECOND WAVE COUNT
WEEKLY CHART
Click chart to enlarge.
This weekly chart is identical to the first weekly chart, with the sole difference being the degree of labelling.
When cycle wave I is complete, then cycle wave II should meet the technical definition of a bear market as it should retrace more than 20% of cycle wave I, but it may end about either the 0.382 or 0.618 Fibonacci Ratios of cycle wave I. Cycle wave II may end close to the low of primary wave 2 within cycle wave I, which is at 1,810.10.
Thereafter, a new bull market for cycle wave III may begin. It should have support from volume and fundamentals.
The end of Grand Super Cycle wave I may be about 10 years or so away.
TECHNICAL ANALYSIS
WEEKLY CHART
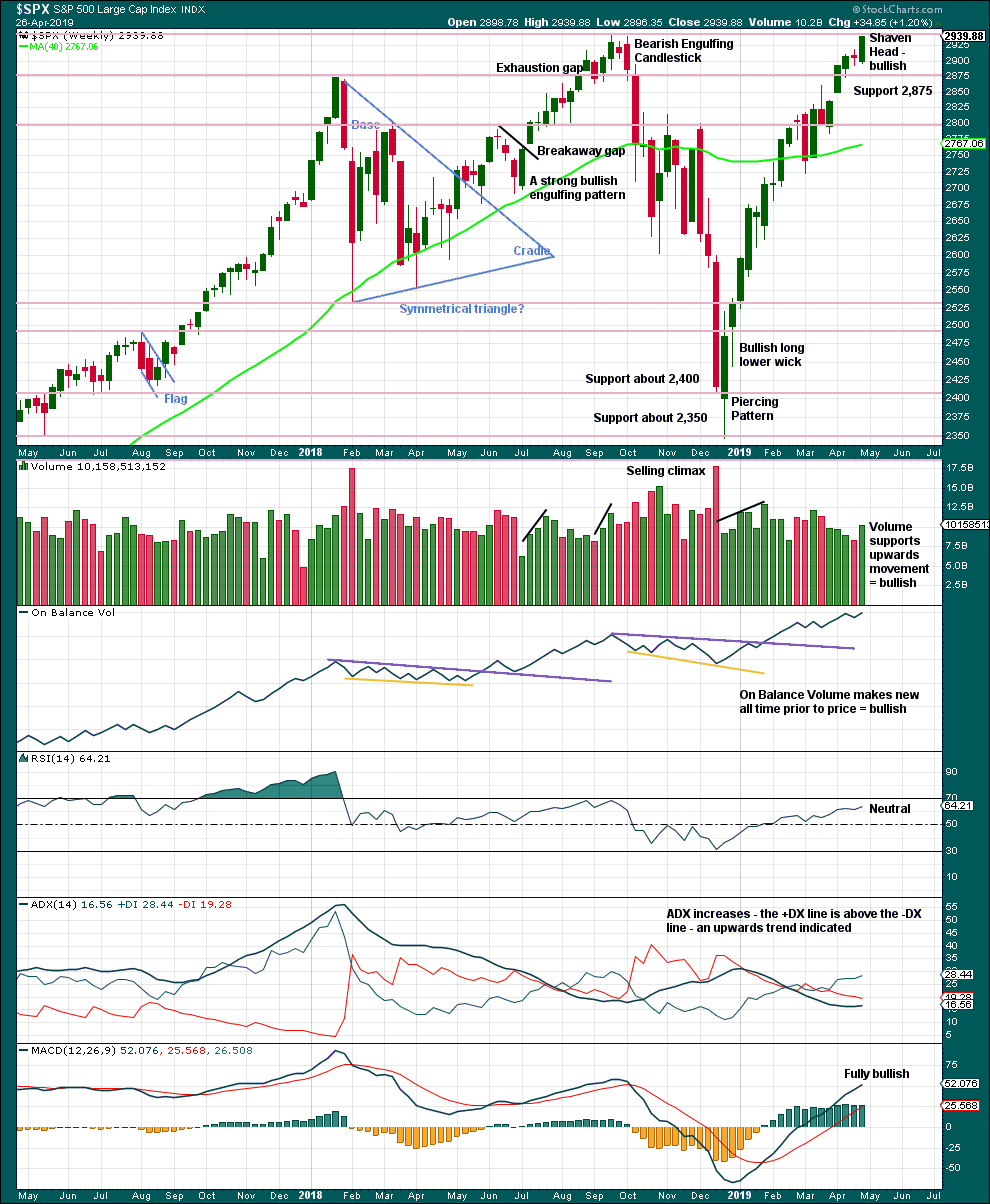
Click chart to enlarge. Chart courtesy of et=”_blank”>StockCharts.com.
Next resistance is about the prior all time high about 2,940.
This chart is fully bullish.
DAILY CHART
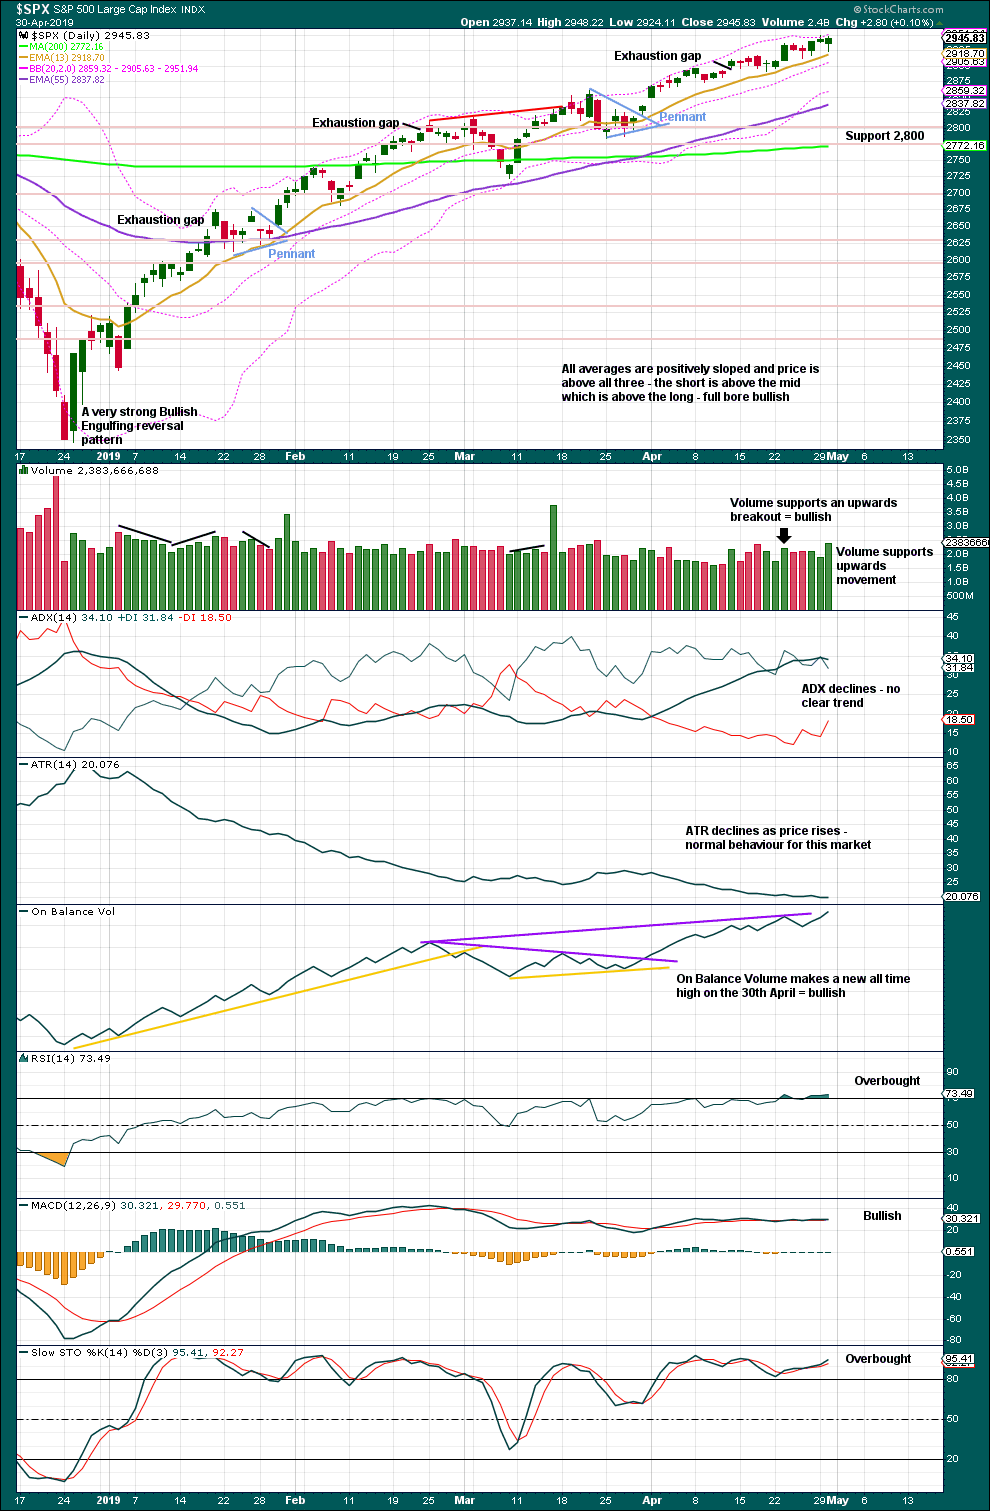
Click chart to enlarge. Chart courtesy of StockCharts.com.
The December 2018 low is expected to remain intact. The two 90% upwards days on 26th December 2018 and 6th January 2019 indicate this upwards trend has internal strength.
While the last swing low of the 25th of March remains intact, there exists a series of higher highs and higher lows from the major low in December 2018. It would be safest to assume the upwards trend remains intact.
This upwards trend is just now extreme and overbought, but this can continue for several days to a few weeks before it ends. There is now warning that a larger consolidation or deeper pullback may begin in the near term. A bearish candlestick reversal pattern will be looked for to signal a possible end (interruption) to this bull run; this is not evident yet.
Today the support from volume for upwards movement within the session (the balance of volume is upwards and the candlestick closed green) in conjunction with a longer lower wick suggest more upwards movement tomorrow.
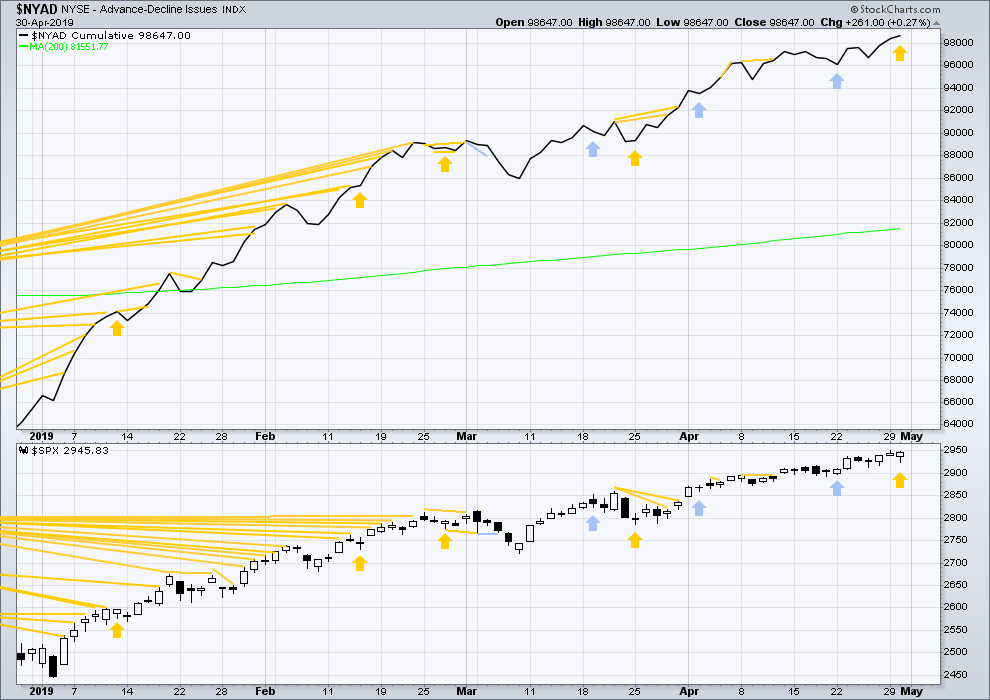
BREADTH – AD LINE
WEEKLY CHART
Click chart to enlarge. Chart courtesy of StockCharts.com. So that colour blind members are included, bearish signals
will be noted with blue and bullish signals with yellow.
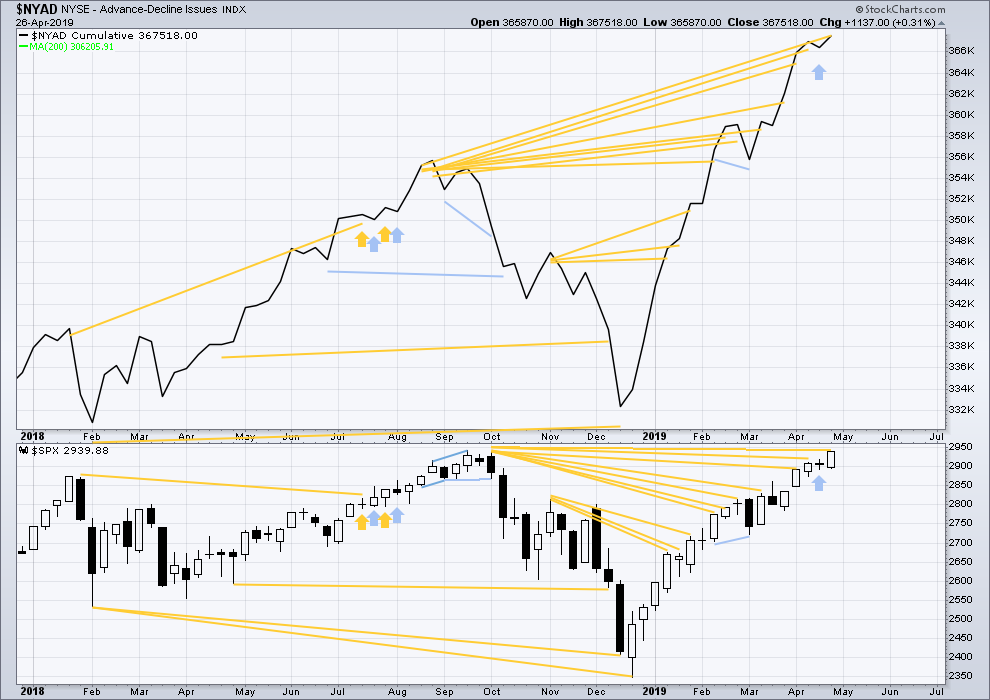
Every single bear market from the Great Depression and onwards has been preceded by a minimum of 4 months divergence between price and the AD line. With the AD line making a new all time high again in April, the end of this bull market and the start of a new bear market must be a minimum of 4 months away, which is the end of August 2019 at this time.
Last week the AD line makes another new all time high with price failing to make a corresponding new all time high by the slimmest of margins at 1.03 points.
Mid and large caps have both made new highs above the swing high of the 25th of February, but small caps have not. However, small caps AD line has made a new all time high on the 12th of April indicating broad strength underlying this market. Mid and small caps continue to lag. This rise is driven primarily by large caps, which is typical for an aged bull market.
DAILY CHART
Click chart to enlarge. Chart courtesy of StockCharts.com. So that colour blind members are included, bearish signals
will be noted with blue and bullish signals with yellow.
Breadth should be read as a leading indicator.
Today price moved slightly lower with a lower low and a lower high although the balance of volume was upwards and the candlestick has closed green, so this is not a clear downwards day. A little downwards movement from price today comes with an increase in the AD line. This divergence is bullish for the short term.
VOLATILITY – INVERTED VIX CHART
WEEKLY CHART
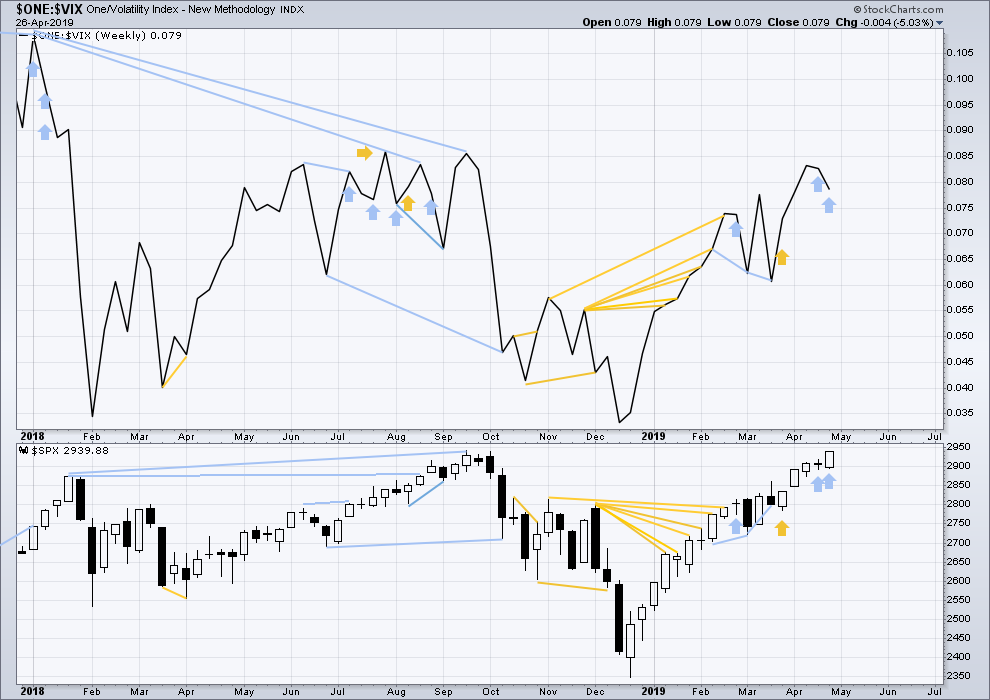
Click chart to enlarge. Chart courtesy of StockCharts.com. So that colour blind members are included, bearish signals
will be noted with blue and bullish signals with yellow.
For two weeks in a row price has moved higher and inverted VIX has moved lower. The week before last was not so clear as the weekly price candlestick was red, but last week is clear. Price has moved strongly higher, but inverted VIX has moved strongly lower. This divergence is bearish for the short to mid term and may be warning of an approaching primary (or intermediate) degree correction.
It is noted that this has occurred before at the end of the strong rise in price up to the high on the 26th of January 2018. The three weeks up to that high saw price clearly move higher and inverted VIX clearly move lower. This divergence persisted for three weeks in that instance, and so may persist for a very few weeks again now before price turns.
DAILY CHART
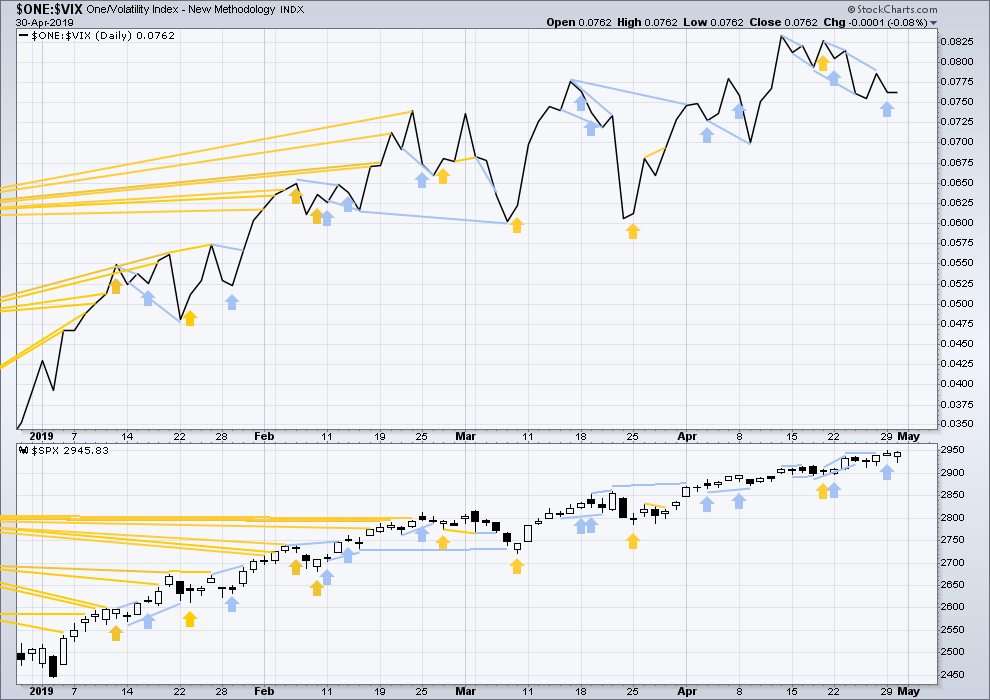
Click chart to enlarge. Chart courtesy of StockCharts.com. So that colour blind members are included, bearish signals
will be noted with blue and bullish signals with yellow.
Today price has moved slightly lower but on a day with the balance of volume upwards and a green candlestick. Inverted VIX is essentially flat. There is no new divergence.
There remains a small cluster now of bearish signals from VIX, which may be an early warning of an approaching larger consolidation or pullback.
DOW THEORY
Dow Theory confirmed a bear market in December 2018. This does not necessarily mean a bear market at Grand Super Cycle degree though; Dow Theory makes no comment on Elliott wave counts. On the 25th of August 2015 Dow Theory also confirmed a bear market. The Elliott wave count sees that as part of cycle wave II. After Dow Theory confirmation of a bear market in August 2015, price went on to make new all time highs and the bull market continued.
DJIA: 23,344.52 – a close on the 19th of December at 23,284.97 confirms a bear market.
DJT: 9,806.79 – price has closed below this point on the 13th of December.
S&P500: 2,532.69 – a close on the 19th of December at 2,506.96 provides support to a bear market conclusion.
Nasdaq: 6,630.67 – a close on the 19th of December at 6,618.86 provides support to a bear market conclusion.
With all the indices moving now higher, Dow Theory would confirm a bull market if the following highs are made:
DJIA: 26,951.81
DJT: 11,623.58
S&P500: 2,940.91 – a new all time high has been made on the 29th of April 2019.
Nasdaq: 8,133.30 – a new high has been made on 24th of April 2019.
Published @ 10:44 p.m. EST.
—
Careful risk management protects your trading account(s).
Follow my two Golden Rules:
1. Always trade with stops.
2. Risk only 1-5% of equity on any one trade.
—
New updates to this analysis are in bold.
Main hourly chart updated:
Minute v must subdivide as a zigzag. So far minuette (a) and (b) may now be over.
Hourly alternate adjusted:
With some adjustment the alternate survives. Primary 3 may again be over.
This wave count requires a new low below 2,924.11 for confidence.
Here’s a flicker of hope for Bulls. This chart shows a resistance level from the ES daily charts.
If this level fails and 2914 breaks, the Bears have alot of room on the downside.
I still like Lara’s 3010 target. I like the top end on this chart at 3006. I hate this 2 day candle formation, with the today candle just starting to form. I hate it because the today candle on the right has already made a lower low than the daily candle next to it. Its still got 23 and a half hours to finish drawing itself but it’s dancing in the lower part of its frame.
As an afterthought, the ES is drawing an 8 hour candle now. The candle runs from 12 noon today until 8 PM tonight. It’s a big red thing that runs from 2956 to 2915.50. But there is no lower low, just a low at 2915.50
Picture that on the above chart. It’s a pretty hideous slash on the chart but it is the first day of the month. So, one big red 8 hour candle and it covers any lower-low signal.
Wow, that Bearish engulfing pattern came on fast. SPX daily
Yes, if this is how it closes then it would signal a trend change.
But the problem with candlestick reversal patterns is they make no comment on two things: the direction of the next trend, or the duration of the next trend.
Which means they may signal a full 180 degree reversal and a sustained new trend, or equally as likely they may signal a brief consolidation.
Most annoying, I know.
The EW counts can give specific price points to differentiate different scenarios. That comes in handy.
looking at oil, seems we have completed a successful retest of the break down daily candle
I have a currently “in the money” June bear put spread on OIH. And now…a few OIH 17 jun puts as well.
If the current action holds up we will end up with a Dark Cloud Cover on the daily chart, one of the few “candlestick patterns” that I consider strongly significant.
That said, 4/17 was even worse, a bearish engulfing, followed rather quickly by a turn back up. So ya never know.
EXCITING action in the GBTC today Kevin. We were on the same page yesterday- you think its trying to fill the gap up to 6.90 ish area?
oh- I just
manifested that. 😉
I took small profits earlyer today towards the end of it’s run up. I think there’s another move down in the pattern on the daily chart, AND there’s a big double top sitting right there too. Measuring move of that puts price at around 5, which is also just about the invalidation for the simple way of counting the move off the 2/6 low. I’m going to watch for a bit on GBTC.
So much for dark cloud cover…
oh no it’s back…up the down, up then down to a deeper low, up…then down to yet a DEEPER low. Churning. And perhaps topping.
The big name elliott wave outfit is now calling move off the Dec lows a D WAVE. of an EXPANDING TRIANGLE that started with the February 2018 price move down.
The heart of their supporting logic is the “difficulty” of properly counting the price rise in 2018 up to new ATH’s as a proper 5 wave. As a 3 wave…you end up with overall action from Jan 2018 being a triangle or a expanding flat etc.
I don’t know if that’s crazy or brilliant. Only time will tell. And of course, market action will always be such that confirmation/invalidation will be deferred as long as possible, lol!!!
And there are others who continue to call the move up from the Dec. lows as wave B of an ABC zig-zag correction that started in Sept/Oct 2018. This means they see a C wave coming which will take us below the 2347 low of Dec 2018.
Both of Lara’s monthly counts (not the alternates) call for a move to roughly 3050 and then what is to be called a bear market to begin, one to go below 666 and another to approach 1800. Over 3000 SPX and it is time for me to cash in a substantial portion of my long profits if not all of them. We are not quite there yet so I wait with my finger on the trigger. That being said, we take it one day at a time looking for signals.
I think it would be helpful to see Primary 3 complete followed by a correction (Primary 4) to below 2900. Then it will be easier to count Primary 5 and the end of this bull market from 2009. There should be plenty of negative divergences at that time.
I have now done some research on the S&P500 back to 1980, Gold back to 1970, and the entire price history of Bitcoin.
I have found exactly 0 expanding triangles.
I expect they are extremely rare Elliott wave structures. I would not base a wave count on one, it would always be an alternate until all other possibilities were eliminated.
That price rise in 2018 has commodity like behaviour, that’s pretty clear on the chart with the increase of slope at its end. Which means more brief fourth waves than counterpart seconds. Maybe they’re not considering that which causes a problem for them.
Price on /ES has tagged the 1.27% extension of the Dec 26 low to the March 4 high. I believe in the power of 1.27% extensions. It’s a very “proper fractal” place to start a consolidation/pullback.
If this ending diagonal ends everything up to a primary 3, that means the primary 3 is very short relative to the primary 1. Not impossible…but ????.
The RUT A/D opened at better than 2-1…and has fallen now to barely more than 1-1. SPX gapped open up, but the A/D is only about 1.2-1, not really strong at all.
Extreme uncertainty is my current outlook. We haven’t seen any reaction selling of note against this new ATH level yet. Count wise, it’s due, concept wise, it’s due, history wise, it’s due.
I bought the gap fill, gonna sell at the ED target
Careful, the SPX A/D keeps degrading. 175-326 at the moment.
I bailed for a very small loss on a rather large RUT position (in UWM), reasonably close to this morning’s high. The rapid shift in the AD and the rolling over price at the 1 minute level told me all I need to know: GET OUT!!! More than happy with that call one hour in now. The move down may be close to complete…or we may be into days or weeks of sell off here, I’m waiting for the market to inform me more. Discretion is the better part of valor.
Good Morning Y’all
Here’s the ES hourly. It’s been cleaned up and just shows the key levels. Hopefully easier to read. It looks like they are retracing before the move up to the overhead brown area that has the target level of 2977 (ES). The best part about this trade is that there is nothing but air between 2961.25 and 2977.
Data release @ 10AM and FOMC @ 2PM …
Here is the last day and a half of ES hourly candles. This chart has been very solid and tradeable. It’s current as of now.
Oh, and tiny. Did I mention tiny?
First?
Welcome to the game and the forum Ronu.