A new all time high was expected this week from the S&P, which is what has happened.
Summary: The upwards trend remains intact and there is underlying strength in this market still. The next mid-term target is at 3,010.
A cluster of bearish signals from VIX sounds a warning of a possible approaching larger consolidation or pullback. Near-term caution is warranted at this time.
The final target remains the same at 3,045. Alternate monthly wave counts allow for a target as high as 4,119.
The biggest picture, Grand Super Cycle analysis, is here.
Monthly charts were last published here, with video here. There are two further alternate monthly charts here, with video here.
ELLIOTT WAVE COUNTS
The two Elliott wave counts below will be labelled First and Second rather than main and alternate as they may be about of even probability. When the current impulse of primary wave 5 (second wave count) or cycle wave V (first wave count) may be complete, then these two wave counts will diverge on the severity of the expected following bear market. To see an illustration of this future divergence monthly charts should be viewed.
FIRST WAVE COUNT
WEEKLY CHART
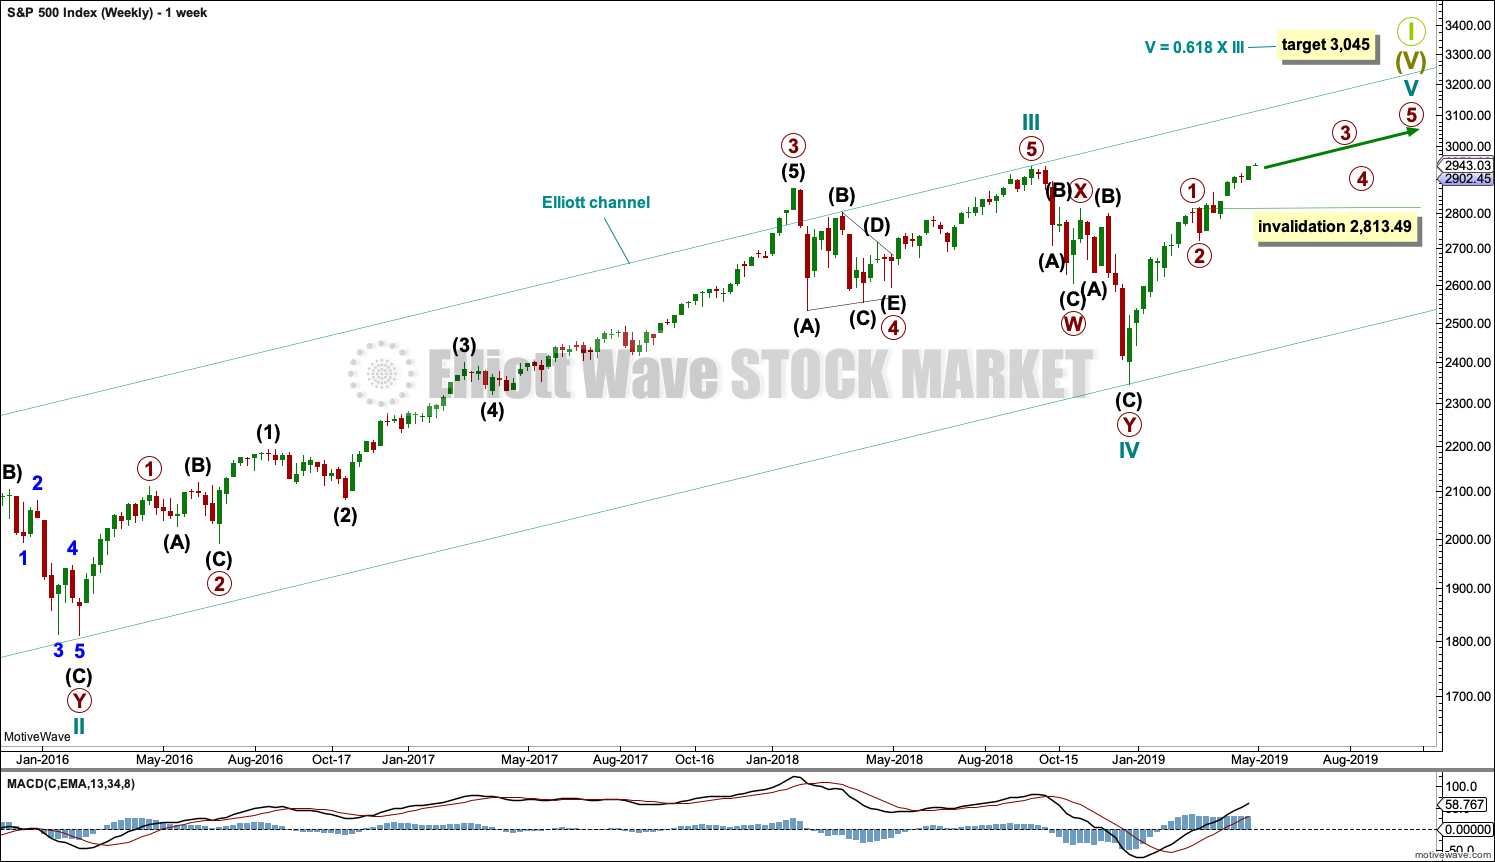
This weekly chart shows all of cycle waves III, IV and V so far.
This wave count expects that when cycle wave V completes Super Cycle wave (V) and Grand Super Cycle wave I, that a huge bear market to potentially last decades may begin. It should move substantially below 666.79.
Cycle wave II fits as a time consuming double combination: flat – X – zigzag. Combinations tend to be more time consuming corrective structures than zigzags. Cycle wave IV has completed as a multiple zigzag that should be expected to be more brief than cycle wave II.
Cycle wave IV may have ended at the lower edge of the Elliott channel.
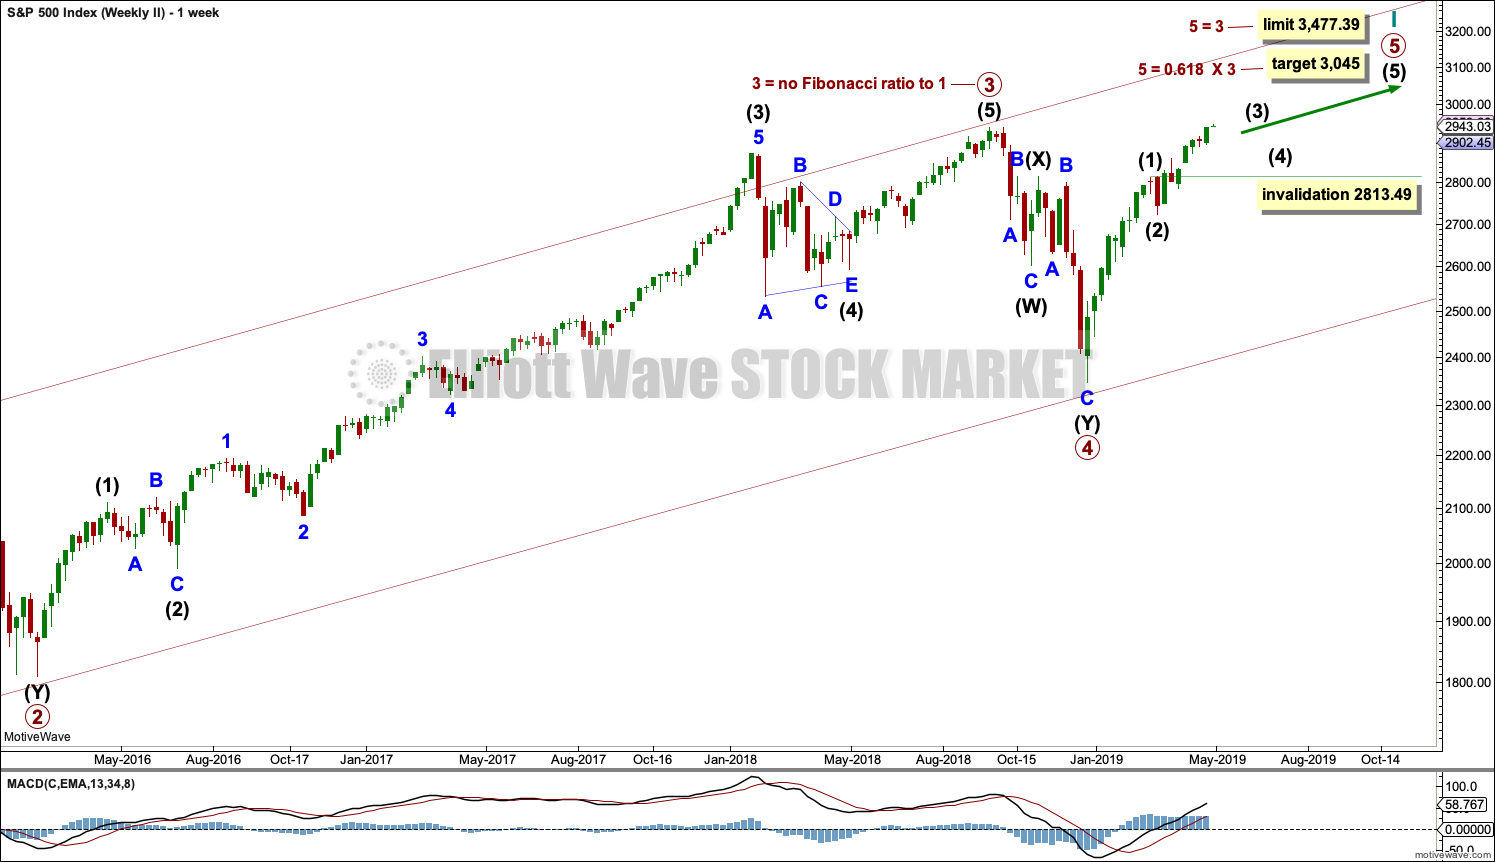
Within cycle wave V, primary waves 1 and 2 may now be complete. Primary wave 3 has moved above the end of primary wave 1. When it arrives, primary wave 4 may not move into primary wave 1 price territory below 2,813.49.
Although both cycle waves II and IV are labelled W-X-Y, they are different corrective structures. There are two broad groups of Elliott wave corrective structures: the zigzag family, which are sharp corrections, and all the rest, which are sideways corrections. Multiple zigzags belong to the zigzag family and combinations belong to the sideways family. There is perfect alternation between the possible double zigzag of cycle wave IV and the combination of cycle wave II.
Although there is gross disproportion between the duration of cycle waves II and IV, the size of cycle wave IV in terms of price makes these two corrections look like they should be labelled at the same degree. Proportion is a function of either or both of price and time.
Draw the Elliott channel about Super Cycle wave (V) with the first trend line from the end of cycle wave I (at 2,079.46 on the week beginning 30th November 2014) to the high of cycle wave III, then place a parallel copy on the low of cycle wave II. Cycle wave V may find resistance about the upper edge.
It is possible that cycle wave V may end in October 2019. If it does not end there, or if the AD line makes new all time highs during or after June 2019, then the expectation for cycle wave V to end would be pushed out to March 2020 as the next possibility. Thereafter, the next possibility may be October 2020. March and October are considered as likely months for a bull market to end as in the past they have been popular. That does not mean though that this bull market may not end during any other month.
DAILY CHART
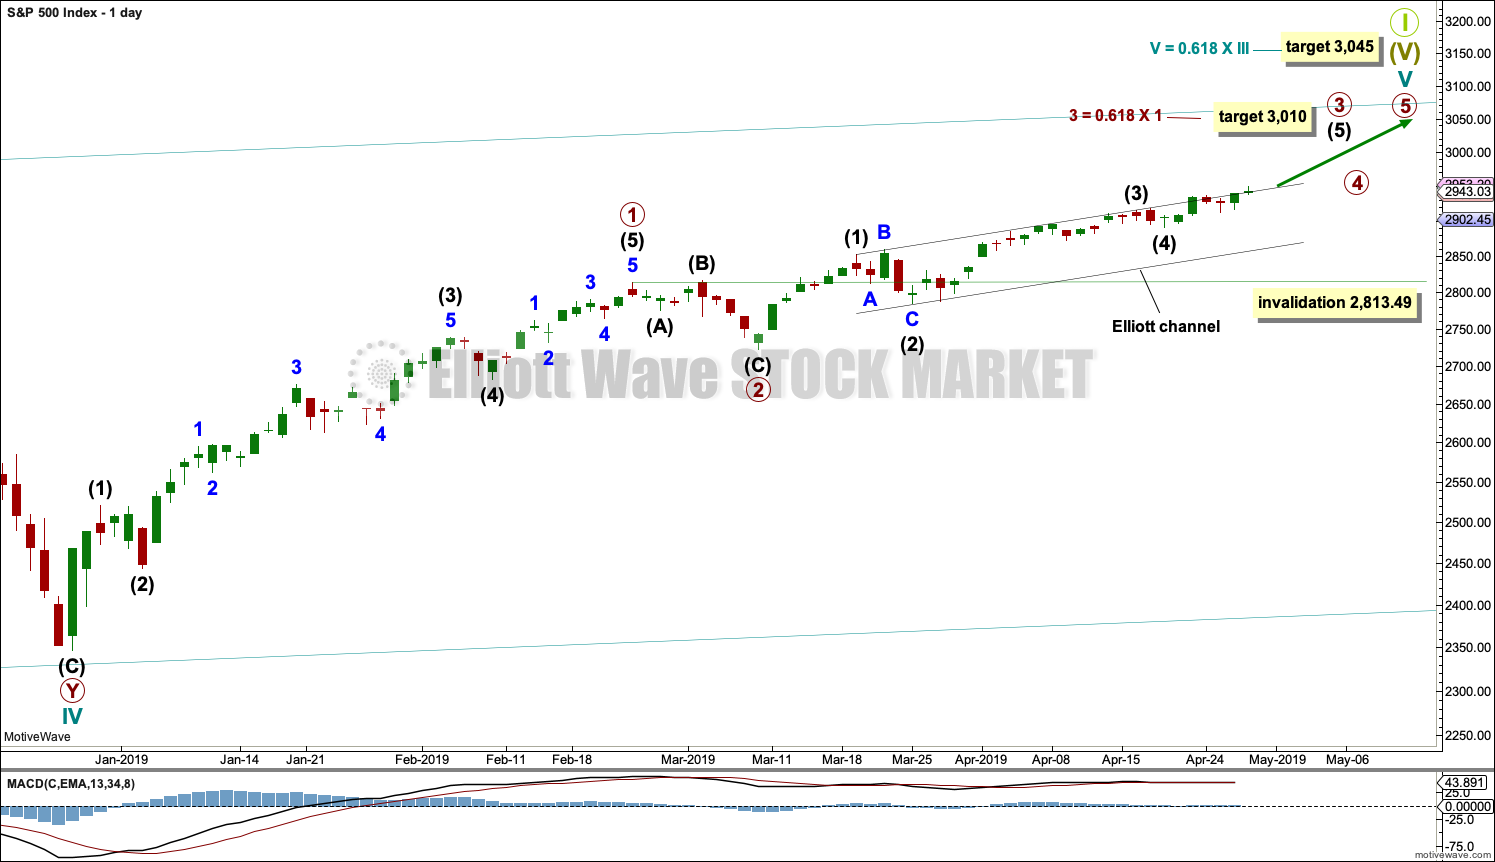
The daily chart will focus on the structure of cycle wave V.
Cycle wave V must subdivide as a five wave motive structure, either an impulse or an ending diagonal. An impulse is much more common and that will be how it is labelled. A diagonal would be considered if overlapping suggests it.
Primary wave 1 may have been a long extension, a smaller fractal of cycle wave I on the monthly chart.
Primary wave 2 may have been a very brief and shallow expanded flat correction.
Within primary wave 3, intermediate waves (1) through to (4) may be complete. Intermediate wave (5) to end primary wave 3 may end soon or may yet continue to extend. When it is complete, then primary wave 3 may be complete.
Primary wave 4 may not move into primary wave 1 price territory below 2,813.49.
HOURLY CHART
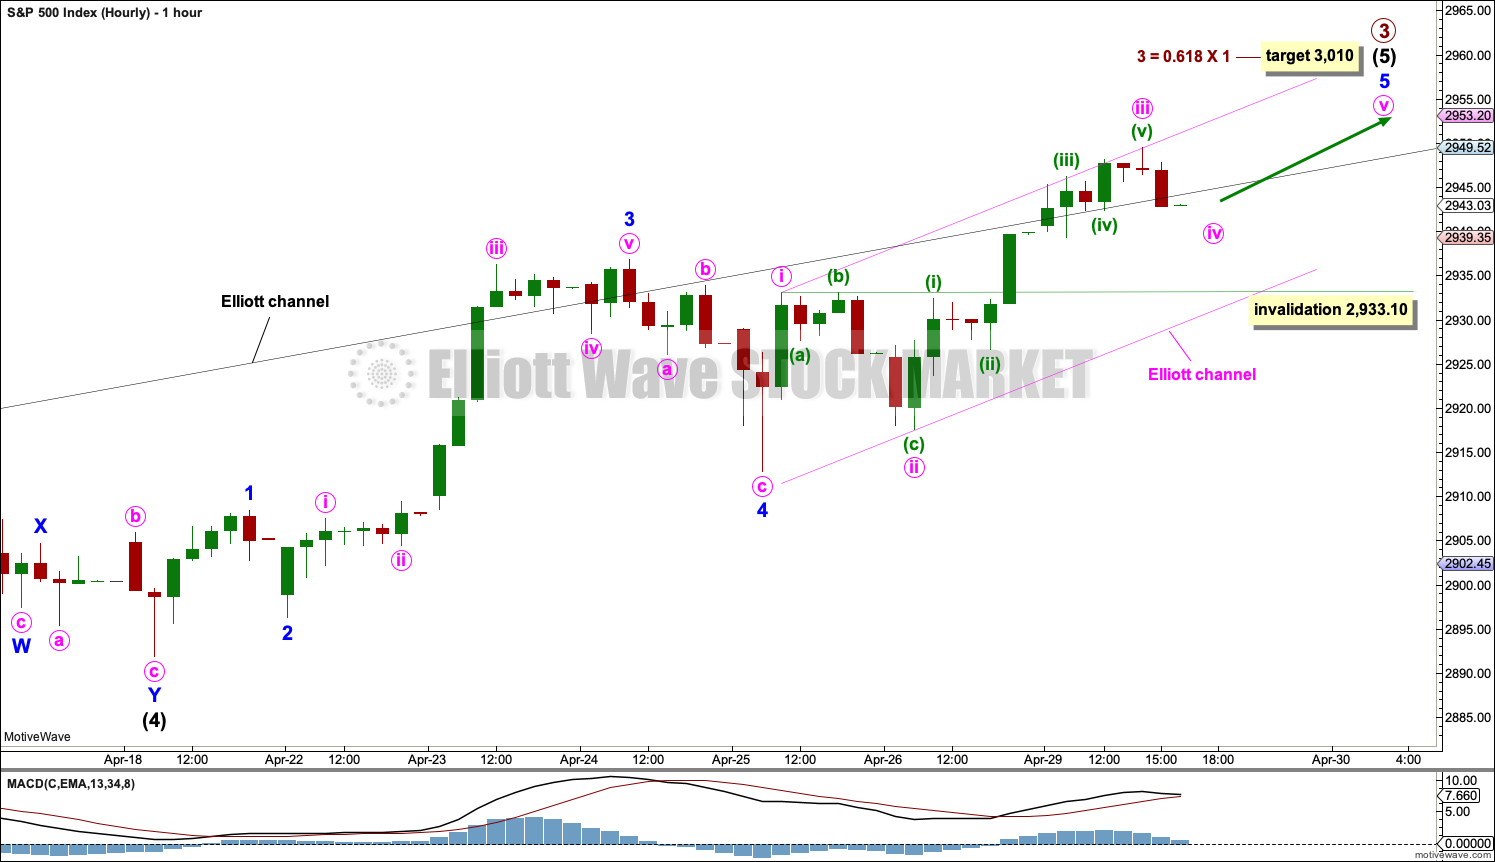
Intermediate wave (5) may be unfolding as an impulse, which is the most common structure for a fifth wave.
It is also possible to move the degree of labelling within intermediate wave (5) all down one degree. It is possible that only minor wave 1 within intermediate wave (5) is near an end.
However, the strength of upwards movement that overshot the upper edge of the black Elliott channel looks very much like a third wave, so this labelling looks most likely.
So far minor waves 1 through to 4 within intermediate wave (5) may all be complete. Minor wave 3 is just 2.7 points short of 2.618 the length of minor wave 1. With a Fibonacci ratio already between two of the three actionary waves within intermediate wave (5), minor wave 5 may not exhibit a Fibonacci ratio to either of minor waves 1 or 3. The target calculation will be left at primary degree.
Minor wave 5 may be an extension. So far minute wave ii within minor wave 5 shows up clearly on the hourly chart, suggesting a more time consuming impulse for minor wave 5.
Within minor wave 5, minute waves i, ii and iii may be complete. Minute wave iii is just 0.82 points short of 1.618 the length of minute wave i. Minute wave v may not exhibit a Fibonacci ratio to either of minute waves i or iii.
Minute wave iv may continue sideways. It may not move into minute wave i price territory below 2,933.10.
SECOND WAVE COUNT
WEEKLY CHART
This weekly chart is identical to the first weekly chart, with the sole difference being the degree of labelling.
When cycle wave I is complete, then cycle wave II should meet the technical definition of a bear market as it should retrace more than 20% of cycle wave I, but it may end about either the 0.382 or 0.618 Fibonacci Ratios of cycle wave I. Cycle wave II may end close to the low of primary wave 2 within cycle wave I, which is at 1,810.10.
Thereafter, a new bull market for cycle wave III may begin. It should have support from volume and fundamentals.
The end of Grand Super Cycle wave I may be about 10 years or so away.
TECHNICAL ANALYSIS
WEEKLY CHART
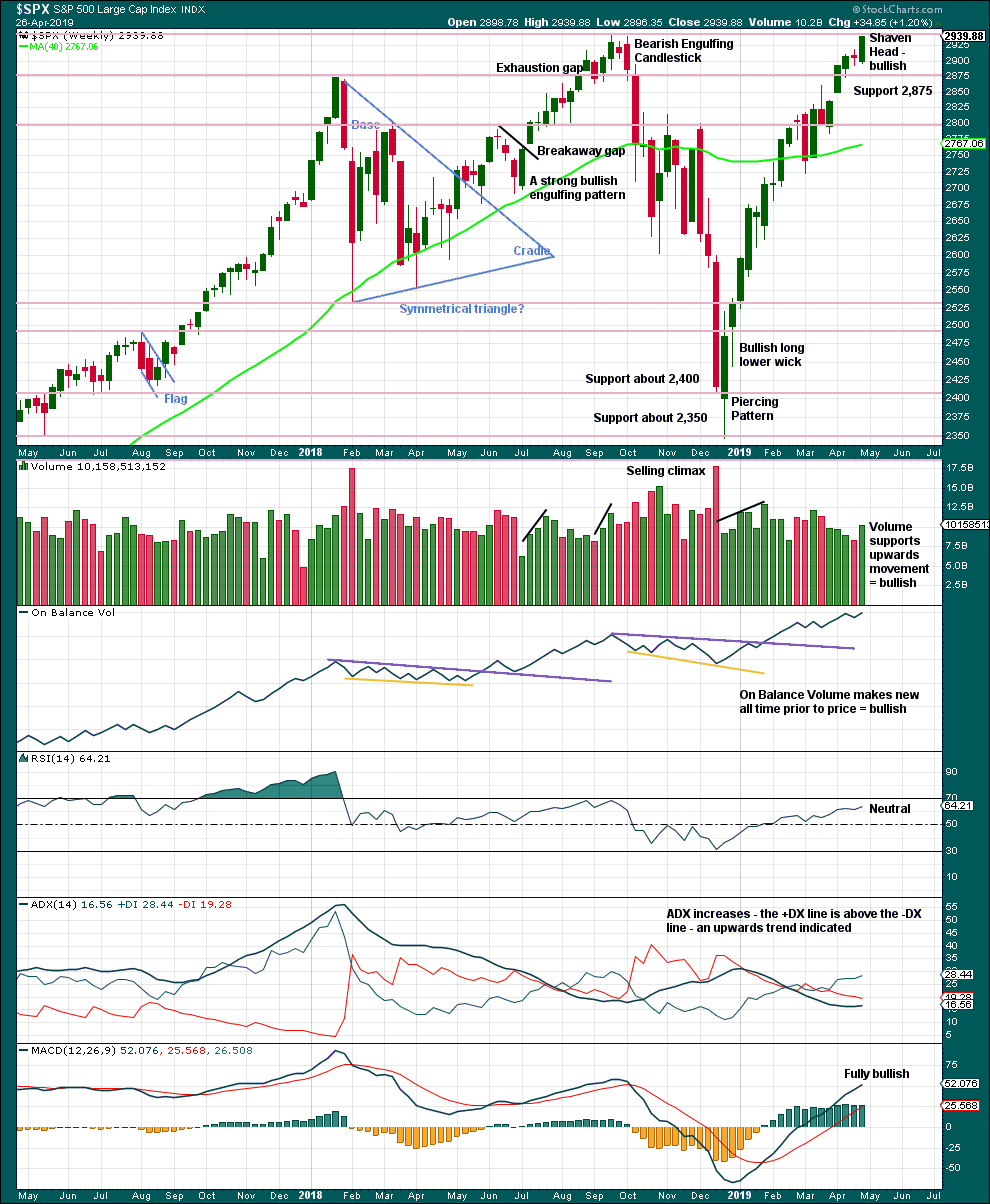
Click chart to enlarge. Chart courtesy of et=”_blank”>StockCharts.com.
Next resistance is about the prior all time high about 2,940.
This chart is fully bullish.
DAILY CHART
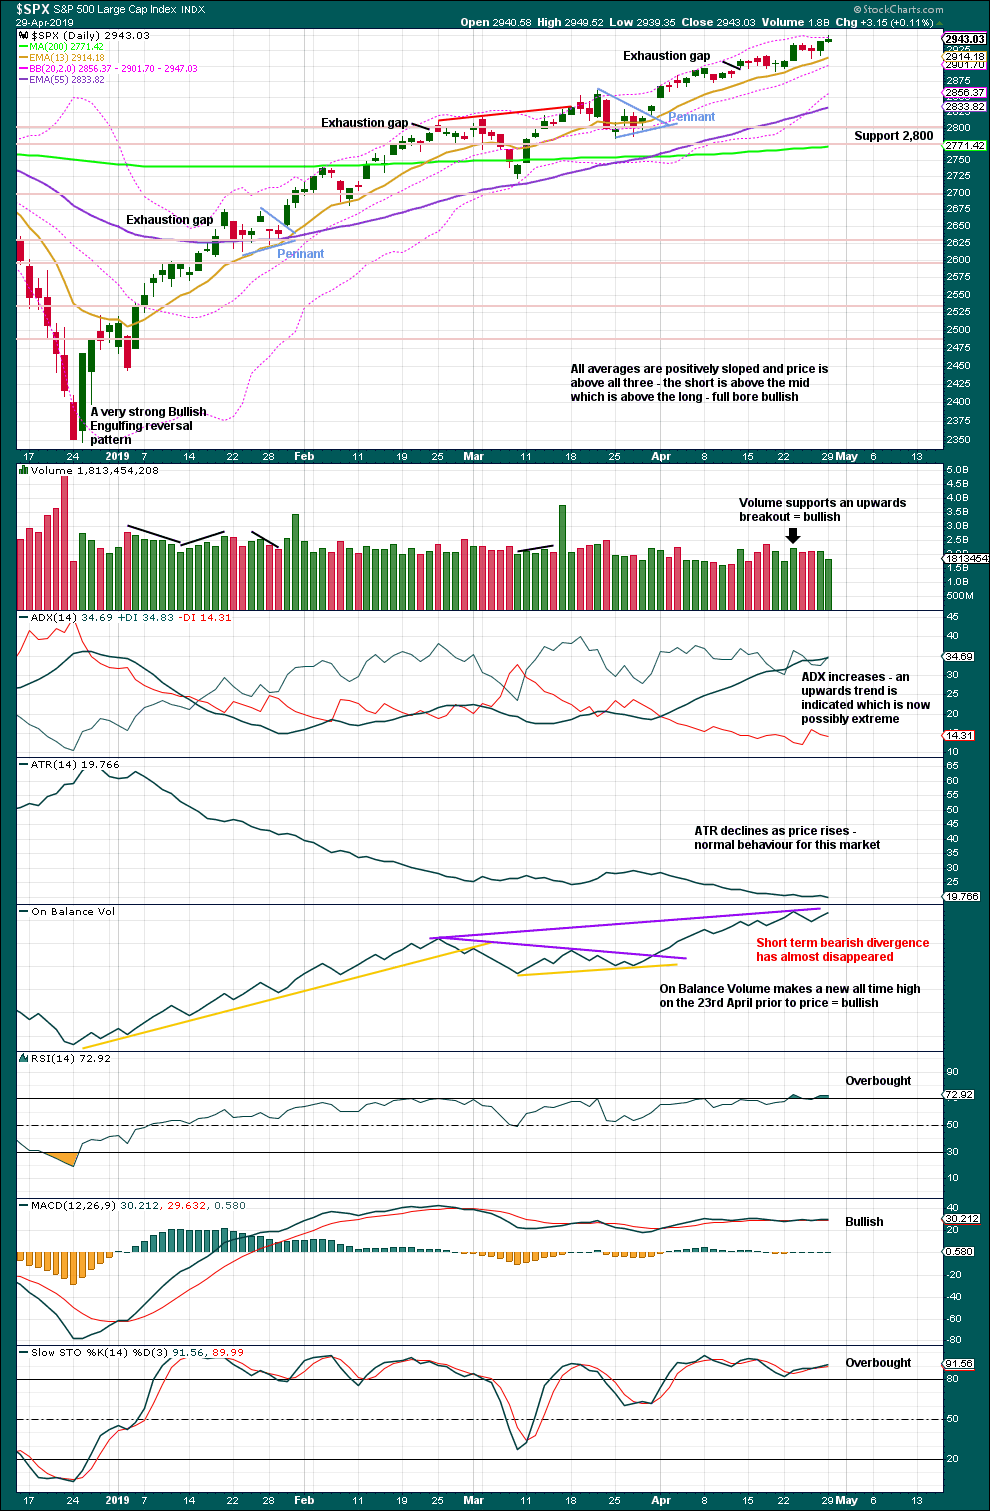
Click chart to enlarge. Chart courtesy of StockCharts.com.
The December 2018 low is expected to remain intact. The two 90% upwards days on 26th December 2018 and 6th January 2019 indicate this upwards trend has internal strength.
While the last swing low of the 25th of March remains intact, there exists a series of higher highs and higher lows from the major low in December 2018. It would be safest to assume the upwards trend remains intact. ADX agrees.
This upwards trend is just now extreme and overbought, but this can continue for several days to a few weeks before it ends. There is now warning that a larger consolidation or deeper pullback may begin in the near term. A bearish candlestick reversal pattern will be looked for to signal a possible end (interruption) to this bull run; this is not evident yet.
BREADTH – AD LINE
WEEKLY CHART
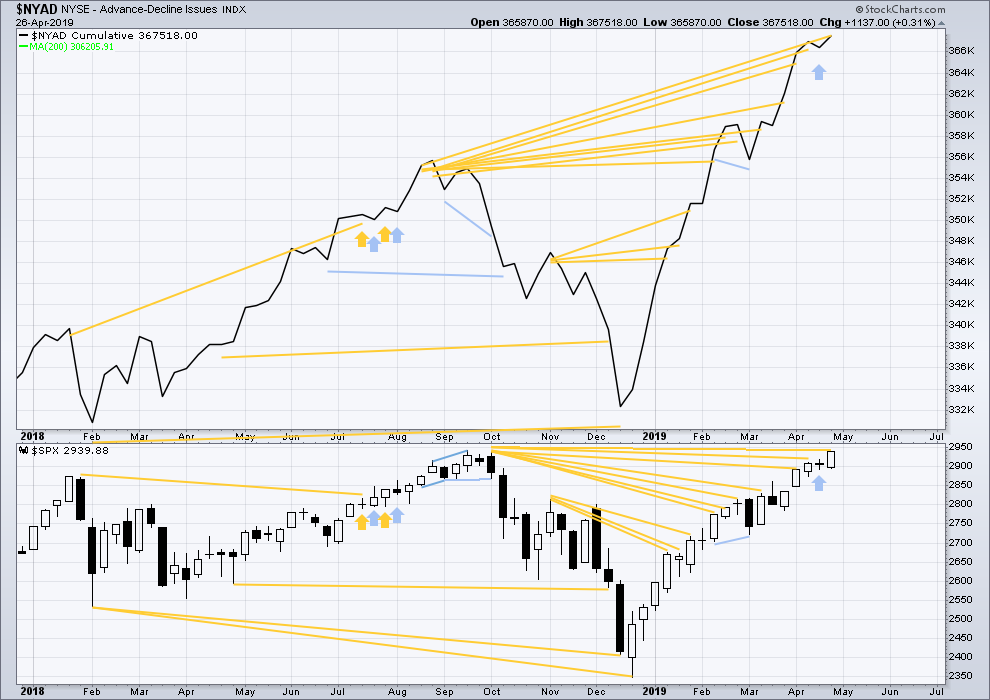
Click chart to enlarge. Chart courtesy of StockCharts.com. So that colour blind members are included, bearish signals
will be noted with blue and bullish signals with yellow.
Every single bear market from the Great Depression and onwards has been preceded by a minimum of 4 months divergence between price and the AD line. With the AD line making a new all time high again in April, the end of this bull market and the start of a new bear market must be a minimum of 4 months away, which is the end of August 2019 at this time.
Last week the AD line makes another new all time high with price failing to make a corresponding new all time high by the slimmest of margins at 1.03 points.
Mid and large caps have both made new highs above the swing high of the 25th of February, but small caps have not. However, small caps AD line has made a new all time high on the 12th of April indicating broad strength underlying this market. Mid and small caps continue to lag. This rise is driven primarily by large caps, which is typical for an aged bull market.
DAILY CHART
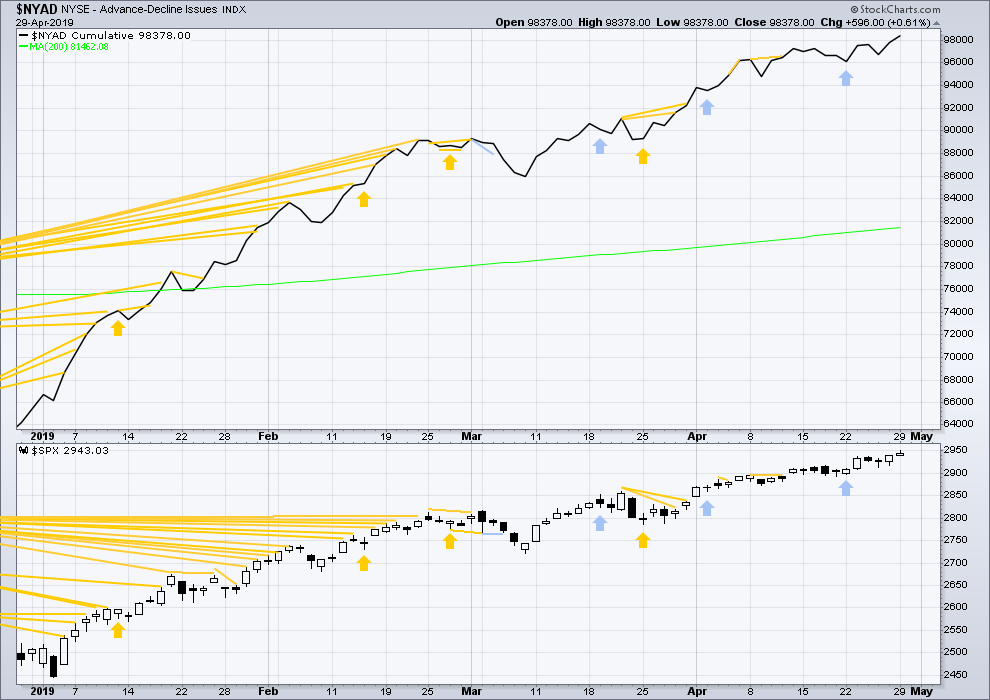
Click chart to enlarge. Chart courtesy of StockCharts.com. So that colour blind members are included, bearish signals
will be noted with blue and bullish signals with yellow.
Breadth should be read as a leading indicator.
Both price and the AD line have made new all time highs today. There is no longer any divergence. This upwards movement has very good support from rising market breadth.
VOLATILITY – INVERTED VIX CHART
WEEKLY CHART
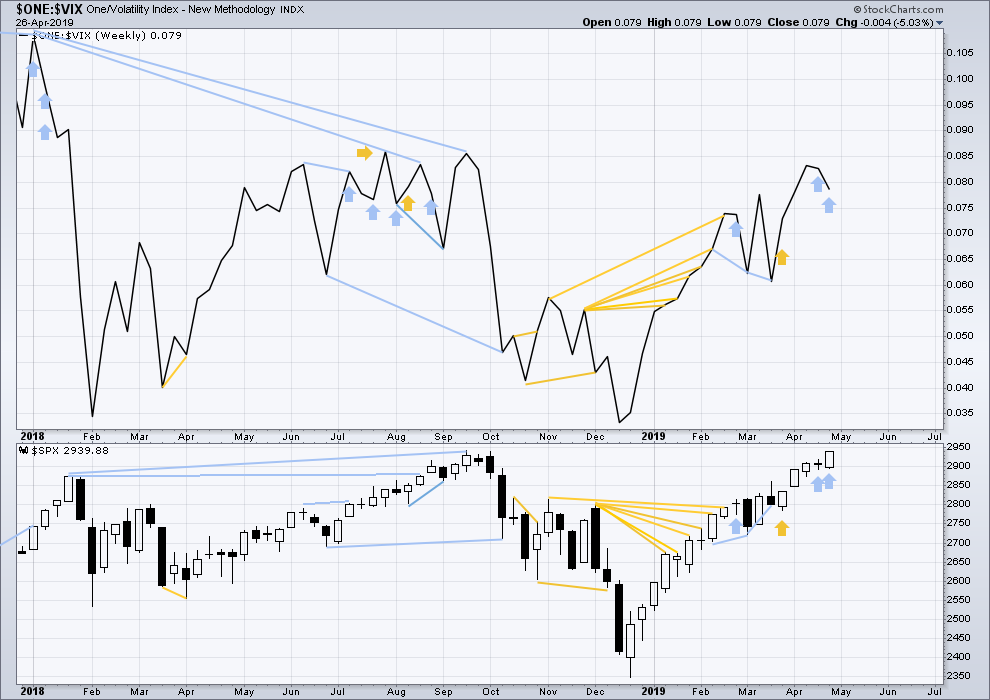
Click chart to enlarge. Chart courtesy of StockCharts.com. So that colour blind members are included, bearish signals
will be noted with blue and bullish signals with yellow.
For two weeks in a row price has moved higher and inverted VIX has moved lower. The week before last was not so clear as the weekly price candlestick was red, but last week is clear. Price has moved strongly higher, but inverted VIX has moved strongly lower. This divergence is bearish for the short to mid term and may be warning of an approaching primary (or intermediate) degree correction.
It is noted that this has occurred before at the end of the strong rise in price up to the high on the 26th of January 2018. The three weeks up to that high saw price clearly move higher and inverted VIX clearly move lower. This divergence persisted for three weeks in that instance, and so may persist for a very few weeks again now before price turns.
DAILY CHART
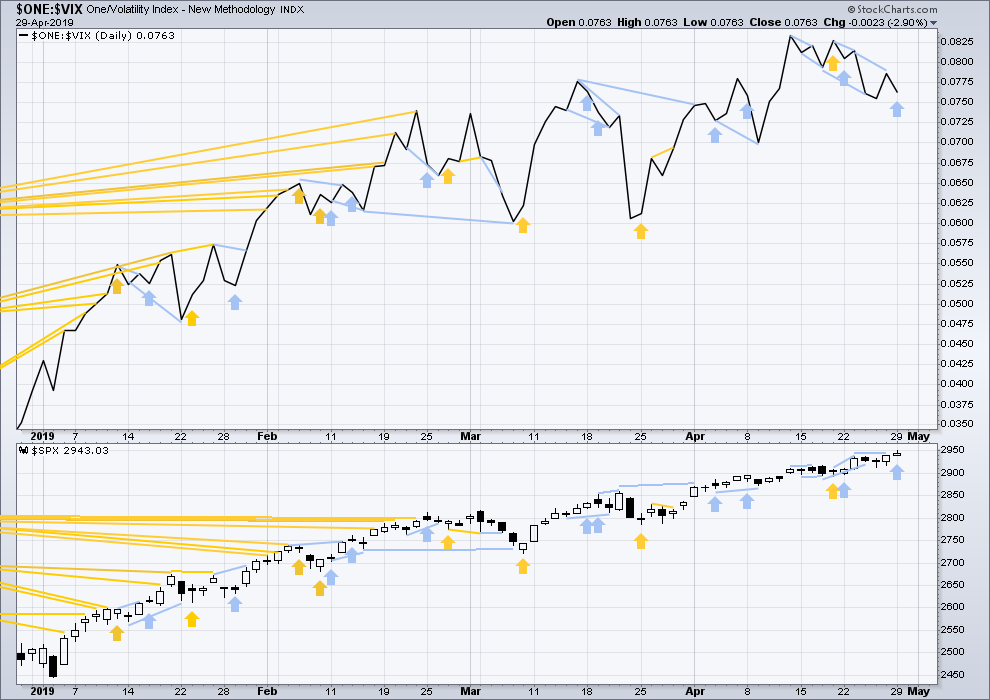
Click chart to enlarge. Chart courtesy of StockCharts.com. So that colour blind members are included, bearish signals
will be noted with blue and bullish signals with yellow.
Today price moved higher, but inverted VIX has moved lower. There is now double bearish divergence between highs and a single day bearish divergence in direction. Inverted VIX is sounding warning signs of a possible approaching larger consolidation or pullback.
DOW THEORY
Dow Theory confirmed a bear market in December 2018. This does not necessarily mean a bear market at Grand Super Cycle degree though; Dow Theory makes no comment on Elliott wave counts. On the 25th of August 2015 Dow Theory also confirmed a bear market. The Elliott wave count sees that as part of cycle wave II. After Dow Theory confirmation of a bear market in August 2015, price went on to make new all time highs and the bull market continued.
DJIA: 23,344.52 – a close on the 19th of December at 23,284.97 confirms a bear market.
DJT: 9,806.79 – price has closed below this point on the 13th of December.
S&P500: 2,532.69 – a close on the 19th of December at 2,506.96 provides support to a bear market conclusion.
Nasdaq: 6,630.67 – a close on the 19th of December at 6,618.86 provides support to a bear market conclusion.
With all the indices moving now higher, Dow Theory would confirm a bull market if the following highs are made:
DJIA: 26,951.81
DJT: 11,623.58
S&P500: 2,940.91 – a new all time high has been made on the 29th of April 2019.
Nasdaq: 8,133.30 – a new high has been made on 24th of April 2019.
Published @ 06:42 p.m. EST.
—
Careful risk management protects your trading account(s).
Follow my two Golden Rules:
1. Always trade with stops.
2. Risk only 1-5% of equity on any one trade.
—
New updates to this analysis are in bold.

Hourly chart updated:
It’s possible primary 3 could be over.
But the biggest short coming of Elliott wave is its tendency to call trend changes early. So an alternate idea is necessary.
If primary wave 4 has arrived it may last a week or so and may end within the price territory of the fourth wave of one lesser degree, in which sits the 0.236 Fibonacci ratio.
Minor 5 may be continuing as an ending expanding diagonal. For the structure to meet rules regarding wave lengths, minute v must be longer than minute iii. The original target fits this wave count.
Within minute v, no second nor B wave may move beyond its start.
Because we should always assume the trend remains the same, until proven otherwise, this may be my main hourly wave count today.
The price point which differentiates the two ideas is todays low, so far.
This is Russell 2000 futures, /RTY, 4 hour including overnight data.
I’m okay with the action since the most recent “gray bubble” here, reasonably mimicking the action after the first gray bubble. But that sequence of 3 higher lows has to continue…any break down below the first one and it’s time to “manage the trade”.
Quite a V bottom in SPX and RUT today. That said, seems like more “Backing and filling” here is quite likely. Not at all convinced yet this is the start of a major move back down, no signs of that so far.
I took just a tiny bite of GBTC (bitcoin) today. Weekly trend is strong up, daily trend is up but a pullback to the 21 ema has happened, and the hourly has spiked up and moved from down trend to neutral.
lol Rodney! I knew what you intended to type, appreciate the info.
ED?
Well, I put on a small mid-May expiry long spread on GOOGL this morning, figuring the instant sell-off gap on earnings is probably over blown and price should come up a little in the next few weeks.
SPX is flirting with the invalidation level of the hourly. Very uncertain what’s going to happen there. But if buy triggers start firing on the 5 min, I will take them. In particular I’ll be watching for price on the 5 min to cross through the 21 ema.
We are quickly approaching the short term target of 3010 SPX where evaluation of the longer term trends becomes more important. We are currently at a place where we could be forming a double or triple top in the SPX. We also have an inverse head and shoulders target of roughly 3250. How we approach and surpass the 3000 mark as well as how SPX reacts afterwards will be telling. If we are going much higher, I would expect us to claim 3000, retest and advance forward without looking back. However, both EW counts we have here call for a significant correction just after advancing past 3000. If we see that, it will lend great support for the count. If we sort of blast through 3000, it will lend support to an alternate count. (Remember the Point & Figure chart I posted a couple of weeks ago. It has a target of SPX 3800).
We are approaching a critical juncture in that the next month or two will give us the signal as to how the next year or two will play out. Keep nimble and on your toes folks. I continue to be 100% short but that can change any day. I may be taking some money off the table is we go through 3000 and slow down or start what looks to be like a deeper correction than we’ve seen the past several months.
Have a great day everyone.
What a blunder: I should have said in the second paragraph, “I continue to be 100% LONG” not short. Is that a Freudian slip indicating I should reverse from long to short? I don’t believe such things, I think (or do I?). Hope I have not confused anyone else. My confusion alone is enough!
I sure hope that blunder is only in your text and not in your actual market position Rodney, he he!!!! (Hey, I’m sure I’ve done it sometime in the past myself, lol!!!!!!!!).
I have two responses from comments / questions made yesterday. First, Ari asked how my diverticulitis was coming along? Answer: I am doing pretty well. Just a few days left of antibiotics. No more pain etc. I have further analysis (colonoscopy) coming at the end, of the month that is.
Secondly, Lara wrote regarding a monthly alternate I favor which was not shown on this weekend’s analysis, ” I’ll publish that one if you have a strong preference for it Rodney, in the next historic analysis alongside the two here.” Answer: That is kind of you to offer Lara. But it is not necessary. It doesn’t change much from week to week and unless we reach SPX 3400 it doesn’t become the main count. I favor it only because of what I think will happen economically in the US over the next 6 years. Thanks for the response.
I am glad to hear you are getting better Rodney.
Still no comment? Alright then, I’ll claim the #1 spot.
No comment.
LOL! Good one Kevin 😉
I’m a wry guy.
Isn’t that funny word, “wry”?