
A very small range upwards day remains below the prior high and overall fits the short-term picture for the Elliott wave count.
Summary: A pullback or consolidation may continue for about another two days. Look for support at the lower edge of the best fit channel and about 2,868. Thereafter, the upwards trend should resume.
The final target remains the same at 3,045.
New updates to this analysis are in bold.
The biggest picture, Grand Super Cycle analysis, is here.
Last published monthly charts are here. Video is here.
ELLIOTT WAVE COUNTS
WEEKLY CHART
Click chart to enlarge.
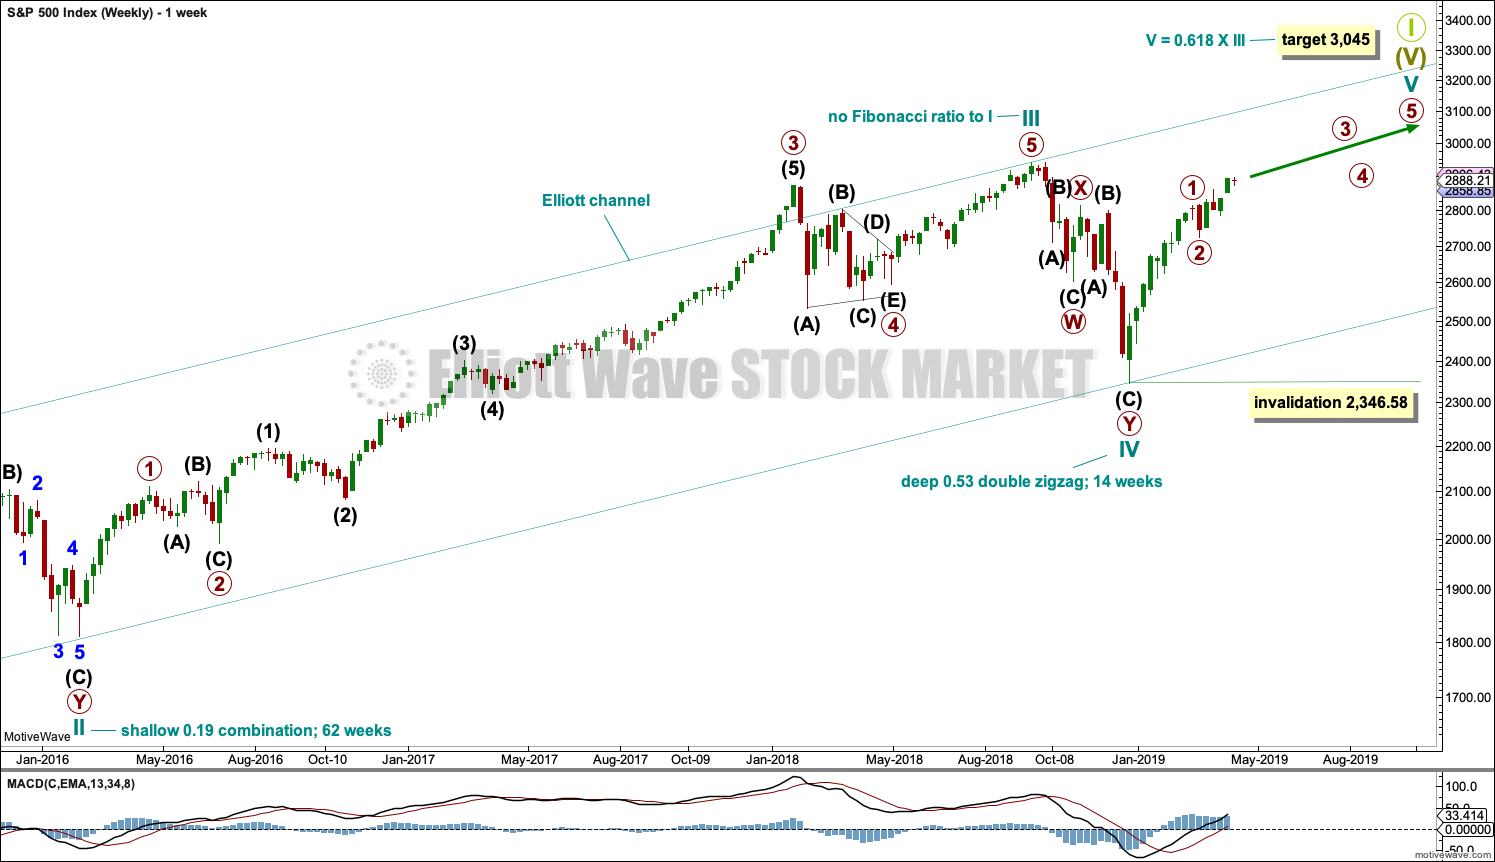
This weekly chart shows all of cycle waves III, IV and V so far.
Cycle wave II fits as a time consuming double combination: flat – X – zigzag. Combinations tend to be more time consuming corrective structures than zigzags. Cycle wave IV has completed as a multiple zigzag that should be expected to be more brief than cycle wave II.
Cycle wave IV may have ended at the lower edge of the Elliott channel.
Within cycle wave V, no second wave correction may move beyond the start of its first wave below 2,346.58.
Although both cycle waves II and IV are labelled W-X-Y, they are different corrective structures. There are two broad groups of Elliott wave corrective structures: the zigzag family, which are sharp corrections, and all the rest, which are sideways corrections. Multiple zigzags belong to the zigzag family and combinations belong to the sideways family. There is perfect alternation between the possible double zigzag of cycle wave IV and the combination of cycle wave II.
Although there is gross disproportion between the duration of cycle waves II and IV, the size of cycle wave IV in terms of price makes these two corrections look like they should be labelled at the same degree. Proportion is a function of either or both of price and time.
Draw the Elliott channel about Super Cycle wave (V) with the first trend line from the end of cycle wave I (at 2,079.46 on the week beginning 30th November 2014) to the high of cycle wave III, then place a parallel copy on the low of cycle wave II. Cycle wave V may find resistance about the upper edge.
It is possible that cycle wave V may end in October 2019. If it does not end there, or if the AD line makes new all time highs during or after June 2019, then the expectation for cycle wave V to end would be pushed out to March 2020 as the next possibility. Thereafter, the next possibility may be October 2020. March and October are considered as likely months for a bull market to end as in the past they have been popular. That does not mean though that this bull market may not end during any other month.
MAIN WAVE COUNT
DAILY CHART
Click chart to enlarge.
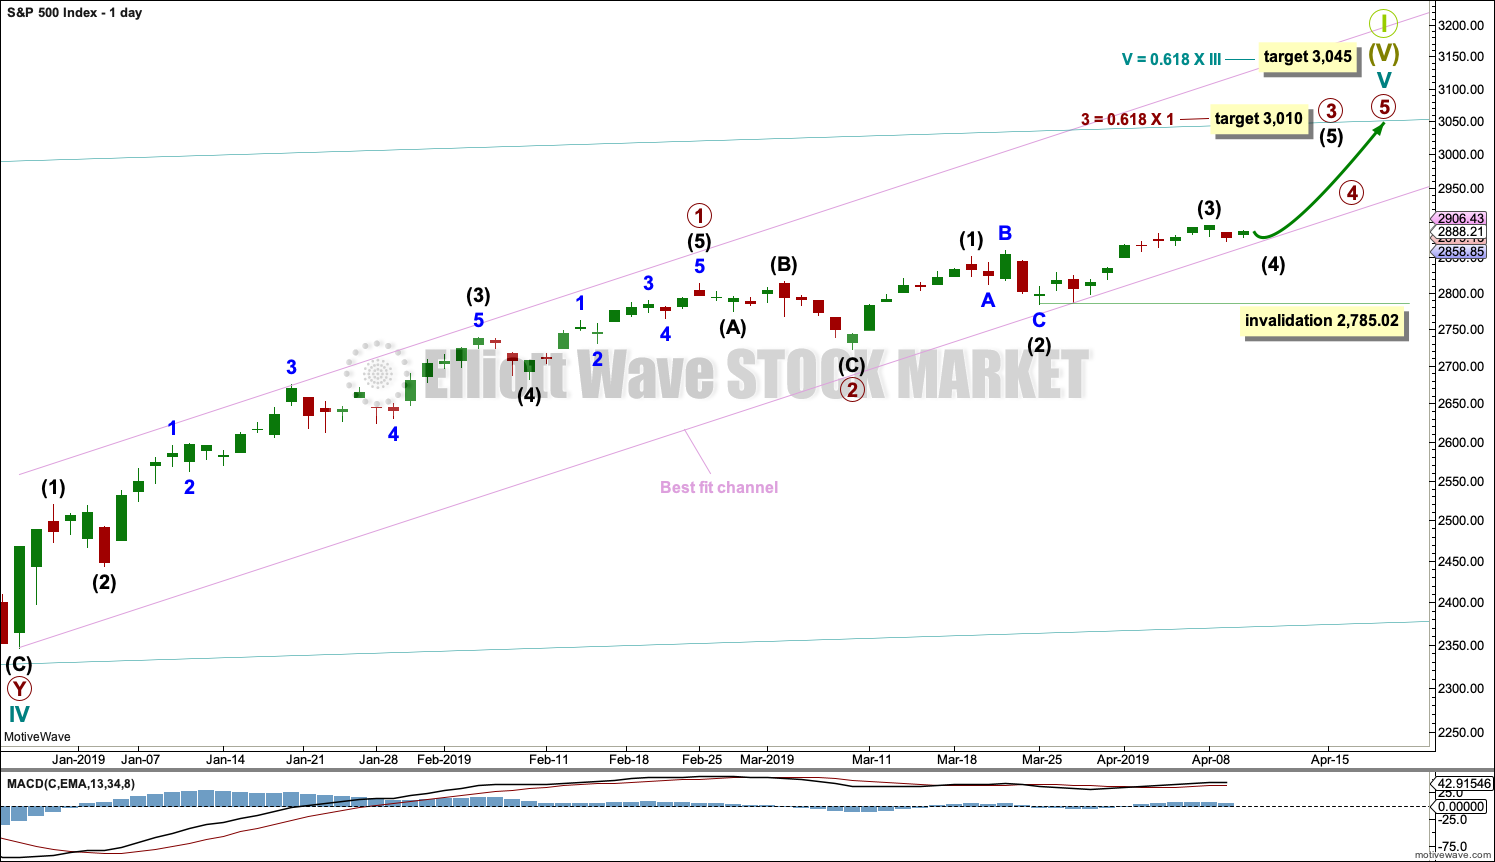
The daily chart will focus on the structure of cycle wave V.
Within Super Cycle wave (V), cycle wave III may not be the shortest actionary wave. Because cycle wave III is shorter than cycle wave I, this limits cycle wave V to no longer than equality in length with cycle wave III at 3,477.39. A target is calculated for cycle wave V to end prior to this point.
However, members are reminded that there is an alternate monthly wave count that does not have a limit to upwards movement. There is a link to it at the start of each analysis.
Cycle wave V must subdivide as a five wave motive structure, either an impulse or an ending diagonal. An impulse is much more common and that will be how it is labelled. A diagonal would be considered if overlapping suggests it.
Primary wave 2 may have been a very brief and shallow expanded flat correction.
Within primary wave 3, intermediate waves (1) through to (3) may now be complete.
If intermediate wave (3) is complete, then it would be shorter than intermediate wave (1). This limits intermediate wave (5) to no longer than equality in length with intermediate wave (3) at 110.93 points, so that the core Elliott wave rule stating a third wave may not be the shortest is met. The target at 3,010 would be too high.
The target for primary wave 3 and the invalidation point are left as is to allow for the possibility that intermediate wave (3) may be incomplete and may extend higher. If the degree of labelling within intermediate wave (3) is moved down one degree to see only minor wave 1 over at the last high, then minor wave 2 may not move beyond the start of minor wave 1 below 2,785.02.
The channel shows where small pullbacks are finding support. It may continue to do so, but the S&P does not always fit well within channels. It is possible that the channel may be breached and price may continue higher to find resistance at the lower edge of the channel.
HOURLY CHART
Click chart to enlarge.
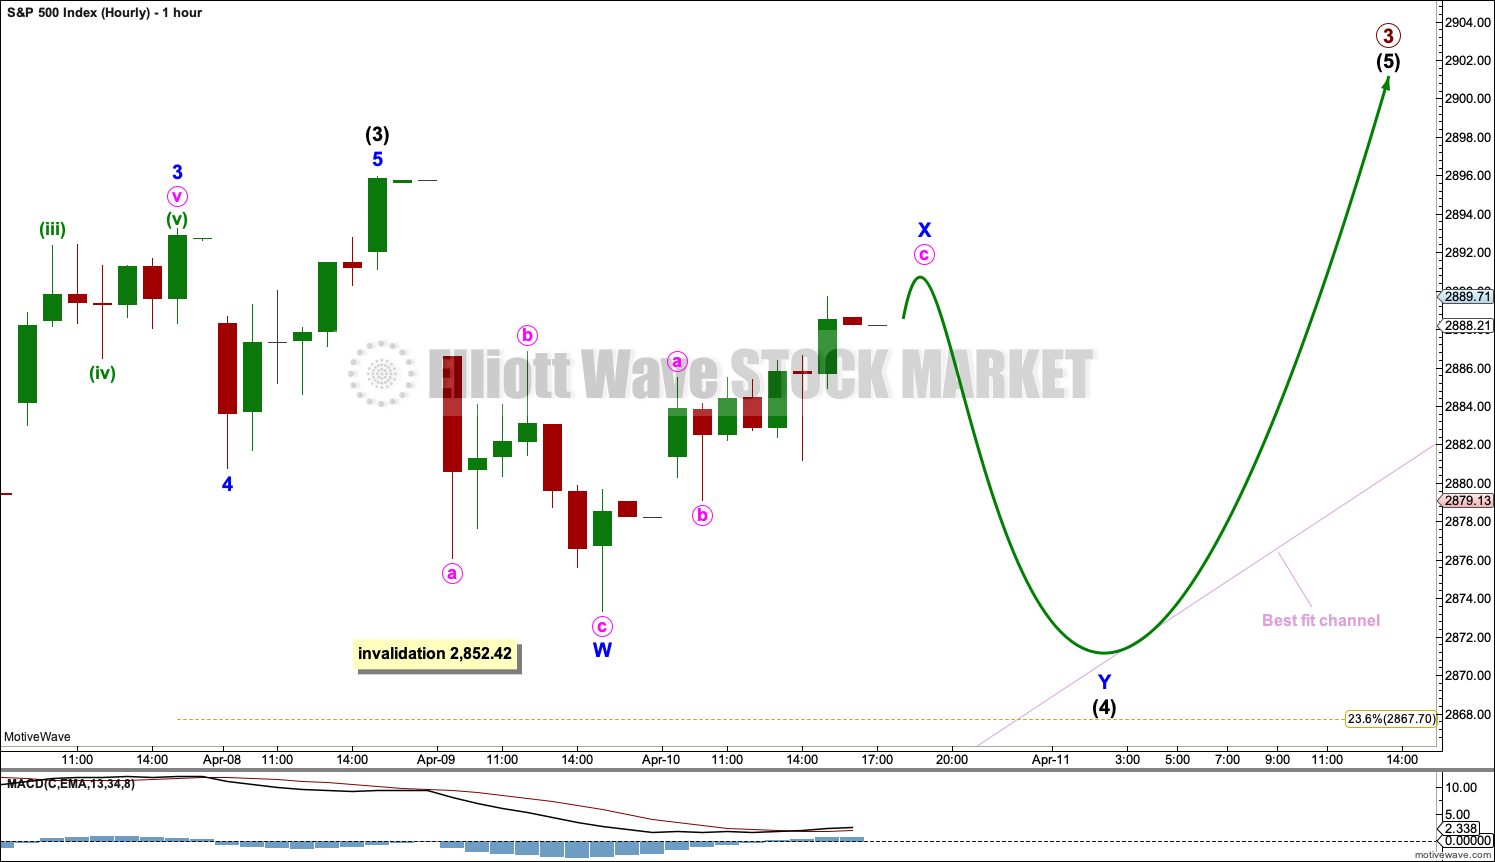
Intermediate wave (3) has now moved above the end of intermediate wave (1) meeting a core Elliott wave rule.
So far this labelling agrees with MACD. Minor wave 3 exhibits an increase in momentum beyond that of minor wave 1. Minor wave 5 exhibits a decline in momentum.
Intermediate wave (3) exhibits no Fibonacci ratio to intermediate wave (1) and is 19.22 points shorter than intermediate wave (1) if it is over at the last high.
Intermediate wave (2) subdivided as an expanded flat lasting four sessions. Given the guideline of alternation intermediate wave (4) may be expected to be a shallow sideways correction such as a triangle or combination. It may also be a relatively brief single or multiple zigzag.
Intermediate wave (4) may last about four sessions and so far has lasted only two. It may be longer if it is a more time consuming triangle or combination.
At this stage, focus will be not on identifying which structure intermediate wave (4) may be unfolding as but on identifying when it may be complete.
Today intermediate wave (4) is labelled as a possible double zigzag that would be incomplete. This labelling may change as intermediate wave (4) continues to unfold.
Intermediate wave (4) may not move into intermediate wave (1) price territory below 2,852.42.
If this wave count is invalidated with a new low by any amount at any time frame below 2,852.42, then the degree of labelling within intermediate wave (3) would be moved down one degree to see only minor wave 1 complete at the last high. Minor wave 2 may not move beyond the start of minor wave 1 below 2,785.02.
TECHNICAL ANALYSIS
WEEKLY CHART
Click chart to enlarge. Chart courtesy of et=”_blank”>StockCharts.com.
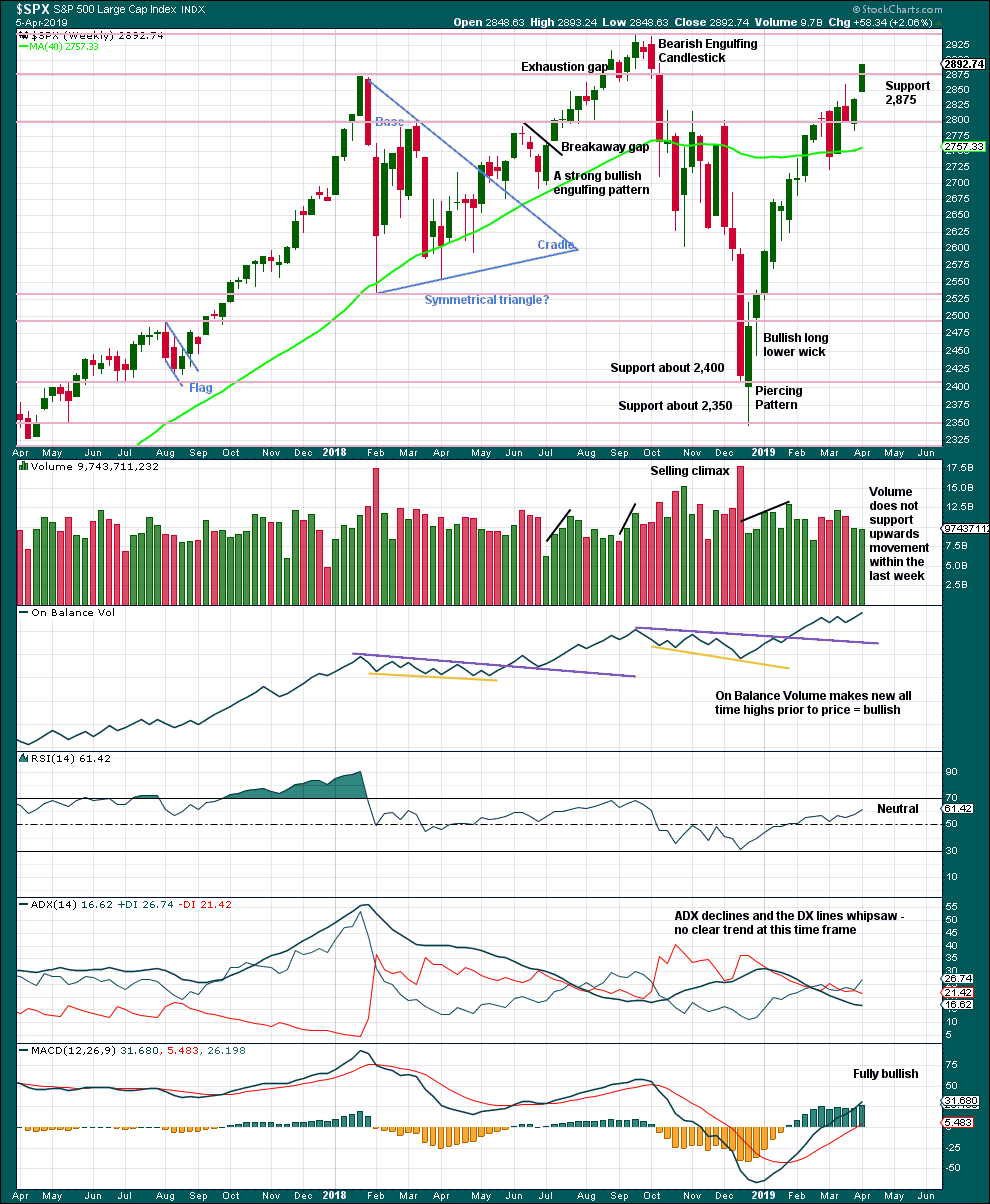
A strong upwards week, with price closing near the high for the week, and On Balance Volume making a new all time high suggest more upwards movement this week.
DAILY CHART
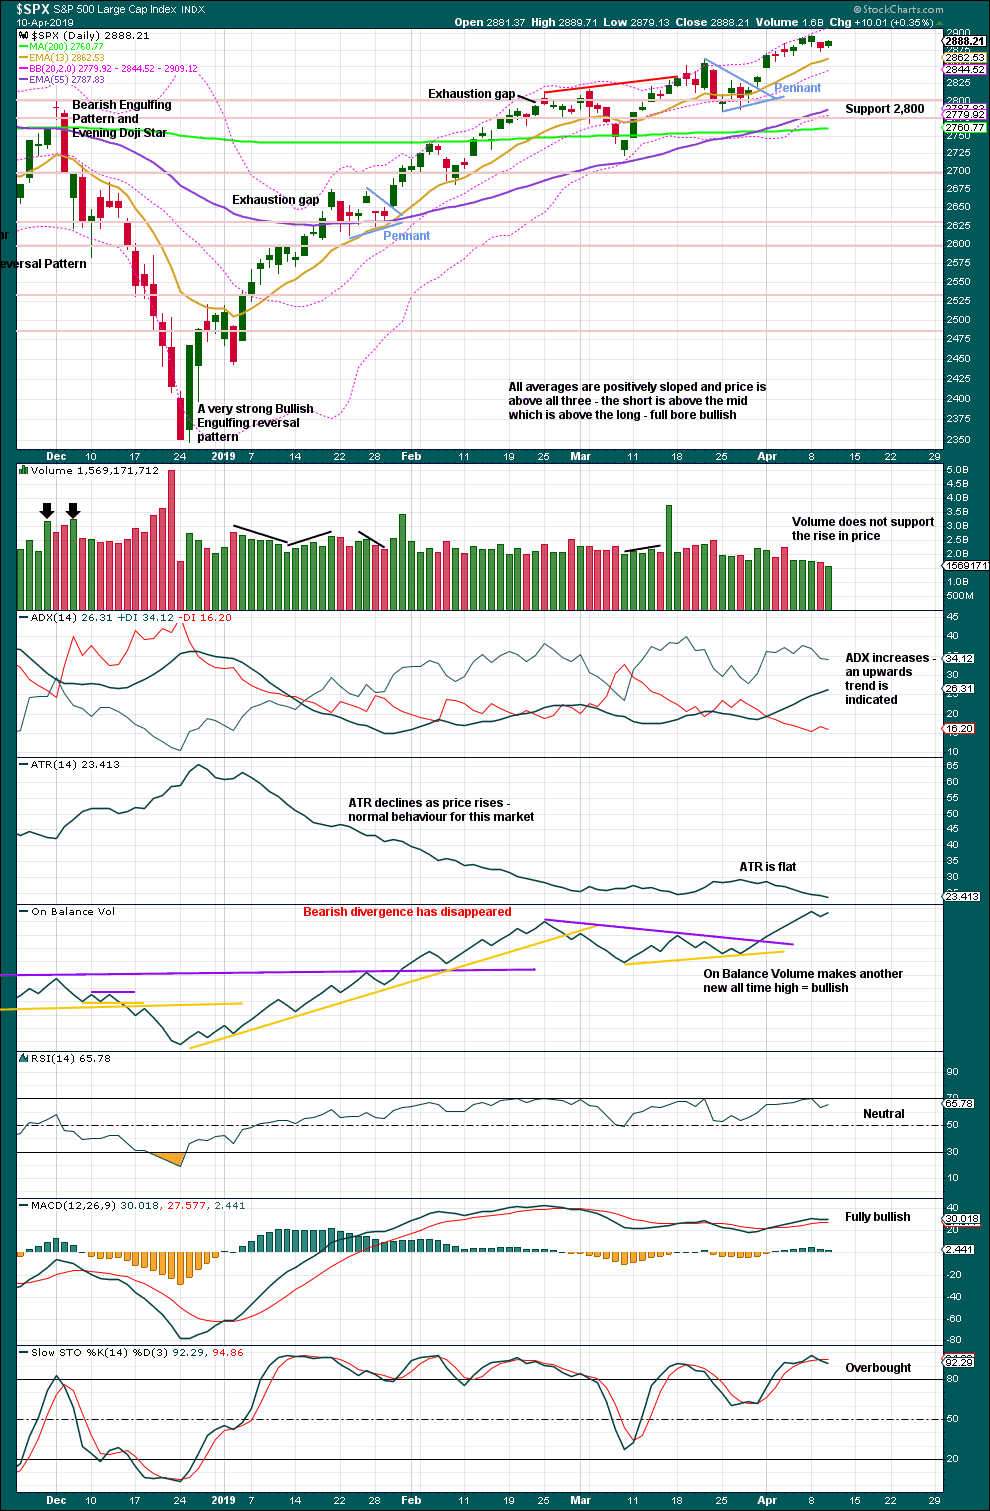
Click chart to enlarge. Chart courtesy of StockCharts.com.
The December 2018 low is expected to remain intact. The two 90% upwards days on 26th December 2018 and 6th January 2019 indicate this upwards trend has internal strength.
Lowry’s data shows Selling Pressure has reached another new low for this bull market, and Buying Power has reached a new high for this rally. This indicates an expansion in demand and a contraction in supply, which has historically been associated with strong phases of bull markets. This strongly supports the Elliott wave count, which expects new all time highs to come this year.
While the last swing low of the 25th of March remains intact, there exists a series of higher highs and higher lows from the major low in December 2018. It would be safest to assume the upwards trend remains intact.
The pennant pattern is a reliable short-term continuation pattern. A target calculated using the flag pole is about 2,956.
For the very short term, upwards movement today is weak and up volume was light. This supports the Elliott wave count, which sees this session as part of a B or X wave.
BREADTH – AD LINE
WEEKLY CHART
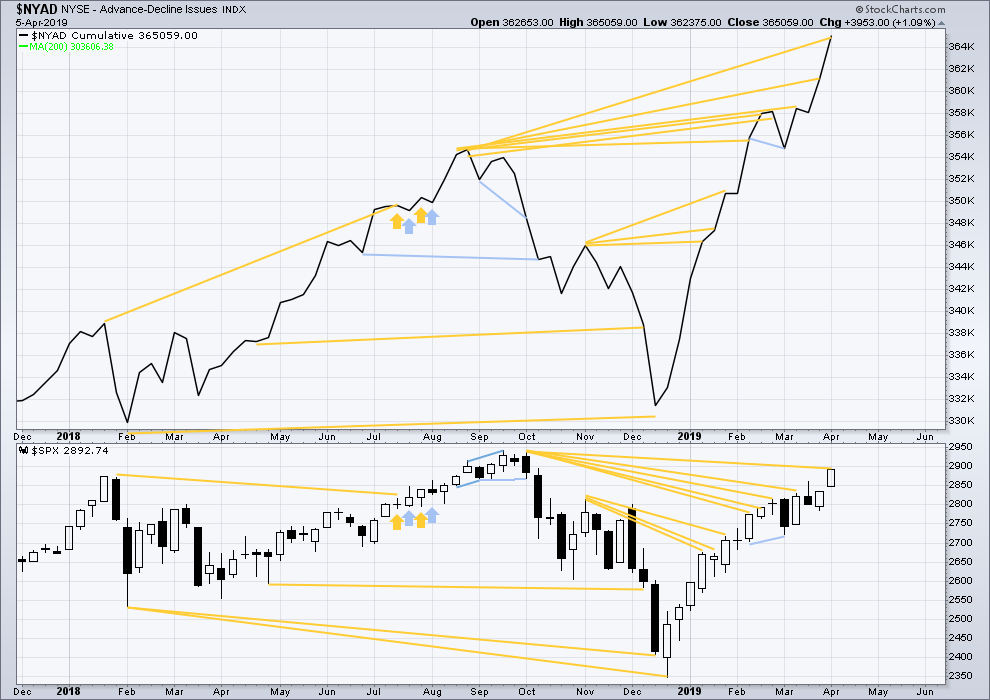
Click chart to enlarge. Chart courtesy of StockCharts.com. So that colour blind members are included, bearish signals
will be noted with blue and bullish signals with yellow.
Every single bear market from the Great Depression and onwards has been preceded by a minimum of 4 months divergence between price and the AD line. With the AD line making a new all time high again last week, the end of this bull market and the start of a new bear market must be a minimum of 4 months away, which is the end of July 2019 at this time.
Last week the AD line makes another new all time high. Bullish mid-term divergence continues.
DAILY CHART
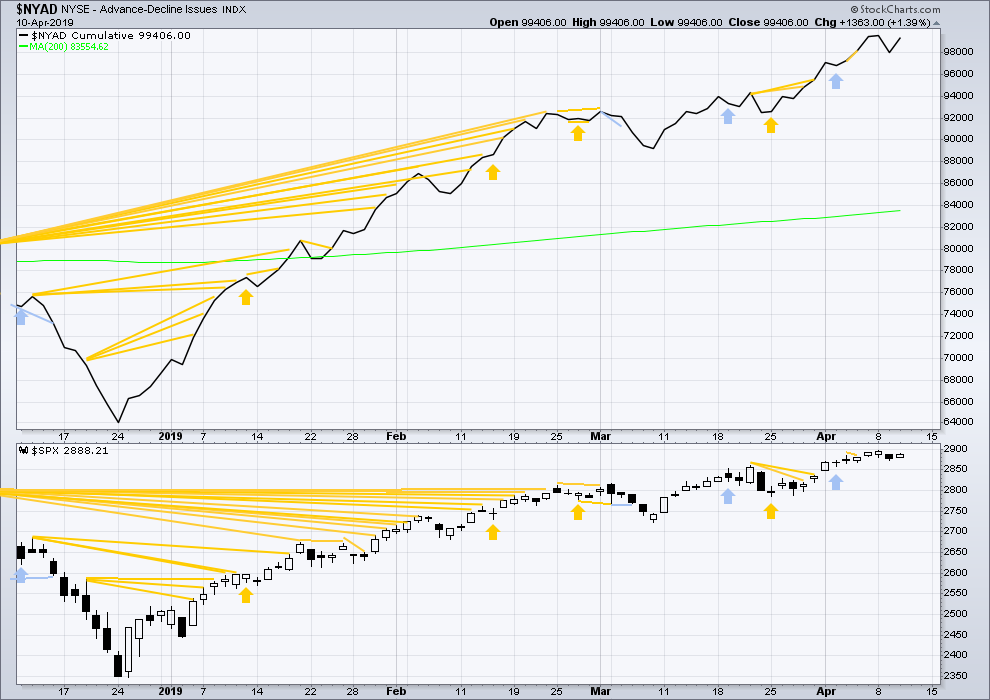
Click chart to enlarge. Chart courtesy of StockCharts.com. So that colour blind members are included, bearish signals
will be noted with blue and bullish signals with yellow.
Breadth should be read as a leading indicator.
At the daily chart level, both the AD line and price make new short-term highs. There is no short-term divergence.
Upwards movement today has support from rising market breadth. Neither price nor the AD line have made new highs today. There is no short-term divergence.
VOLATILITY – INVERTED VIX CHART
WEEKLY CHART
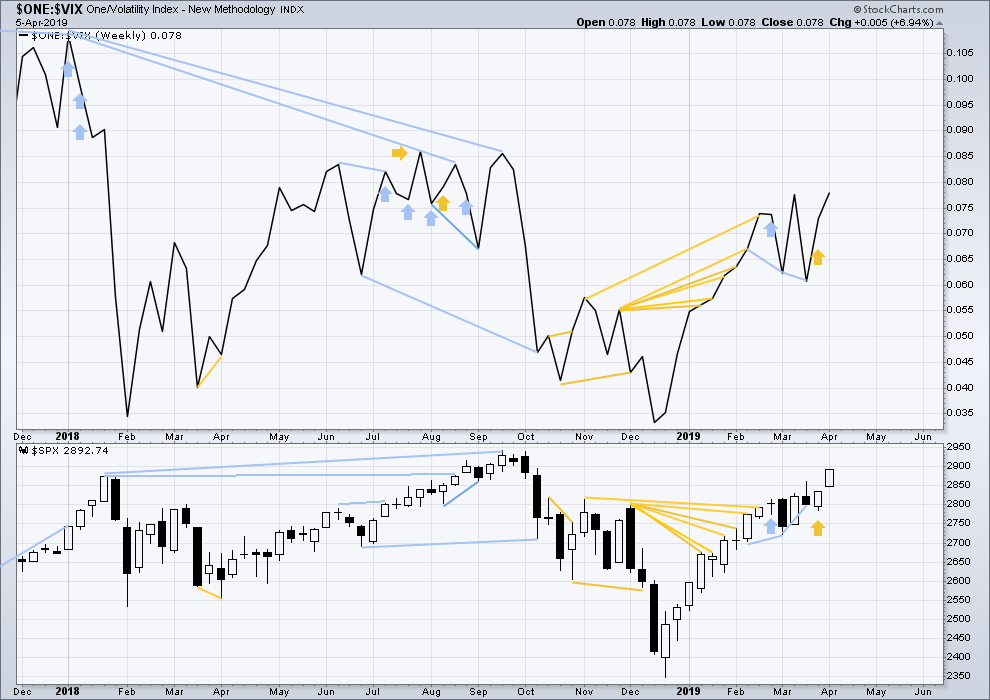
Click chart to enlarge. Chart courtesy of StockCharts.com. So that colour blind members are included, bearish signals
will be noted with blue and bullish signals with yellow.
Last week both price and inverted VIX have moved higher. There is no mid or short-term divergence. Long-term divergence between all time highs remains.
DAILY CHART
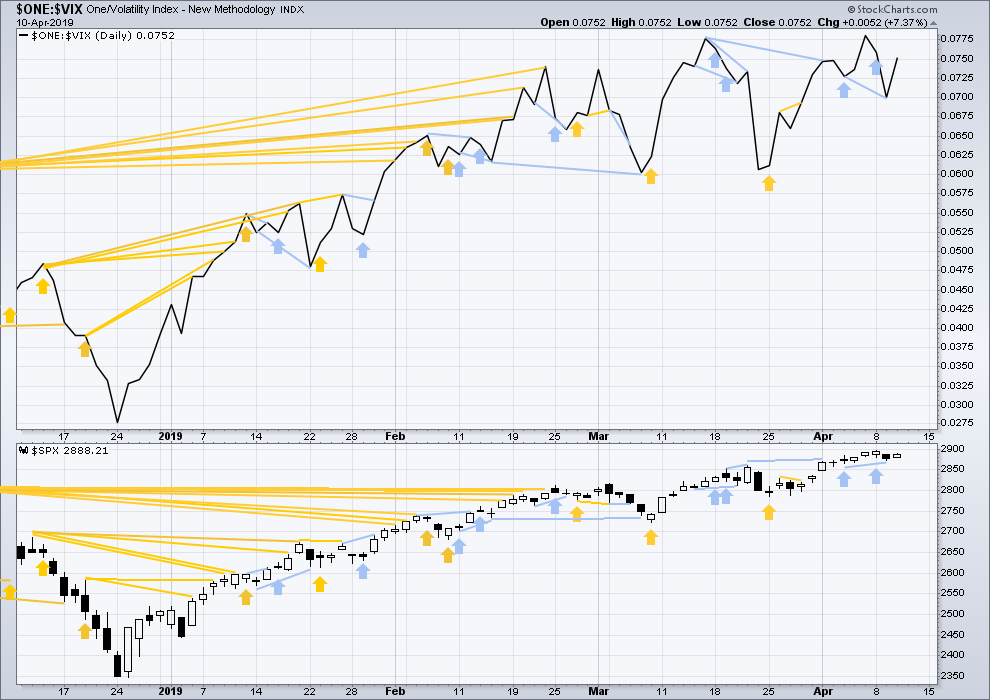
Click chart to enlarge. Chart courtesy of StockCharts.com. So that colour blind members are included, bearish signals
will be noted with blue and bullish signals with yellow.
Both price and inverted VIX moved higher today. Neither price nor inverted VIX have made a new high. There is no short-term divergence.
DOW THEORY
Dow Theory confirmed a bear market in December 2018. This does not necessarily mean a bear market at Grand Super Cycle degree though; Dow Theory makes no comment on Elliott wave counts. On the 25th of August 2015 Dow Theory also confirmed a bear market. The Elliott wave count sees that as part of cycle wave II. After Dow Theory confirmation of a bear market in August 2015, price went on to make new all time highs and the bull market continued.
DJIA: 23,344.52 – a close on the 19th of December at 23,284.97 confirms a bear market.
DJT: 9,806.79 – price has closed below this point on the 13th of December.
S&P500: 2,532.69 – a close on the 19th of December at 2,506.96 provides support to a bear market conclusion.
Nasdaq: 6,630.67 – a close on the 19th of December at 6,618.86 provides support to a bear market conclusion.
With all the indices moving now higher, Dow Theory would confirm a bull market if the following highs are made:
DJIA: 26,951.81
DJT: 11,623.58
S&P500: 2,940.91
Nasdaq: 8,133.30.
Published @ 02:37 a.m. EST on April 11, 2019.
—
Careful risk management protects your trading account(s).
Follow my two Golden Rules:
1. Always trade with stops.
2. Risk only 1-5% of equity on any one trade.
Hourly chart updated:
Minor X is 88.9% of minor Y, so this can’t be relabelled minor A-B-C for a flat correction.
Which means intermediate (4) looks like a double zigzag, so far. Which means minor Y has a purpose, to deepen the correction, so it should move reasonably below minor W.
The channel may be breached at the end of intermediate (4).
Or… it could be a triangle.
Day session over, and I still see very high potential for a triangle minor 4, with the E wave now complete. Tomorrow’s opening action should be very informative as to this possible (likely??) set up.
Kevin, I have today’s SPY high in the 9:30 candle and the SPX high in the 10:40 candle ….
I did not really notice the difference until your SPY chart below
It changes where my wave 1 and 4 (in this probable impulse down) would have overlapped
thanks
I don’t think it’s impulsive down myself. Not yet anyway. Looks more like a 3 wave E of the triangle…so far. Could change of course. Particularly if there’s burst of downward action and a break through the lower triangle TL, then the bottom of what is currently looking like the C wave (2873.3, SPX).
Not an impulse down, that’s for sure! Don’t ask how I know…
A moderate correction in SPX sure looks due. The vertical bars show the range of the last two up swings in time; price is right in the middle of this timing band now. The combination of the short term upper channel line (shown) and the overhead fibos at the 2900-2910 area, and the 2900 roundie itself, and the closeness of the count to a complete 5 wave up for this overall swing, all add evidence that a correction in the ongoing bull trend “should be” here with a few days. Breaking below the Tuesday’s swing low at 2973 would seal it for me. Remember if it’s an intermediate 4 down, and it’s the C of that Int 4, it could go far and fast as a corrective impulse.
We might get a first heads up re: a larger correction initiating from NDX here. This now has the potential look of a 5 wave ending diagonal with a throwover in place. A break below that lower trend line would be trigger #1, and breaking the other swing lows of the diagonal would fire off more. Something to keep an eye on.
Also, RUT has a flat top now on the daily. Which often precedes a RUT turn back down.
bob ross might paint my portrait today- as Ive got a happy little hedge on here… but gosh I sure wish I had a dollar for every time I thought those exact same words, ” S&P sure looks ready for moderate correction here” , over the past few years!
its an honor, actually to be participating in such a historical market.
Ive thought often of the joes and janes of their time during historical market moves… chatting at cocktail parties or staring at windows
I wonder about this (this is SPY, but it’s identical in SPX of course).
If this is what’s up, D might extend up a little higher this morning, then most of the day we get the E move down.
i would have thought that the “w” would be the “a” if this becomes a triangle
I am so very sorry everybody for the extreme lateness of todays analysis. It was prepared hours ago, but was not published.
We are making changes to our systems to ensure this never happens again.
Lara, your service is so excellent otherwise, I am sure your subscribers will overlook such a small one time issue. But please do try not to take the #1 poll position! (He-He)
Seriously though, I have a small suggestion you might want to consider. In the classic technical analysis charts, you might want to put a date by some of the comments. For instance, on the daily classic analysis chart there is a comment that “OBV has made a new ATH”. I am guessing this was from last week but the line graph is small and I cannot be certain. So if the comment had something like (4-5) or (4-5-19) at the beginning or end, I could be certain as to when you placed the comment on the chart.
Thanks again for all your excellent analysis and commentary. You are a great teacher. BTW, gold is looking great today!
I’ll update that all today to make it clearer.