
Upwards movement continues as last analysis expected it to.
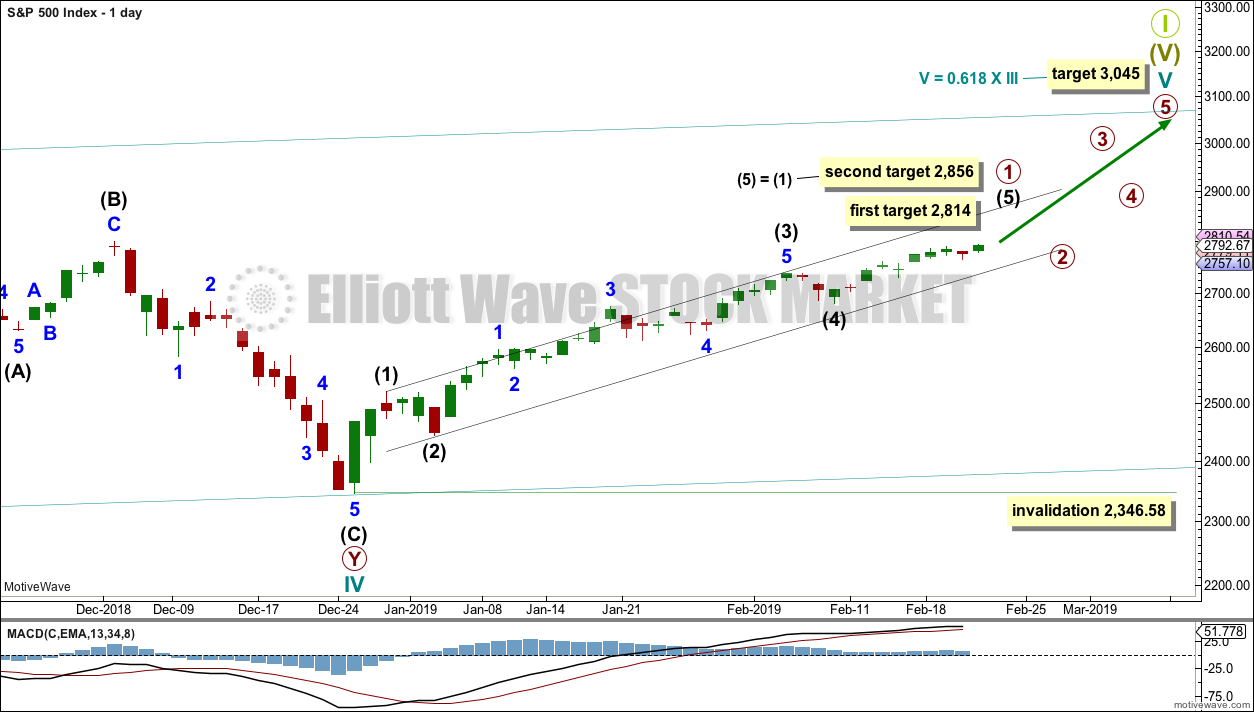
Summary: Upwards movement is slowing now it has reached a strong zone of resistance about 2,800 to 2,815. A new first target for the trend to be interrupted is at 2,814.
If price reaches 2,814 and the structure is incomplete or it just keeps rising, then the next target is at 2,856.
The bottom line for primary wave 1 now is we should assume it will continue higher towards targets until the black channel on the daily chart is breached by downwards movement.
The bigger picture still expects that a low may now be in place.
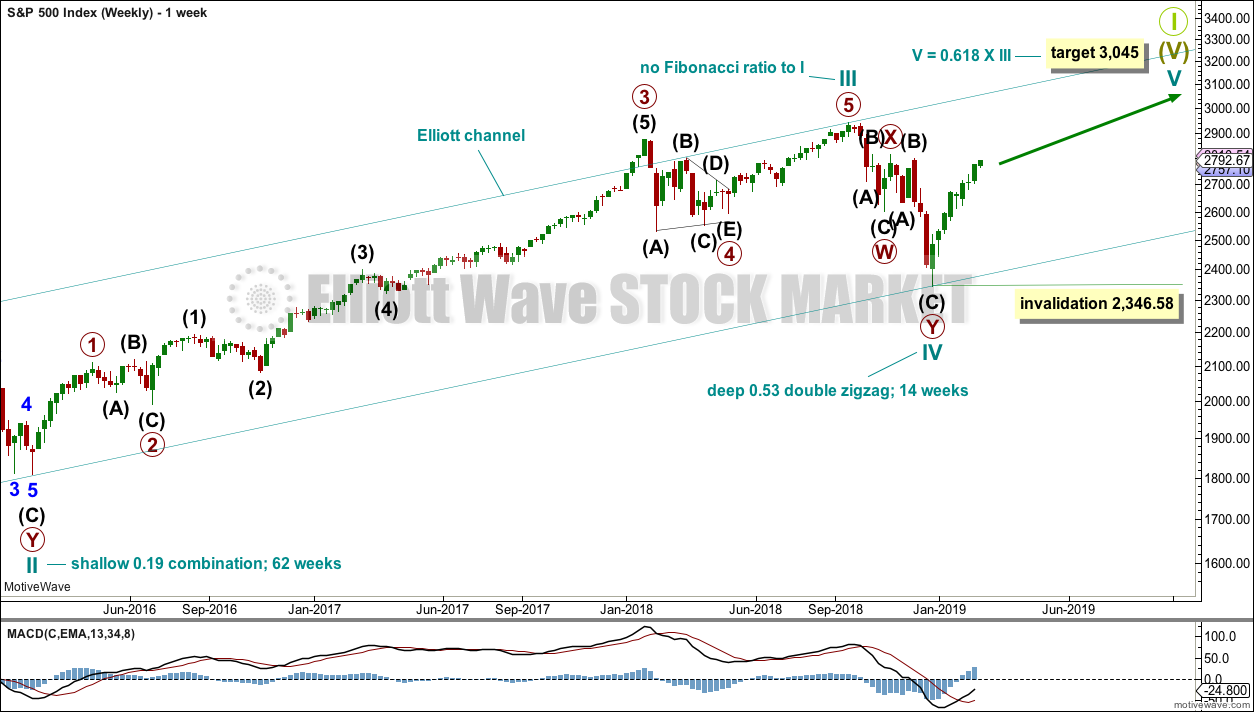
The final target is at 3,045 with a limit at 3,477.39.
New updates to this analysis are in bold.
The biggest picture, Grand Super Cycle analysis, is here.
Monthly charts are updated again at the end of this week.
ELLIOTT WAVE COUNT
MONTHLY CHART
Click chart to enlarge.
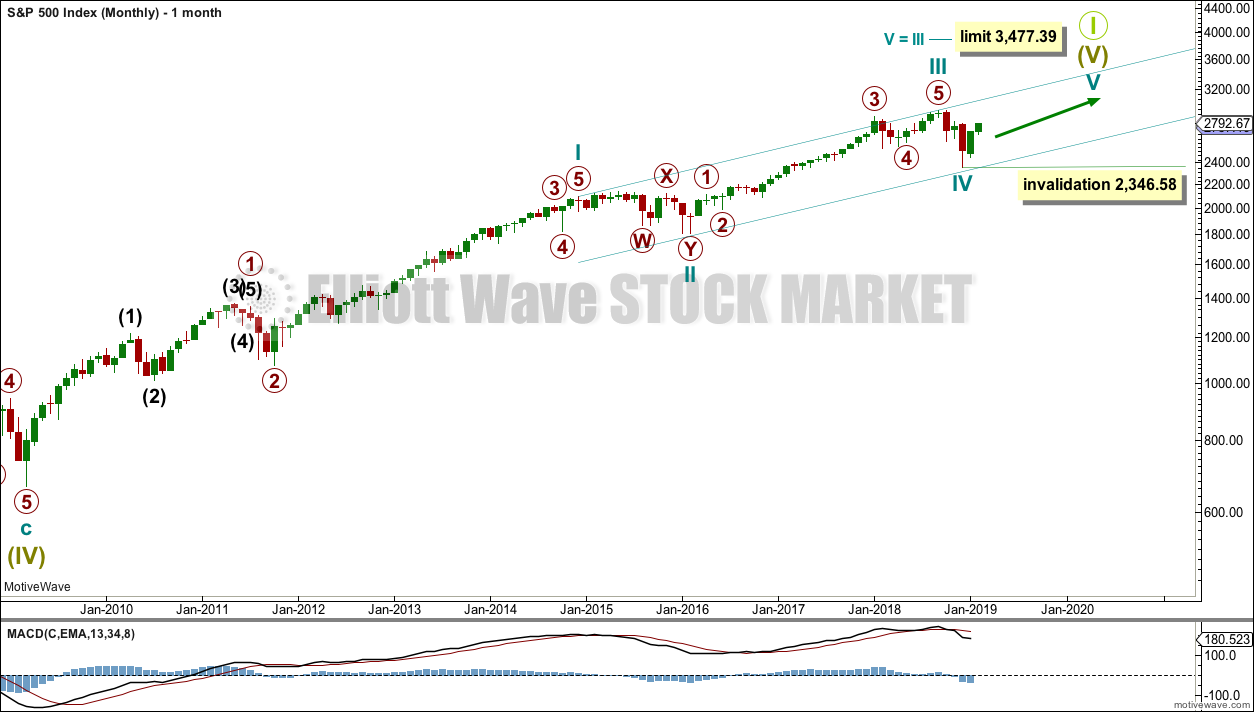
Super Cycle wave (IV) completed a 8.5 year correction. Thereafter, a bull market began for Super Cycle wave (V). The structure of Super Cycle wave (V) is incomplete. It is subdividing as an impulse.
There is no Fibonacci ratio between cycle waves I and III within Super Cycle wave (V). Cycle wave V will be limited to no longer than equality with cycle wave III, so that cycle wave III is not the shortest actionary wave.
A channel is drawn about the impulse of Super Cycle wave (V) using Elliott’s first technique. Cycle wave IV found support about the lower edge.
There is perfect alternation between a shallow time consuming combination for cycle wave II and now a deeper and more brief double zigzag for cycle wave IV. The speed and depth of cycle wave IV makes these two corrections look like they should be labelled the same degree. This wave count has the right look.
Within cycle wave V, no second wave correction may move beyond the start of its first wave below 2,346.58.
This wave count expects MACD to begin to exhibit divergence with price as price makes new highs. Cycle wave III should exhibit strongest momentum and cycle wave V should exhibit some weakness. If price makes new highs but MACD does not, then this would remain the main wave count.
WEEKLY CHART
Click chart to enlarge.
This weekly chart shows all of cycle waves III, IV and V so far.
Cycle wave II fits as a time consuming double combination: flat – X – zigzag. Combinations tend to be more time consuming corrective structures than zigzags. Cycle wave IV has completed as a multiple zigzag that should be expected to be more brief than cycle wave II.
Cycle wave IV may have ended at the lower edge of the Elliott channel.
Within cycle wave V, no second wave correction may move beyond the start of its first wave below 2,346.58.
Although both cycle waves II and IV are labelled W-X-Y, they are different corrective structures. There are two broad groups of Elliott wave corrective structures: the zigzag family, which are sharp corrections, and all the rest, which are sideways corrections. Multiple zigzags belong to the zigzag family and combinations belong to the sideways family. There is perfect alternation between the possible double zigzag of cycle wave IV and the combination of cycle wave II.
Although there is gross disproportion between the duration of cycle waves II and IV, the size of cycle wave IV in terms of price makes these two corrections look like they should be labelled at the same degree. Proportion is a function of either or both of price and time.
Draw the Elliott channel about Super Cycle wave (V) with the first trend line from the end of cycle wave I (at 2,079.46 on the week beginning 30th November 2014) to the high of cycle wave III, then place a parallel copy on the low of cycle wave II. Cycle wave V may find resistance about the upper edge.
It is possible that cycle wave V may end in October 2019. If it does not end there, or if the AD line makes new all time highs during or after June 2019, then the expectation for cycle wave V to end would be pushed out to March 2020 as the next possibility. Thereafter, the next possibility may be October 2020.
DAILY CHART
Click chart to enlarge.
The daily chart will focus on the structure of cycle wave V.
Within Super Cycle wave (V), cycle wave III may not be the shortest actionary wave. Because cycle wave III is shorter than cycle wave I, this limits cycle wave V to no longer than equality in length with cycle wave III at 3,477.39. A target is calculated for cycle wave V to end prior to this point.
Cycle wave V must subdivide as a five wave motive structure, either an impulse or an ending diagonal. An impulse is much more common and that will be how it is labelled. A diagonal would be considered if overlapping suggests it.
Primary wave 1 is labelled as incomplete.
An Elliott channel is drawn about the impulse of primary wave 1. This channel will now be used to indicate when primary wave 1 is complete and primary wave 2 has begun. When a full daily candlestick prints below the lower edge of the channel and not touching the lower edge, that may be taken as confirmation of a trend change. Assume the trend remains the same, upwards, while price remains within the channel.
Primary wave 2 may not move beyond the start of primary wave 1 below 2,346.58.
MAIN HOURLY CHART
Click chart to enlarge.
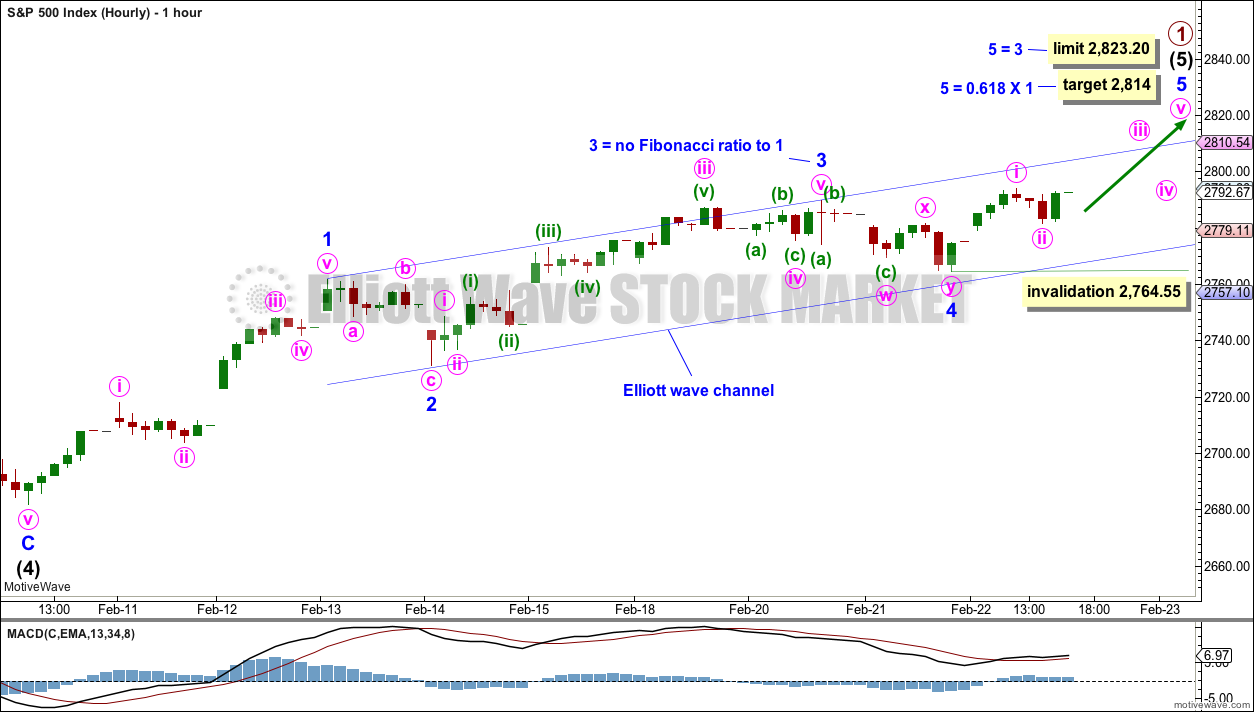
This main hourly wave count expects intermediate wave (5) to not be extended and to end within a strong zone of resistance about 2,800 to 2,815.
Within intermediate wave (5), minor waves 1 through to 4 may be complete. Minor wave 3 for this wave count is shorter in length than minor wave 1. Because a core Elliott wave rule states third waves may not be the shortest actionary waves, this limits minor wave 5 to no longer the equality in length with minor wave 3 at 2,823.20. A target for minor wave 5 to end is calculated which is below this limit.
Within minor wave 5, minute wave ii may not move beyond the start of minute wave i below 2,764.55.
ALTERNATE HOURLY CHART
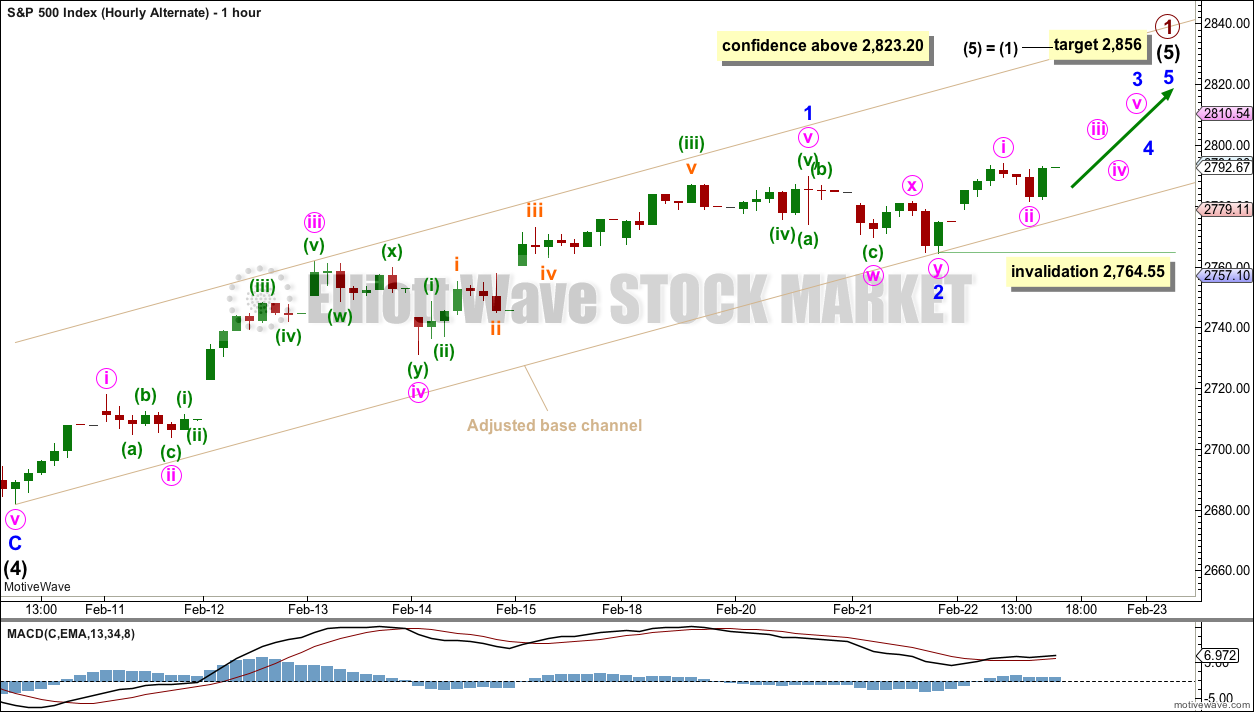
Click chart to enlarge.
Within intermediate wave (5), minor waves 1 and 2 may be complete. This alternate wave count expects intermediate wave (5) may be extending. This would be required for the target at 2,856 to be met.
Within minor wave 3, minute wave ii may not move beyond the start of minute wave i below 2,764.55.
This wave count would expect pullbacks within intermediate wave (5) to now find support about the lower edge of the base channel drawn here. If this trend line is breached by downwards movement, that would be an indication this wave count may be wrong.
ALTERNATE MONTHLY CHART

Click chart to enlarge.
It is time to consider a more bullish wave count because the AD line is making new all time highs and the end of this bull market now would be extremely likely to be a bare minimum of 4 months away, and likely longer.
If the degree of labelling is moved down within cycle wave III, then it is possible that the last high was only primary wave 1. Cycle wave III may be extending.
Only two actionary waves within an impulse may extend. Cycle wave I was extended. If cycle wave III also extends, then cycle wave V may not extend.
A target is calculated for primary wave 3 to end. If price gets up to this target and the structure is incomplete, or if price keeps rising through the target, then a new higher target would then be calculated.
Within primary wave 3, no second wave correction may move beyond the start of its first wave below 2,346.58.
This wave count expects MACD to indicate stronger momentum as price makes a new all time high. If that happens, then this may be switched to be the main wave count.
TECHNICAL ANALYSIS
WEEKLY CHART
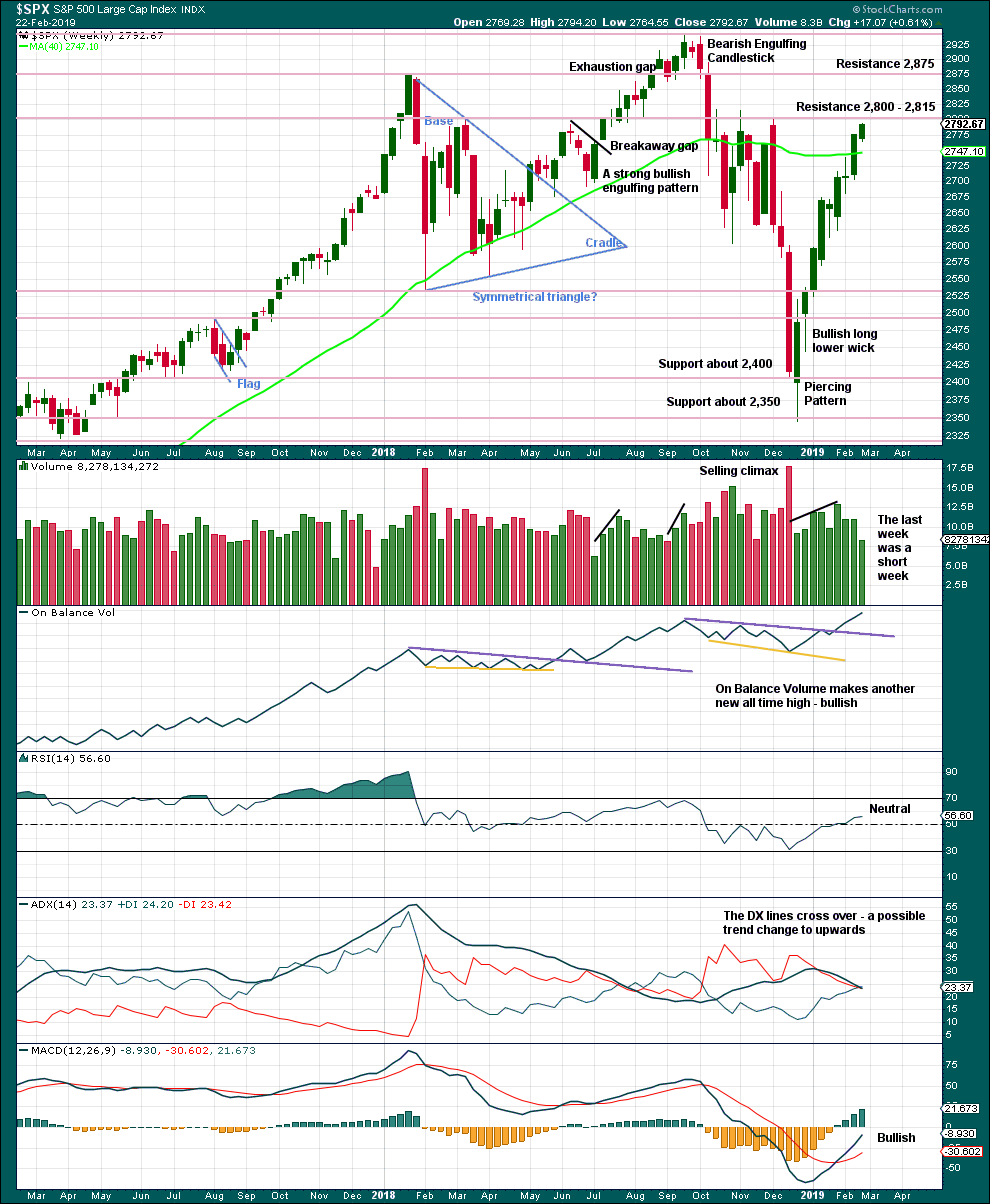
Click chart to enlarge. Chart courtesy of et=”_blank”>StockCharts.com.
Because this week consisted of only four trading days, the decline in volume may not be necessarily bearish. It is necessary this week to look inside the week at daily volume bars to judge the volume profile.
Overall, this chart is bullish and supports the Elliott wave count.
DAILY CHART
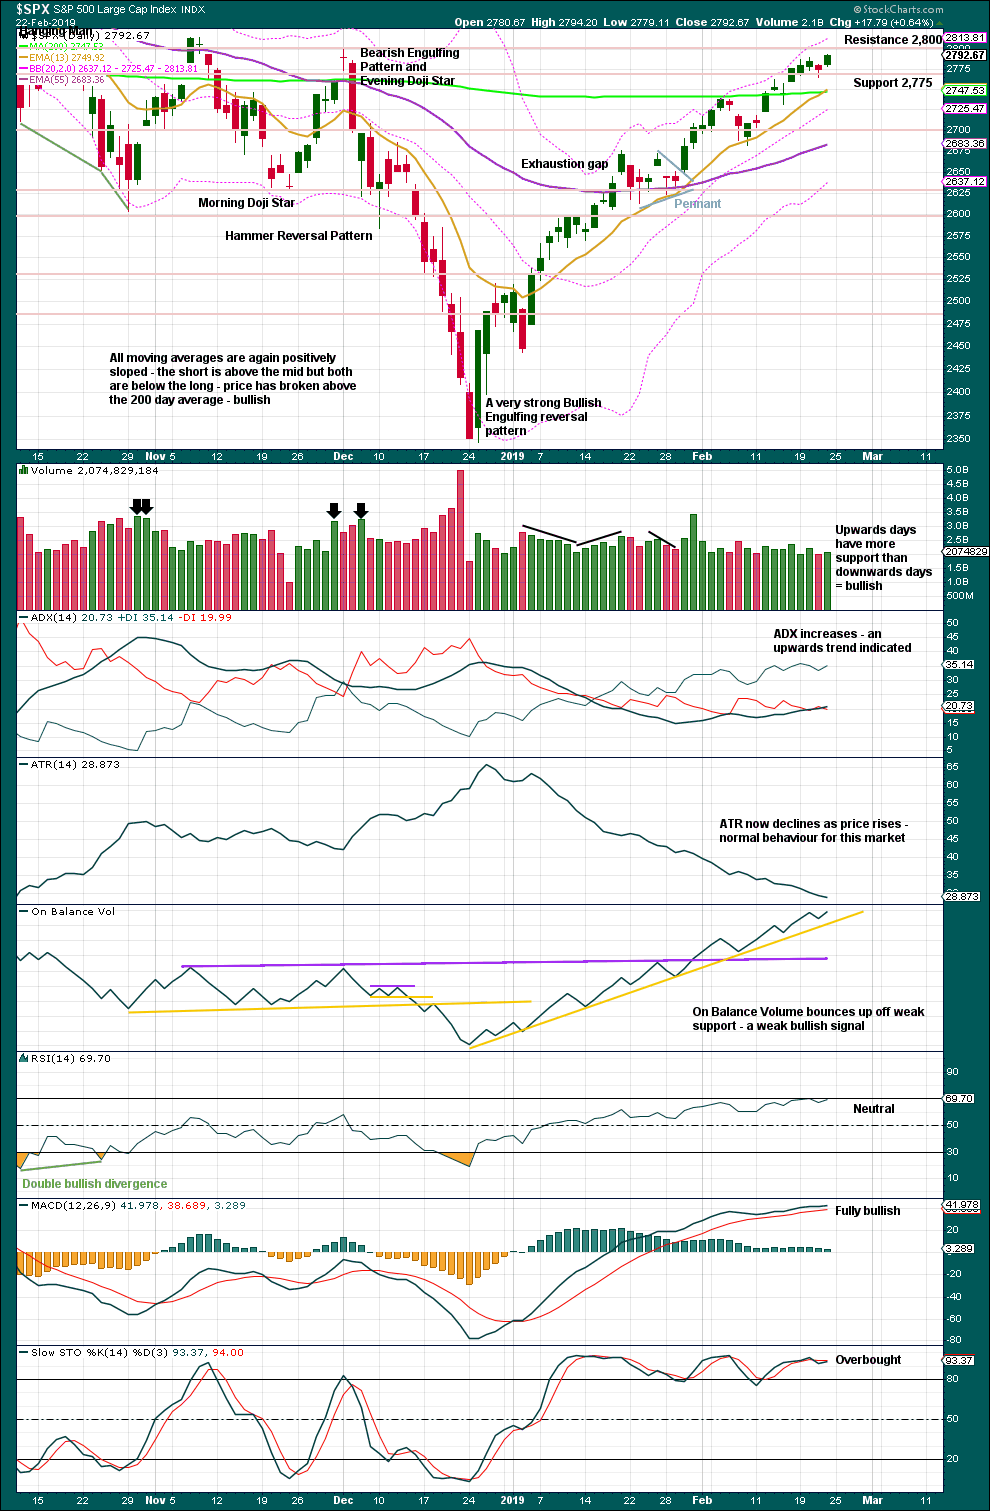
Click chart to enlarge. Chart courtesy of StockCharts.com.
Over a fairly long period of time this ageing bull market has been characterised by upwards movement on light and declining volume and low ATR. For the short to mid term, little concern may be had if price now rises again on declining volume. Current market conditions have allowed for this during a sustained rise in price.
It is also normal for this market to have lower ATR during bullish phases, and strongly increasing ATR during bearish phases. Currently, declining ATR is normal and not of a concern.
Considering the larger picture from the Elliott wave count, some weakness approaching the end of Grand Super Cycle wave I is to be expected.
From Kirkpatrick and Dhalquist, “Technical Analysis” page 152:
“A 90% downside day occurs when on a particular day, the percentage of downside volume exceeds the total of upside and downside volume by 90% and the percentage of downside points exceeds the total of gained points and lost points by 90%. A 90% upside day occurs when both the upside volume and points gained are 90% of their respective totals”…
and “A major reversal is singled when an NPDD is followed by a 90% upside day or two 80% upside days back-to-back”.
The current situation saw two 80% downside days on December 20th and 21st, then a near 90% downside day with 88.97% downside on December 24th. This very heavy selling pressure on three sessions together may be sufficient to exhibit the pressure observed in a 90% downside day.
This has now been followed by two 90% upside days: on December 26th and again on 4th January.
The current situation looks very much like a major low has been found.
This chart is overall very bullish. Only the moving averages are not yet full bore bullish.
Look out though for strong resistance here about 2,800 to 2,815. How price behaves in this zone may indicate whether or not a deeper pullback may begin.
This upwards trend continues to have support from rising buying power and falling selling pressure. This trend looks strong and healthy.
BREADTH – AD LINE
WEEKLY CHART
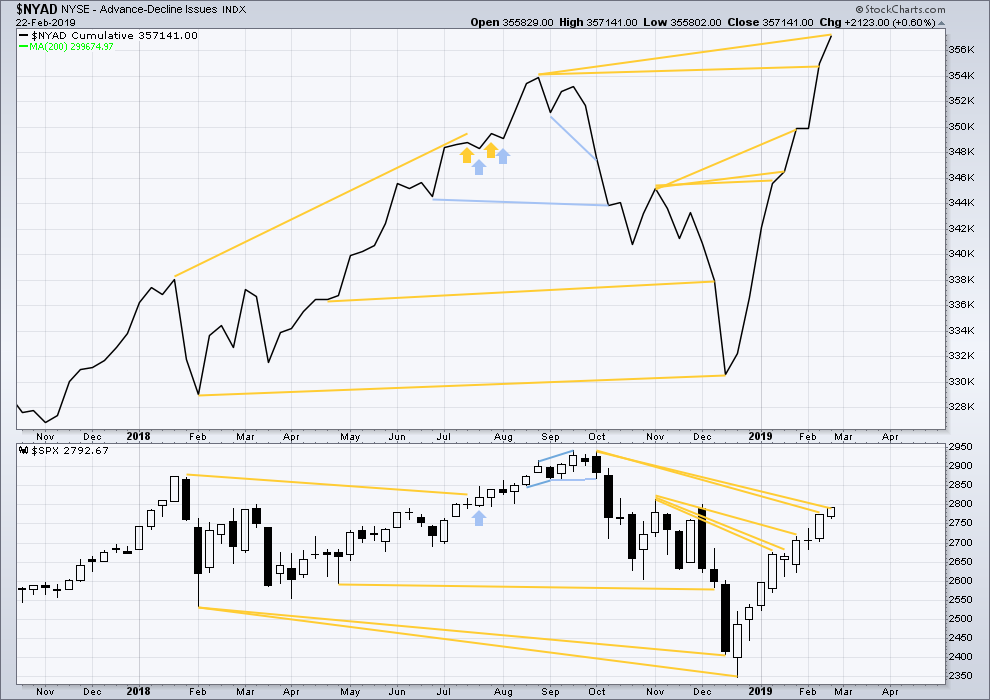
Click chart to enlarge. Chart courtesy of StockCharts.com. So that colour blind members are included, bearish signals
will be noted with blue and bullish signals with yellow.
Every single bear market from the Great Depression and onwards has been preceded by a minimum of 4-6 months divergence between price and the AD line. With the AD line making a new all time high again this week, the end of this bull market and the start of a new bear market must be a minimum of 4 months away, which is mid to end June 2019 at this time.
DAILY CHART
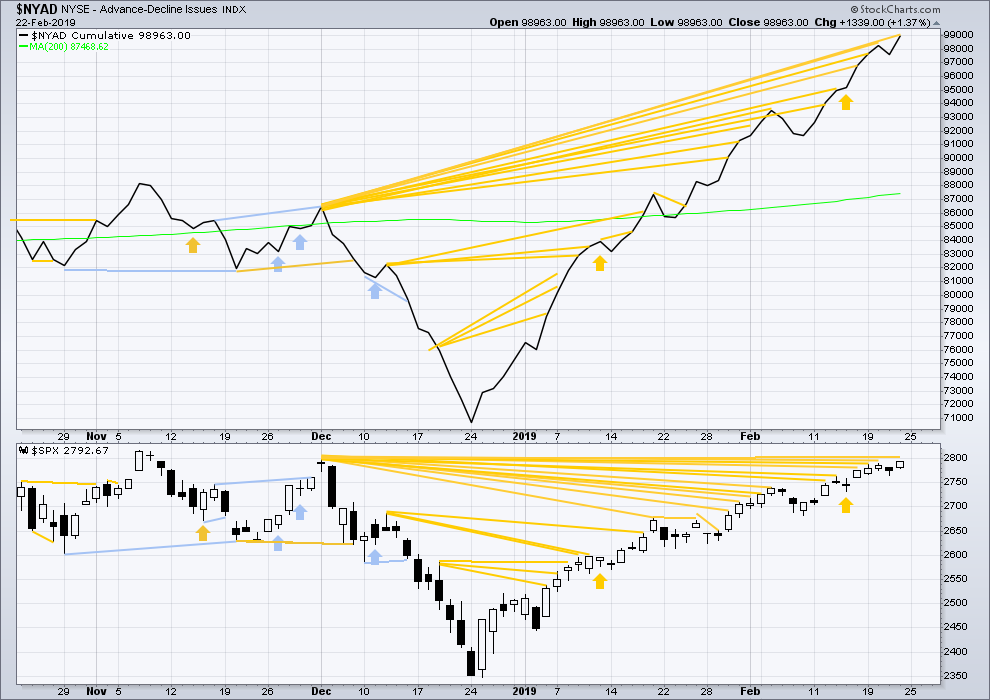
Click chart to enlarge. Chart courtesy of StockCharts.com. So that colour blind members are included, bearish signals
will be noted with blue and bullish signals with yellow.
Breadth should be read as a leading indicator.
There is now a cluster of bullish signals from the AD line. This supports the Elliott wave count.
The AD line is making new highs above the prior high of the 3rd of December, but price is not. This divergence continues and is bullish.
VOLATILITY – INVERTED VIX CHART
WEEKLY CHART
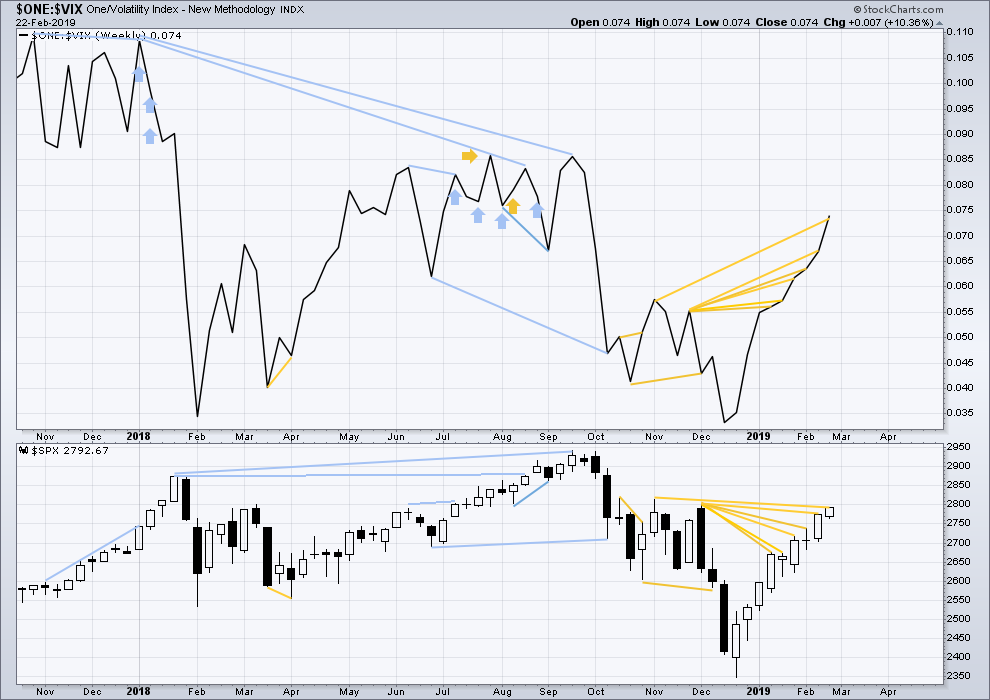
Click chart to enlarge. Chart courtesy of StockCharts.com. So that colour blind members are included, bearish signals
will be noted with blue and bullish signals with yellow.
Inverted VIX has made a new high above the prior swing high of the week beginning 5th of November 2018, but price has not. This divergence is bullish for the mid term.
DAILY CHART
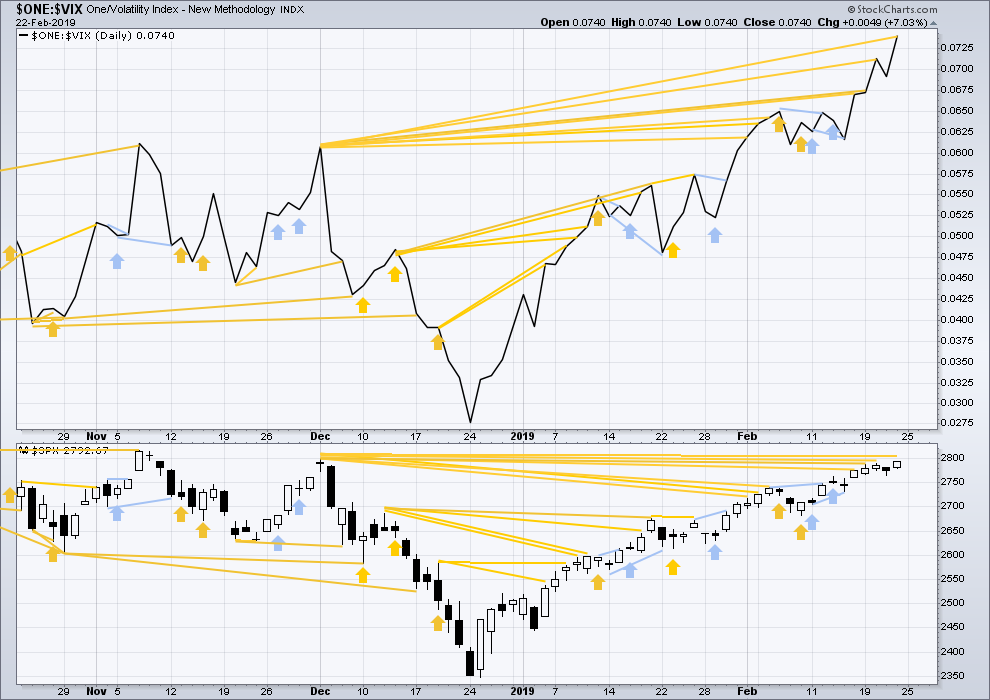
Click chart to enlarge. Chart courtesy of StockCharts.com. So that colour blind members are included, bearish signals
will be noted with blue and bullish signals with yellow.
There is now a cluster of bullish signals from inverted VIX that support the Elliott wave count.
Inverted VIX has made another new high above the prior swing high of the 3rd of December 2018, but price has not. This divergence continues and is bullish.
DOW THEORY
Dow Theory confirms a bear market. This does not necessarily mean a bear market at Grand Super Cycle degree though; Dow Theory makes no comment on Elliott wave counts. On the 25th of August 2015 Dow Theory also confirmed a bear market. The Elliott wave count sees that as part of cycle wave II. After Dow Theory confirmation of a bear market in August 2015, price went on to make new all time highs and the bull market continued.
DJIA: 23,344.52 – a close on the 19th of December at 23,284.97 confirms a bear market.
DJT: 9,806.79 – price has closed below this point on the 13th of December.
S&P500: 2,532.69 – a close on the 19th of December at 2,506.96 provides support to a bear market conclusion.
Nasdaq: 6,630.67 – a close on the 19th of December at 6,618.86 provides support to a bear market conclusion.
With all the indices moving now higher, Dow Theory would confirm a bull market if the following highs are made:
DJIA: 26,951.81
DJT: 11,623.58
S&P500: 2,940.91
Nasdaq: 8,133.30.
Published @ 08:31 p.m. EST.
—
Careful risk management protects your trading account(s).
Follow my two Golden Rules:
1. Always trade with stops.
2. Risk only 1-5% of equity on any one trade.
/ES hourly with overnight data. Breaking below 2794 fibo cluster would significant IMO, and increase the odds this is going much deeper, with the lower channel line a major target.
Another gravestone doji in DJIA.
Turn? or Tease? 🙂
It would have been nice to see a VIX gap higher to confirm…
Don’t tease me Verne …lol
I needed that turn down today
My hedges were set for 2807 and they paid
And now I am feeling pretty good
Will exit some short vxxb put sales tomorrow
And I’ll have that sucker down to 31 unhedged …
I’m ready to enjoy a little ride brother
Me too!
Got slapped around on my TVIX long.
Out of hedges at the close, so probably a bit more pain ahead… 🙂
THANK YOU LARA!
You’re welcome, as always 🙂
Hourly chart updated:
If the gap stays open today it will be another continuation or measuring gap.
Minute iv may not move into minute i price territory. This count needs only one very slight new high to see the end of primary wave 1. I would wait for a breach of a channel before I had confidence that P1 was over though because there are more ways to label the subdivisions within it.
Alternate hourly chart updated:
Minor 3 could be as labelled, or I could move the degree of labelling down one and only minute i within it may be nearing an end.
Within minor 3, no second wave may move beyond its start.
The session is closed and the gap remains open, just. I’ll read it as a continuation / measuring gap, until proven otherwise.
If it’s closed by a new low below 2,794.20 it would be relabelled an exhaustion gap and we’d then look for another small pullback, or possibly primary wave 2.
SPX up 0.4% with VIX up around 4% at the same time. Haven’t seen that in a loooong time
🙂
Ah-ha-ha! One of the huge signals back in late Jan 2018 was similar serious VIX divergence.
Yes sir. The maket was just going up almost everyday, and there was 2-3 days of VIX divergence, and then intermediate 4 happened.
VX primed for quite a pop methinks!
Beautiful falling wedge…
Has anyone noticed that we’ve had 4 gap ups in the past 6-7 trading sessions. And today’s open is a gap on the weekly. I’m thinking we’ve got to close some of these gaps in short order…
Anyone know the ramifications or signal if any of so many gap ups?
funny you should say that, I was just thinking “now is this a continuation gap…or an EXHAUSTION gap????”
Thinking “exhaustion gap” here. I violated all my own rules and went long Friday afternoon with a small position. Thankfully stop is profitable. I’m looking for maybe one more push up, and then “pow.”
We will see…
Kevin, look at LULU…. quick gap fill so far…… i took a short bite
I don’t care for the toppish shooting star on the weekly on top of the 78.6% Peter. I don’t see this set up here as overly bullish myself, particularly given my outlook that perhaps the whole market has just topped, but your mileage will vary. Best of luck there.
Thankfully I violated my “rule” and held my longs over the weekend. All cashed now. Price has just about hit the upper trend line, and is in the thick of the resistance zone. Doesn’t seem to be any follow through to this gap open push up…yet.
Good move! That is a good way to start the week.
Nice Kevin
That makes for a nice start of the week to see a big gap….
It’s been a while since I have felt that
Lol
My top projection from a week ago, we’ll see.
A windy Sunday afternoon here in Champaign.
We had an awesome lunch of broiled Whitefish, roasted veggies and Pinot Grigio.
I am listening to the peerless Julian Bream perform wonders on the classical guitar on his “Spanish Guitar Recital”
A friend gave me the CD a few weeks ago and I was delighted to add it to my considerable Bream collection (including cassettes!). Pure Magic! 🙂
I play classical guitar just about every day. Bream was superb. His Pavane Pour Une Infante Defunte from his younger days stands out for me. I’m a mere amateur. I’ve got recordings at zinc1024 at you tube and soundcloud, which should ideally all be replaced with better versions, someday, lol! How many guitarists to screw in a lightbulb? 21, one to screw and 20 to stand around and say “I can do that!”.
Kevin, it would be sweet to hear your stuff! I also have some material on Soundcloud — nature soundscape recordings captured in Minnesota’s Chippewa National Forest.
You show yours, I’ll show mine.
Sure Curtis. As I said, it’s under the zinc1024 account, just tag that to the end of the soundcloud URL and you are there I believe. As I said I am merely a dedicated hack!
Oops, sorry I missed that. But I’m there now, and enjoying it. Nice work! I can’t do that!
My Soundcloud account is the same as my website — MinnesotaSoundscapes.com. I need to add some new tracks soon.
ah, very chill w/a cup of strong coffee! love the birds…
Must be a slow evening for you guys.
We are in the midst of a record breaking very late winter snow storm. One of my good friends living an hour away from me received three feet of fresh snow this weekend with another eighteen inches forecast. The Sierra Nevada mountains have a record year of winter snow. Polar vortex reeking havoc in North America. They had to close a ski race in the Alps because of too much snow. Long dried up desert river beds become wet lands in Asia / India. Quite a winter. I understand we are in a Super Grand Solar Minimum that is expected to last until 2030 with the worst around 2023. So far this year we have experienced something like 56 days with no solar flares. I understand that is a lot relative to the last few decades or so.
Verne,
You mentioned a week or so ago of the possibility that this could be a B wave. Ive studied this since and agree with the possibility but am struggling with the labeling of this current wave as corrective. Do you have a labeling that you wouldn’t mind sharing?
Everyone have a GREAT weekend !
Thanks
I suppose it could be the a of an abc B wave up. Seems unlikely, however. It’s as impulsive as price waves get, and its in the direction of the monthly trend. Looks motive, feels motive. It’s probably not a B wave.
Note that we won’t know that for certain for quite a while, because if it is, the b down is going to be viewed as a 2 down, and the c up will at least for a while look like a 3 up, until it stalls “early” and returns back down through the top of the 1.
C waves can and often do have a very impulsive look.
One of the things that gives them away is an absence of the typical fib re-tracements you generally see in regular impulsive waves.
Hi Tradeshark:
My charting skills leave a lot to be desired but I have been closely watching Avi Gilburt’s calls on where we might be headed. I started taking his call for a possible visit to the 2820 region very seriously once we closed above my own short term bear/bull pivot of 2700. He had originally opined that this might be an “a” of an abc up of a larger B, with a C down ahead to complete the P4 wave. I have kept an open mind on that score as I thought the completion of a P4 would have been remarkably brief for a primary degree wave. I think it is also noteworthy that we are still below the log-scale broken trend-line that has held since the 2009 lows, the ferocity of the current bounce notwithstanding. I think we should have a lot more confidence on where we are going after next week’s price action. A close above 2820 with an accompanying retake by RUT of its 200 day will put me firmly in the bullish camp. Here is a link to some of Avi’s public charts that reflect some of the charting options I think still open at the present time. Cheers! 🙂
https://www.elliottwavetrader.net/marketupdate/Market-Leaving-All-Potentials-On-The-Table-201902205141731.html
I have the RUT 200 day sma at 1587 and the RUT at 1590, both as of close Friday.
That’s a very reasonable alternative thesis, and one to be taken seriously. Indeed, the extreme historical (not implied) volatility since the low suggests action inside an ongoing cycle 4 correction.
I take Ciovacco’s two part indicator of an overall bull move in progress seriously though (this week’s video). Staying above the 200 day in the inevitable consolidation would be a huge bull move coming indicator.