
Downwards movement has indicated a larger correction may have arrived after eight consecutive upwards sessions. Volume is analysed to identify strength or weakness in today’s pullback.
Summary: A pullback or consolidation may now unfold over a few days. Look for support at the lower edge of the best fit channel and about 2,868. Thereafter, the upwards trend should resume.
The final target remains the same at 3,045.
New updates to this analysis are in bold.
The biggest picture, Grand Super Cycle analysis, is here.
Last published monthly charts are here. Video is here.
ELLIOTT WAVE COUNTS
WEEKLY CHART
Click chart to enlarge.
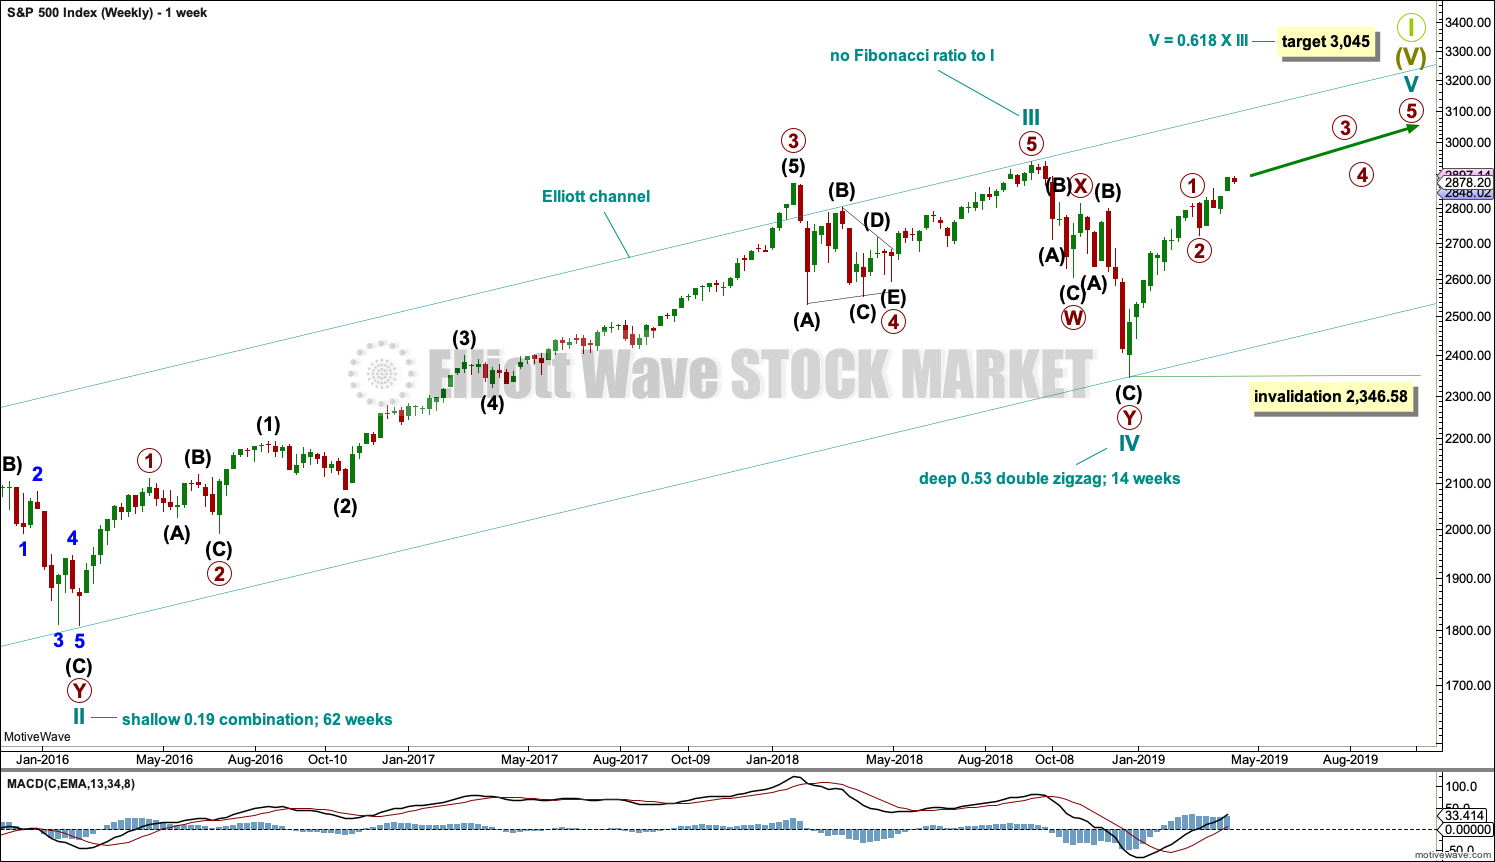
This weekly chart shows all of cycle waves III, IV and V so far.
Cycle wave II fits as a time consuming double combination: flat – X – zigzag. Combinations tend to be more time consuming corrective structures than zigzags. Cycle wave IV has completed as a multiple zigzag that should be expected to be more brief than cycle wave II.
Cycle wave IV may have ended at the lower edge of the Elliott channel.
Within cycle wave V, no second wave correction may move beyond the start of its first wave below 2,346.58.
Although both cycle waves II and IV are labelled W-X-Y, they are different corrective structures. There are two broad groups of Elliott wave corrective structures: the zigzag family, which are sharp corrections, and all the rest, which are sideways corrections. Multiple zigzags belong to the zigzag family and combinations belong to the sideways family. There is perfect alternation between the possible double zigzag of cycle wave IV and the combination of cycle wave II.
Although there is gross disproportion between the duration of cycle waves II and IV, the size of cycle wave IV in terms of price makes these two corrections look like they should be labelled at the same degree. Proportion is a function of either or both of price and time.
Draw the Elliott channel about Super Cycle wave (V) with the first trend line from the end of cycle wave I (at 2,079.46 on the week beginning 30th November 2014) to the high of cycle wave III, then place a parallel copy on the low of cycle wave II. Cycle wave V may find resistance about the upper edge.
It is possible that cycle wave V may end in October 2019. If it does not end there, or if the AD line makes new all time highs during or after June 2019, then the expectation for cycle wave V to end would be pushed out to March 2020 as the next possibility. Thereafter, the next possibility may be October 2020. March and October are considered as likely months for a bull market to end as in the past they have been popular. That does not mean though that this bull market may not end during any other month.
MAIN WAVE COUNT
DAILY CHART
Click chart to enlarge.
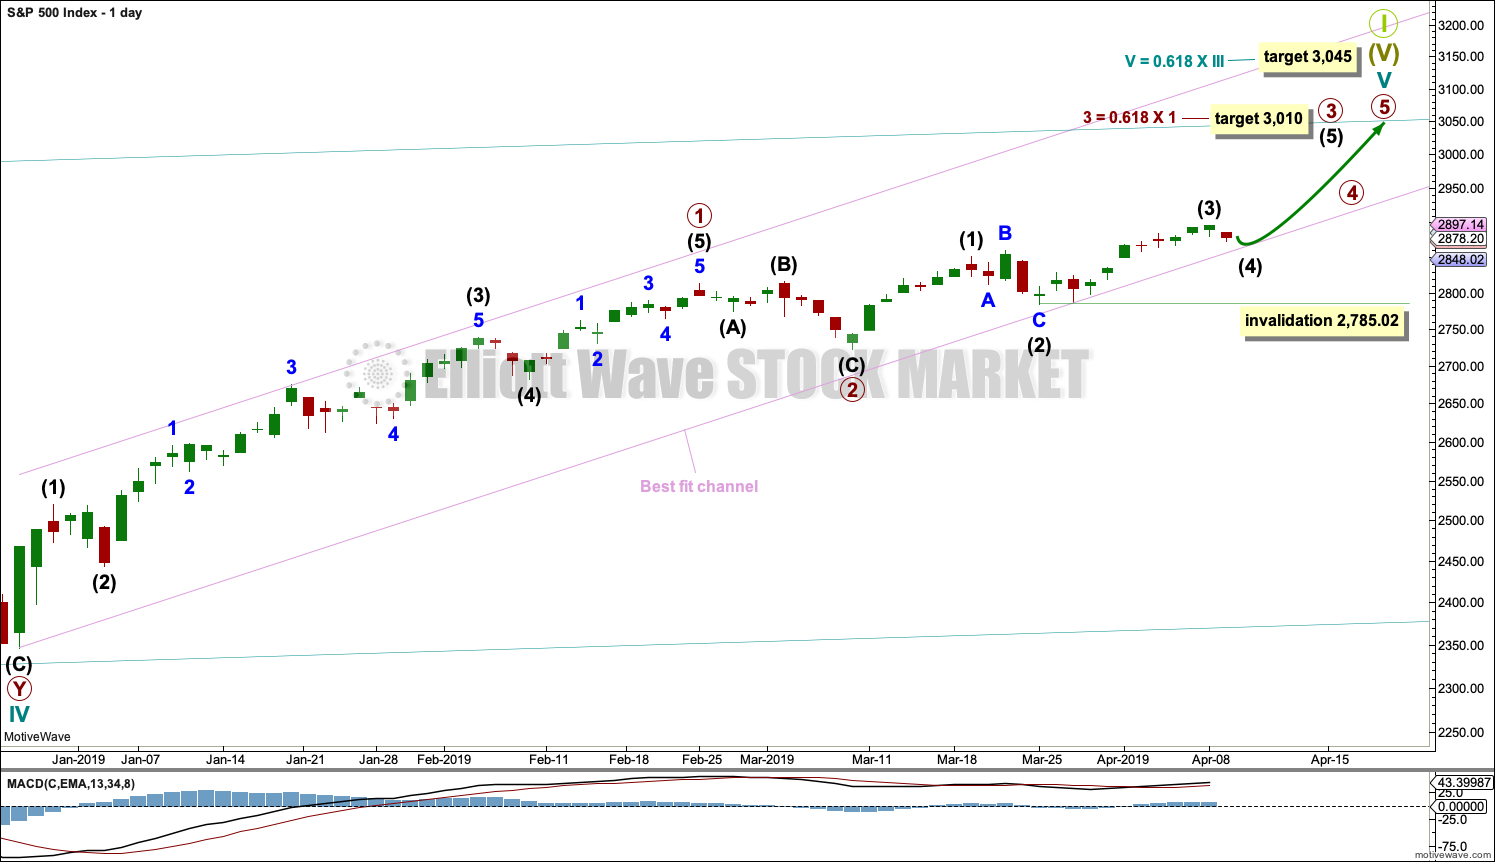
The daily chart will focus on the structure of cycle wave V.
Within Super Cycle wave (V), cycle wave III may not be the shortest actionary wave. Because cycle wave III is shorter than cycle wave I, this limits cycle wave V to no longer than equality in length with cycle wave III at 3,477.39. A target is calculated for cycle wave V to end prior to this point.
However, members are reminded that there is an alternate monthly wave count that does not have a limit to upwards movement. There is a link to it at the start of each analysis.
Cycle wave V must subdivide as a five wave motive structure, either an impulse or an ending diagonal. An impulse is much more common and that will be how it is labelled. A diagonal would be considered if overlapping suggests it.
Primary wave 2 may have been a very brief and shallow expanded flat correction.
Within primary wave 3, intermediate waves (1) through to (3) may now be complete.
If intermediate wave (3) is complete, then it would be shorter than intermediate wave (1). This limits intermediate wave (5) to no longer than equality in length with intermediate wave (3) at 110.93 points, so that the core Elliott wave rule stating a third wave may not be the shortest is met. The target at 3,010 would be too high.
The target for primary wave 3 and the invalidation point are left as is to allow for the possibility that intermediate wave (3) may be incomplete and may extend higher. If the degree of labelling within intermediate wave (3) is moved down one degree to see only minor wave 1 over at the last high, then minor wave 2 may not move beyond the start of minor wave 1 below 2,785.02.
The channel shows where small pullbacks are finding support.
HOURLY CHART
Click chart to enlarge.
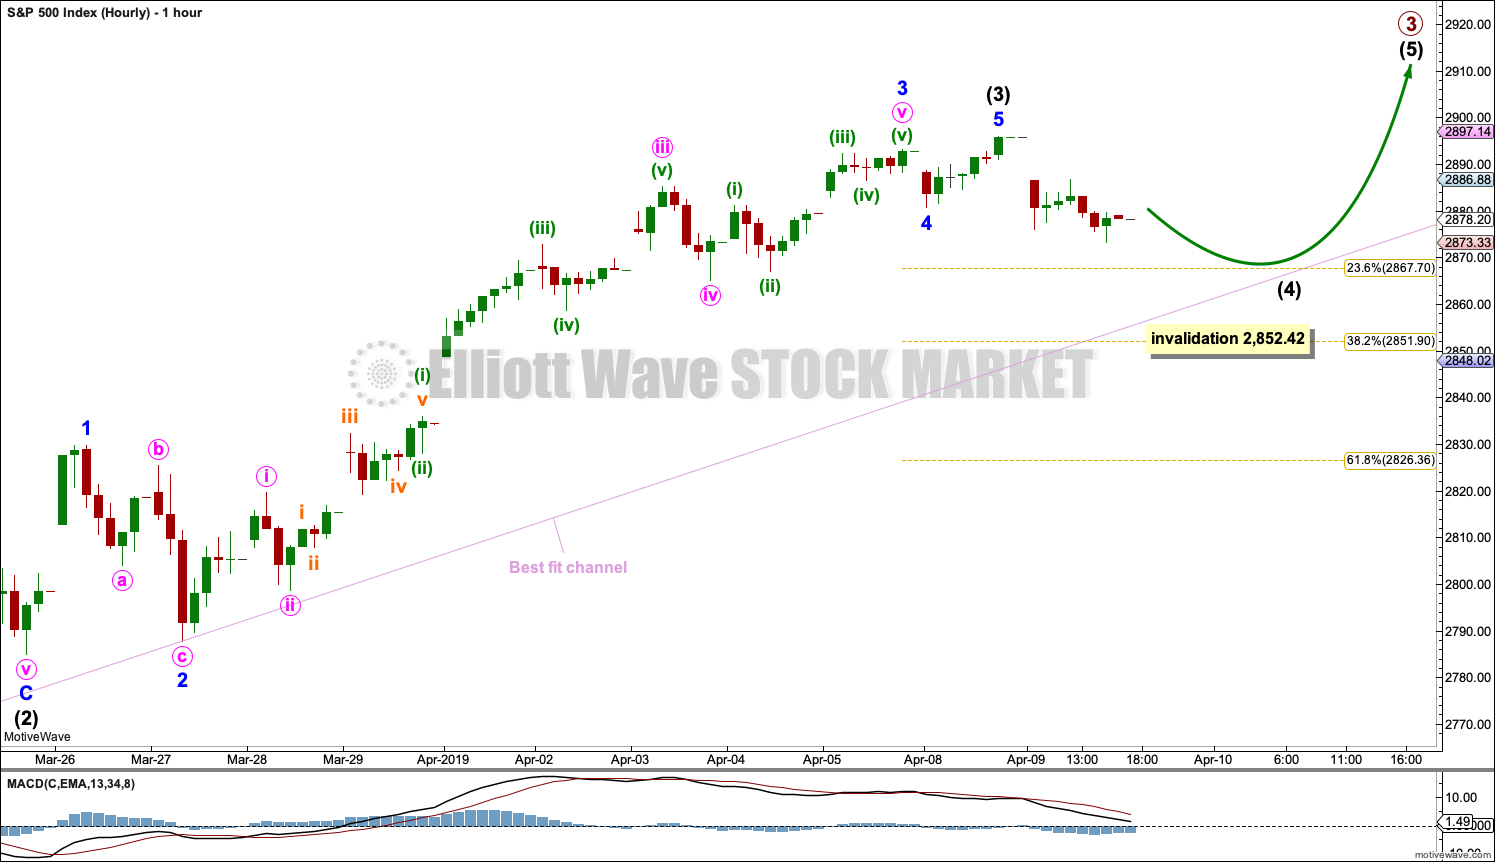
Intermediate wave (3) has now moved above the end of intermediate wave (1) meeting a core Elliott wave rule.
So far this labelling agrees with MACD. Minor wave 3 exhibits an increase in momentum beyond that of minor wave 1. Minor wave 5 exhibits a decline in momentum.
Intermediate wave (3) exhibits no Fibonacci ratio to intermediate wave (1) and is 19.22 points shorter than intermediate wave (1) if it is over at the last high.
Intermediate wave (2) subdivided as an expanded flat lasting four sessions. Given the guideline of alternation intermediate wave (4) may be expected to be a shallow sideways correction such as a triangle or combination. It may also be a relatively brief zigzag. The 0.236 Fibonacci ratio may be a preferred target as this is about where the lower edge of the best fit channel currently sits.
Intermediate wave (4) may last about four sessions. It may be longer if it is a more time consuming triangle or combination. If intermediate wave (4) unfolds as a zigzag, it may be over in just a Fibonacci three sessions.
At this stage, focus will be not on identifying which structure intermediate wave (4) may be unfolding as but on identifying when it may be complete.
Intermediate wave (4) may not move into intermediate wave (1) price territory below 2,852.42.
If this wave count is invalidated with a new low by any amount at any time frame below 2,852.42, then the degree of labelling within intermediate wave (3) would be moved down one degree to see only minor wave 1 complete at the last high. Minor wave 2 may not move beyond the start of minor wave 1 below 2,785.02.
TECHNICAL ANALYSIS
WEEKLY CHART
Click chart to enlarge. Chart courtesy of et=”_blank”>StockCharts.com.
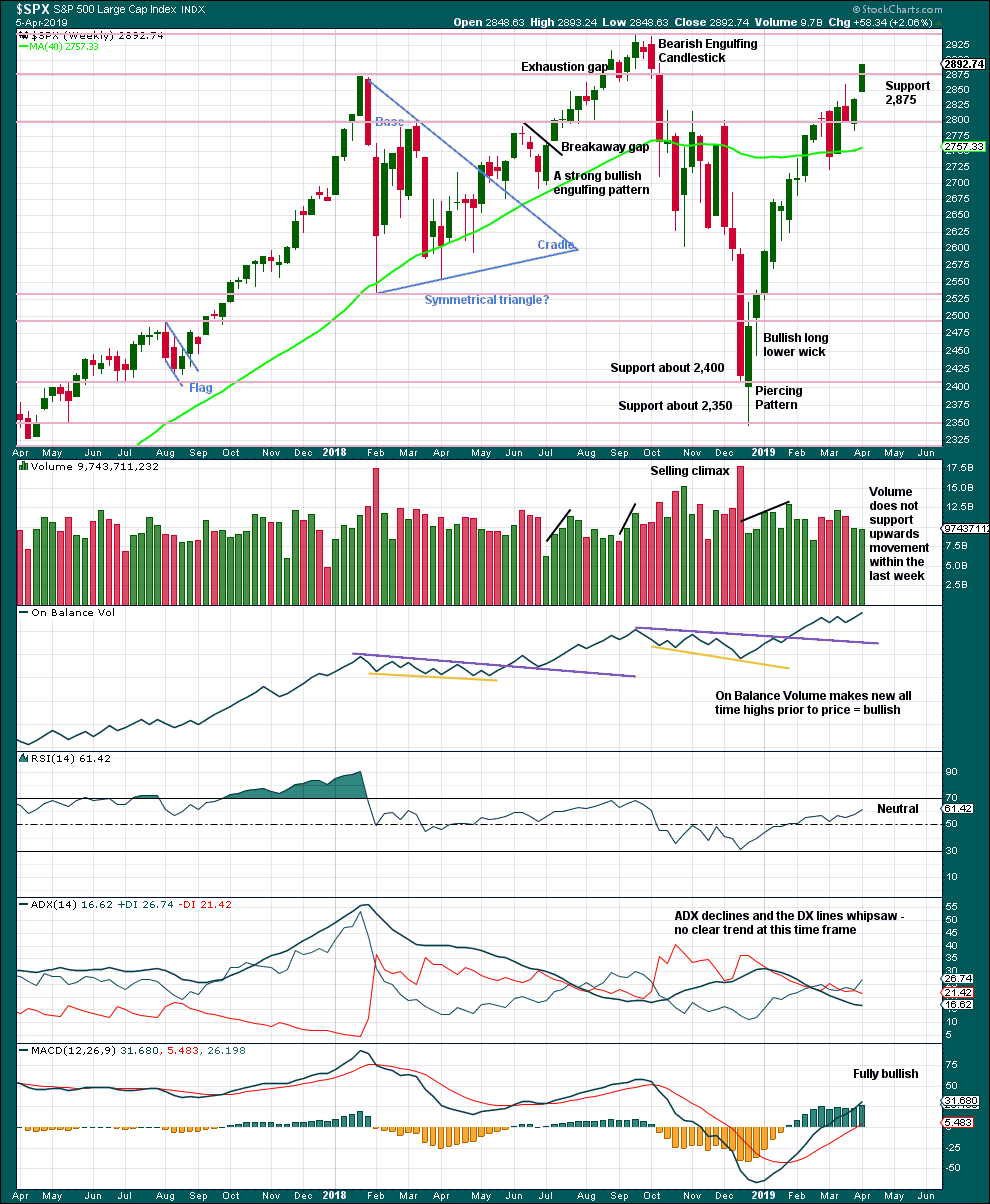
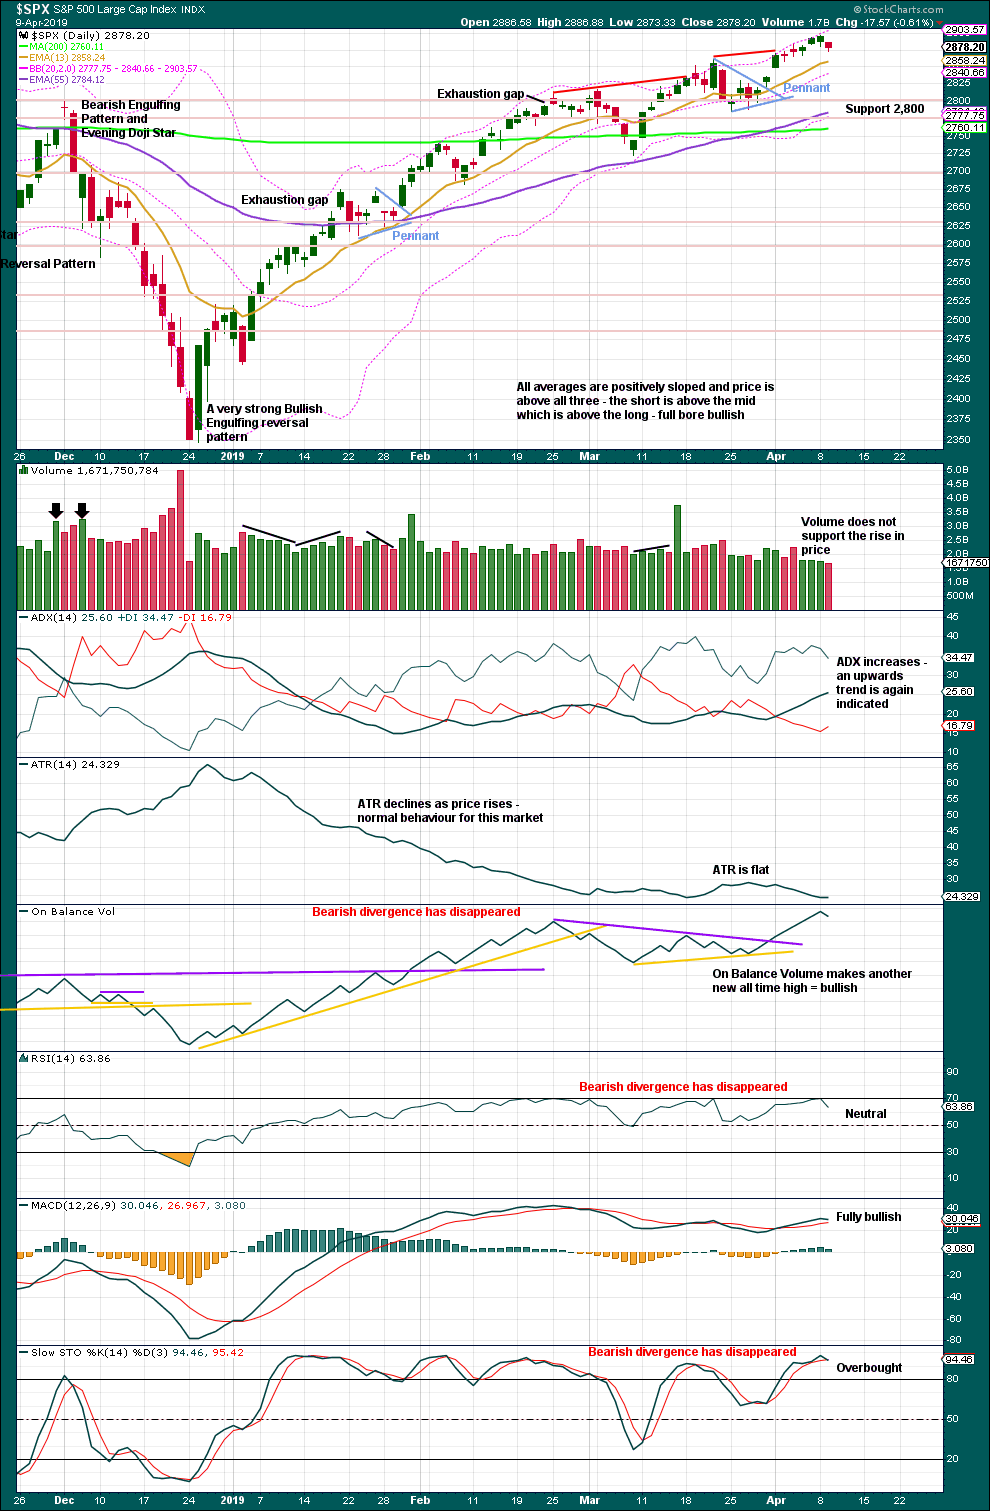
A strong upwards week, with price closing near the high for the week, and On Balance Volume making a new all time high suggest more upwards movement this week.
DAILY CHART
Click chart to enlarge. Chart courtesy of StockCharts.com.
The December 2018 low is expected to remain intact. The two 90% upwards days on 26th December 2018 and 6th January 2019 indicate this upwards trend has internal strength.
Lowry’s data shows Selling Pressure has reached another new low for this bull market, and Buying Power has reached a new high for this rally. This indicates an expansion in demand and a contraction in supply, which has historically been associated with strong phases of bull markets. This strongly supports the Elliott wave count, which expects new all time highs to come this year.
While the last swing low of the 25th of March remains intact, there exists a series of higher highs and higher lows from the major low in December 2018. It would be safest to assume the upwards trend remains intact.
The pennant pattern is a reliable short-term continuation pattern. A target calculated using the flag pole is about 2,956.
Today’s downwards movement comes on the lightest volume for 2019 so far. This downwards movement so far may be a reaction to overbought market conditions after eight consecutive upwards sessions.
BREADTH – AD LINE
WEEKLY CHART
Click chart to enlarge. Chart courtesy of StockCharts.com. So that colour blind members are included, bearish signals
will be noted with blue and bullish signals with yellow.
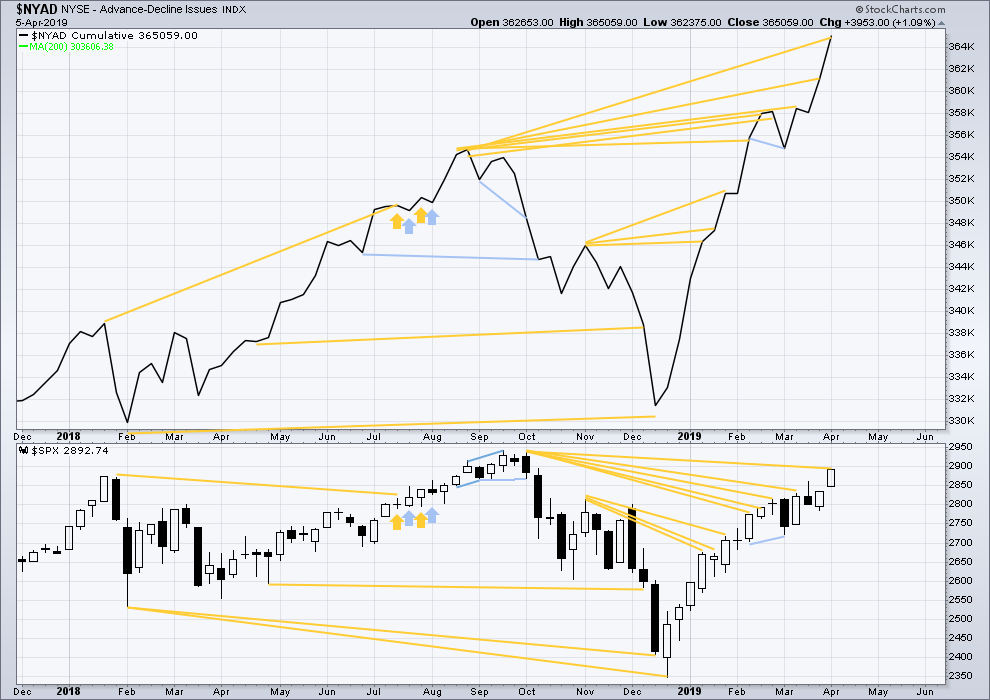
Every single bear market from the Great Depression and onwards has been preceded by a minimum of 4 months divergence between price and the AD line. With the AD line making a new all time high again last week, the end of this bull market and the start of a new bear market must be a minimum of 4 months away, which is the end of July 2019 at this time.
Last week the AD line makes another new all time high. Bullish mid-term divergence continues.
DAILY CHART
Click chart to enlarge. Chart courtesy of StockCharts.com. So that colour blind members are included, bearish signals
will be noted with blue and bullish signals with yellow.
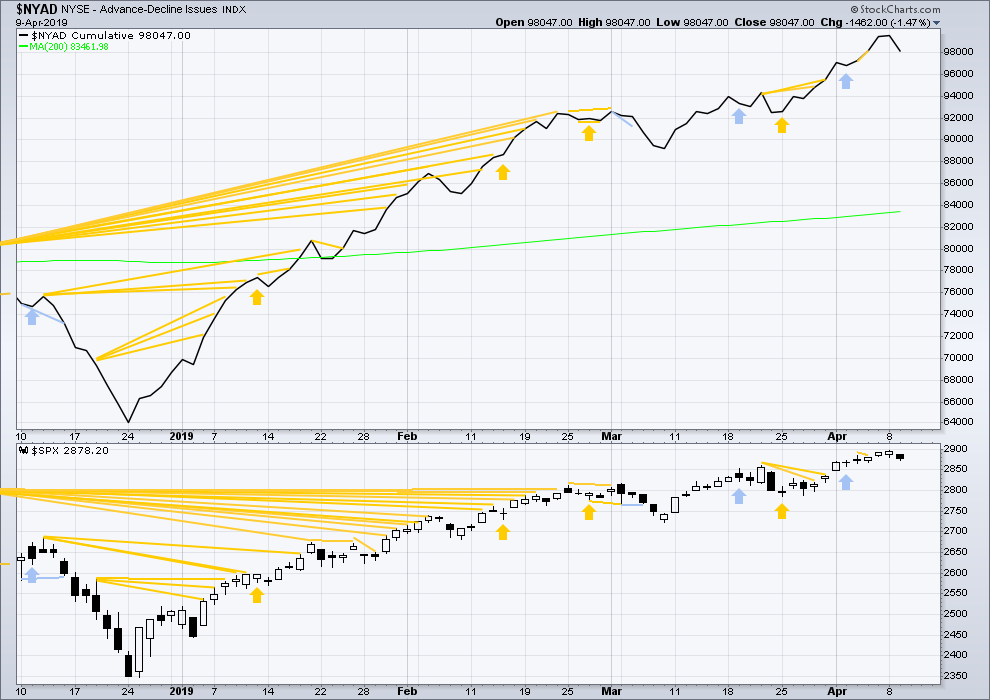
Breadth should be read as a leading indicator.
At the daily chart level, both the AD line and price make new short-term highs. There is no short-term divergence.
Today downwards movement comes with a decline in the AD line. This downwards movement has support from a decline in market breadth. There is no divergence.
VOLATILITY – INVERTED VIX CHART
WEEKLY CHART
Click chart to enlarge. Chart courtesy of StockCharts.com. So that colour blind members are included, bearish signals
will be noted with blue and bullish signals with yellow.
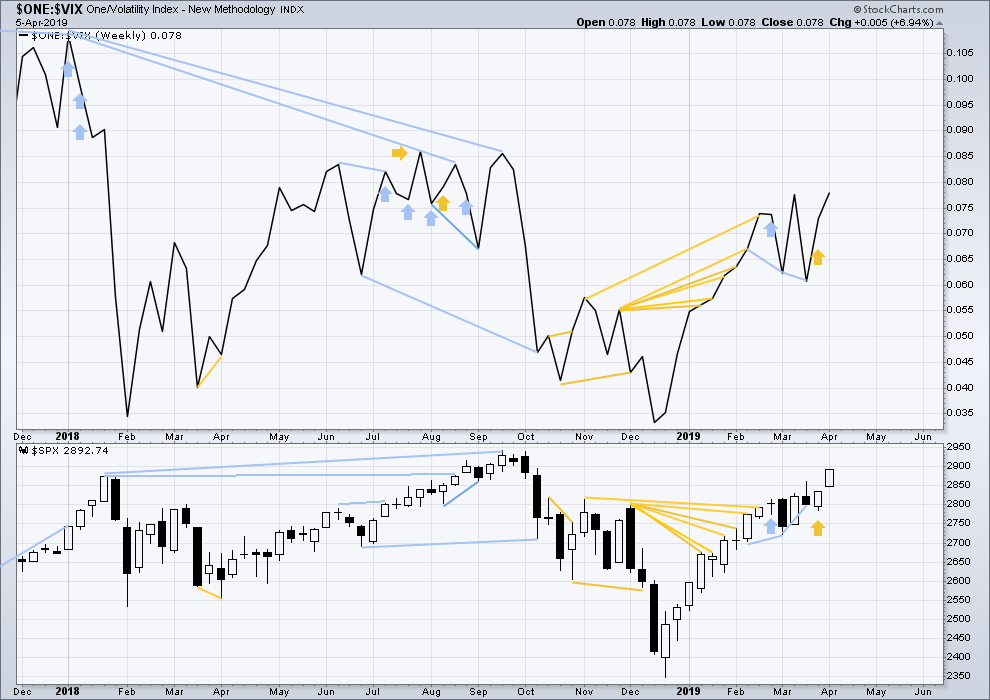
Last week both price and inverted VIX have moved higher. There is no mid or short-term divergence. Long-term divergence between all time highs remains.
DAILY CHART
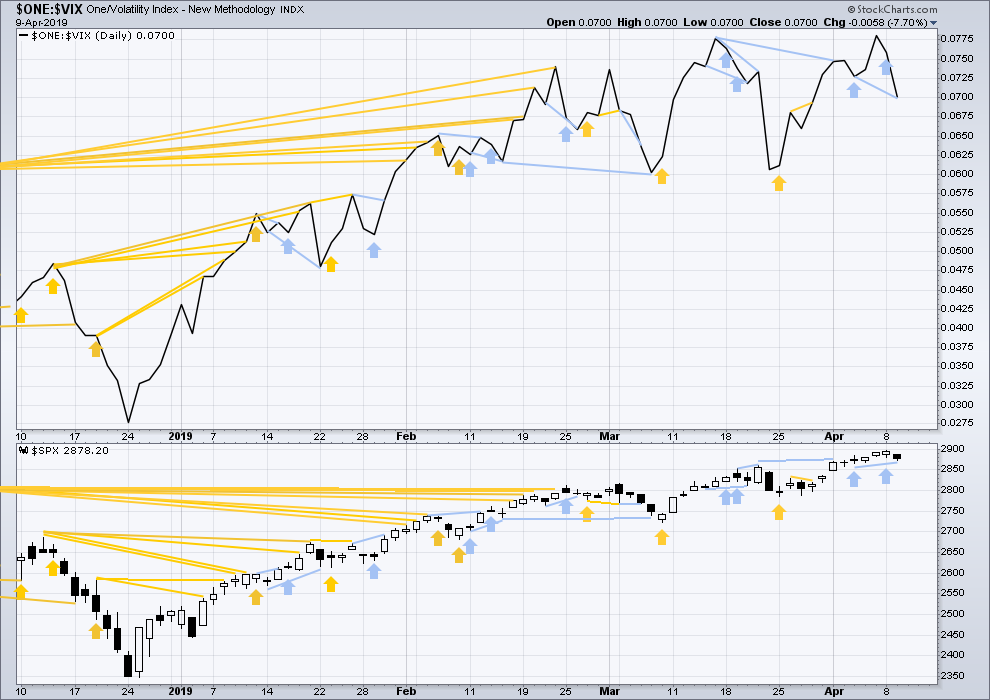
Click chart to enlarge. Chart courtesy of StockCharts.com. So that colour blind members are included, bearish signals
will be noted with blue and bullish signals with yellow.
Today both price and inverted VIX have moved lower. Inverted VIX has made a new low below the prior low of the 3rd of April, but price has not. VIX is rising faster than price is falling. This divergence is bearish for the short term.
DOW THEORY
Dow Theory confirmed a bear market in December 2018. This does not necessarily mean a bear market at Grand Super Cycle degree though; Dow Theory makes no comment on Elliott wave counts. On the 25th of August 2015 Dow Theory also confirmed a bear market. The Elliott wave count sees that as part of cycle wave II. After Dow Theory confirmation of a bear market in August 2015, price went on to make new all time highs and the bull market continued.
DJIA: 23,344.52 – a close on the 19th of December at 23,284.97 confirms a bear market.
DJT: 9,806.79 – price has closed below this point on the 13th of December.
S&P500: 2,532.69 – a close on the 19th of December at 2,506.96 provides support to a bear market conclusion.
Nasdaq: 6,630.67 – a close on the 19th of December at 6,618.86 provides support to a bear market conclusion.
With all the indices moving now higher, Dow Theory would confirm a bull market if the following highs are made:
DJIA: 26,951.81
DJT: 11,623.58
S&P500: 2,940.91
Nasdaq: 8,133.30.
For the short term, now DJT has made a very slight new low below the prior swing low of the 8th of March. All of the S&P500, DJIA and Nasdaq remain above their prior swing lows of the 8th of March.
Published @ 06:47 p.m. EST.
—
Careful risk management protects your trading account(s).
Follow my two Golden Rules:
1. Always trade with stops.
2. Risk only 1-5% of equity on any one trade.
When I look at the hourly chart above, I have a bit of a challenging time getting the idea. I’ve been using the 30 minute Heikin-Ashi chart to connect the dots. Lara’s notation still works just fine on this chart. Here is the chart showing the same timeframe that Lara is using in the above hourly chart, for a side by side comparison.
Okay, that was yesterday’s timeframe.
Here’s todays.
hmmm, then there’s this…
NDX has a fairly strong look on the hourly chart of being in a multi-day 5th wave ending diagonal. Close to complete. Along with that RUT is getting very close to a double top.
It could be an ascending triangle…
Hourly chart updated:
At this stage I’m going to label intermediate (4) a possible double zigzag. For alternation with the expanded flat of intermediate (2).
Labelling within intermediate (4) may well change as it continues. There are multiple structural options it may be.
If it’s a double zigzag, then minor X may be expected to be relatively shallow to minor W.
The sideways mess that is todays session I’m labelling minute b within minor X. This sure does look like a B wave.
At this stage I do not think intermediate (4) is over. To label it complete at yesterdays low would be way too brief.
Eeck!!! Right as I was getting a bit more excited about the upside. SPX finally has pushed through the 21 ema on the hourly, into the gap area, and hourly trend is back to “mild up”. Hmmm…..this is giving me a little pause to consider…
Is it possible the minor 4 was in fact over where you’ve marked the W down complete (as an expanding flat)? And now price is in a minor 5 up?
/_\ ….. or ugly triangle
SNAP pulled back today into support…. for any gamblers out there
Whoa, today at 2pm EST is a fed minutes release?!!!
Watch out. If it’s a consistent message…I’d guess it’s all priced in??? Still, there will be some turbulent action at the very least. And it might just kick off some 3 of 5 type high momentum upward action too.
I’m watching the 2885 level very carefully, I want to see the hourly chart get above it, which will also put price above the hourly 21 ema, which is a key level for SPX hourly action IMO.
The difference between RUT behavior today and all three of SPX, NDX and DJX is significant. Latter 3 flat to up 0.3%, RUT solid up at 1% and rising.
I’m seeing an ABC expanding flat off the late Friday high, myself. 3 down, 3 up, 5 down. Now complete. Which I would suspect completes the minor 4. No intermediate 4 down yet; price is now initiating a minor 5 up.
Maybe.
I am with you Kevin, the wave up was clearly 3 waves, i think we’ll top out in 2920s for I3 and I4 will re-test this breakout confluence area around 2880s before 3000s
I like it…
I think spy needs to get above 288.08 to confirm new wave up
Otherwise it’s showing a possible trend change short term down no?
If yesterday’s low gets violated, then the hourly chart polarity swaps to “down” (lower low, lower high, then lower low violated). My trend indicator at the hourly has been mild and for a few bars, strong) down for two days (it instantly moved from “up” to “mild down” on the opening gap down bar yesterday). But at the daily level, I have trend still mild up, and the weekly trend is strong up.
This kinda feels like a weekly
Options hold to me…
Hold up for today and drop after expiration today
Vix futures hanging in with push up
Got stopped out of LYFT at break even from last Trade profit Kevin
Nice eye …:)
Shouldn’t have reloaded ..:(
Got lucky on the one day bounce
Should have waited
I don’t know, still suspicious that yesterdays low was A of A-B-C with todays B wave looking more and more like an a-b-c up, with c as an ending diagonal. Thinking 2886 area and then a turn down for C towards Lara’s target.
1 or B?
That is the question. Looks corrective so far, lots of chop and overlap. Thinking B
#1 Spot