
The upwards trend was expected to continue this week and so far that is exactly what is happening. The Elliott wave target remains the same.
Summary: The upwards trend should continue. The mid-term Elliott wave target remains the same at 3,010 and the target calculated using the pennant pattern is at 2,956.
Today Lowry’s Selling Pressure has reached its lowest point yet for the entirety of this bull market, which began in March 2009. This strongly supports a bullish Elliott wave count.
The final target remains the same at 3,045.
New updates to this analysis are in bold.
The biggest picture, Grand Super Cycle analysis, is here.
Last published monthly charts are here. Video is here.
ELLIOTT WAVE COUNTS
WEEKLY CHART
Click chart to enlarge.
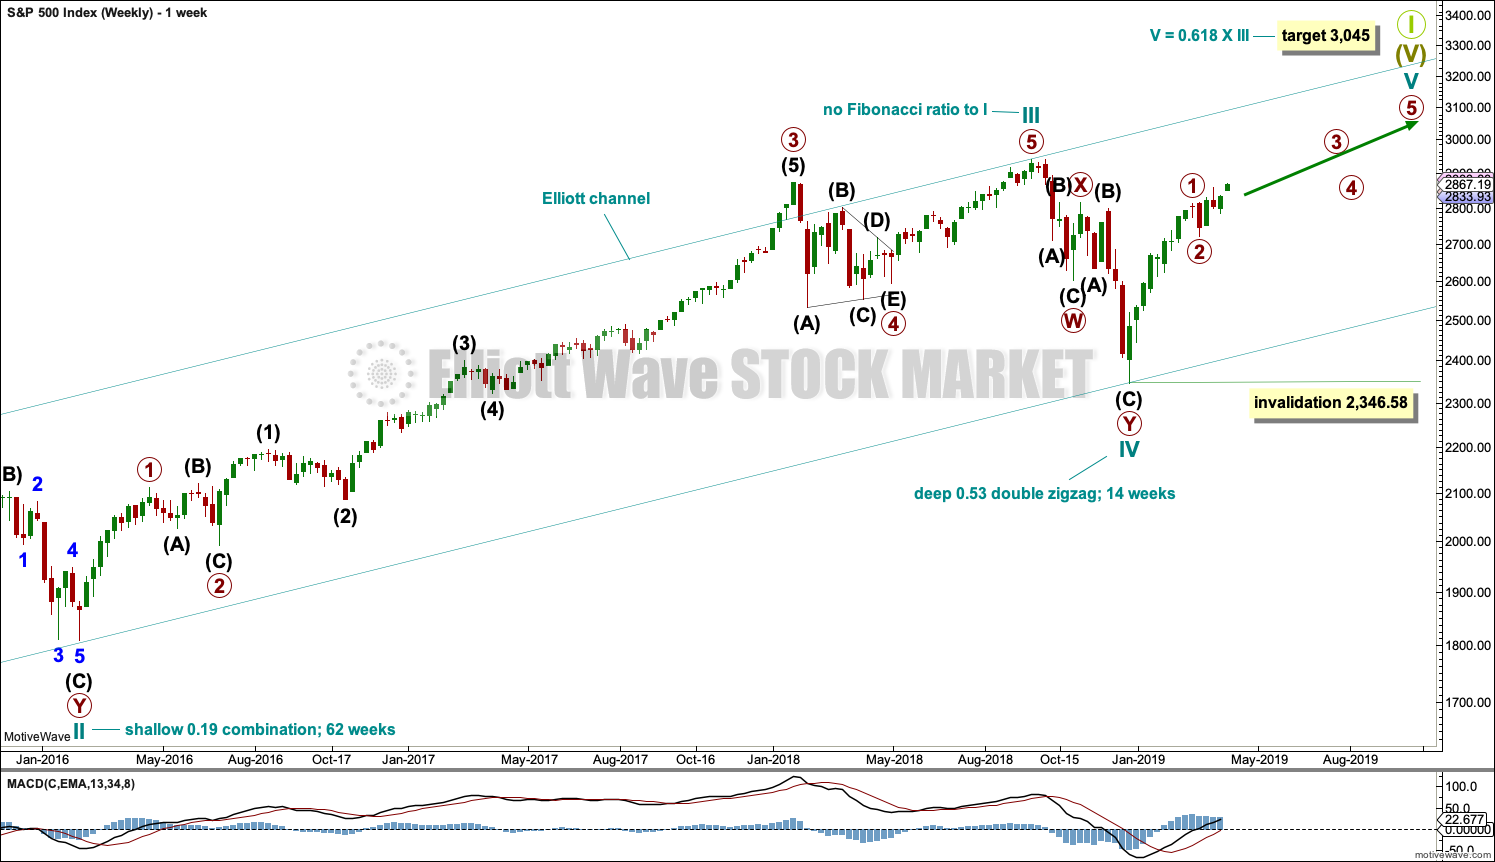
This weekly chart shows all of cycle waves III, IV and V so far.
Cycle wave II fits as a time consuming double combination: flat – X – zigzag. Combinations tend to be more time consuming corrective structures than zigzags. Cycle wave IV has completed as a multiple zigzag that should be expected to be more brief than cycle wave II.
Cycle wave IV may have ended at the lower edge of the Elliott channel.
Within cycle wave V, no second wave correction may move beyond the start of its first wave below 2,346.58.
Although both cycle waves II and IV are labelled W-X-Y, they are different corrective structures. There are two broad groups of Elliott wave corrective structures: the zigzag family, which are sharp corrections, and all the rest, which are sideways corrections. Multiple zigzags belong to the zigzag family and combinations belong to the sideways family. There is perfect alternation between the possible double zigzag of cycle wave IV and the combination of cycle wave II.
Although there is gross disproportion between the duration of cycle waves II and IV, the size of cycle wave IV in terms of price makes these two corrections look like they should be labelled at the same degree. Proportion is a function of either or both of price and time.
Draw the Elliott channel about Super Cycle wave (V) with the first trend line from the end of cycle wave I (at 2,079.46 on the week beginning 30th November 2014) to the high of cycle wave III, then place a parallel copy on the low of cycle wave II. Cycle wave V may find resistance about the upper edge.
It is possible that cycle wave V may end in October 2019. If it does not end there, or if the AD line makes new all time highs during or after June 2019, then the expectation for cycle wave V to end would be pushed out to March 2020 as the next possibility. Thereafter, the next possibility may be October 2020. March and October are considered as likely months for a bull market to end as in the past they have been popular. That does not mean though that this bull market may not end during any other month.
MAIN WAVE COUNT
DAILY CHART
Click chart to enlarge.
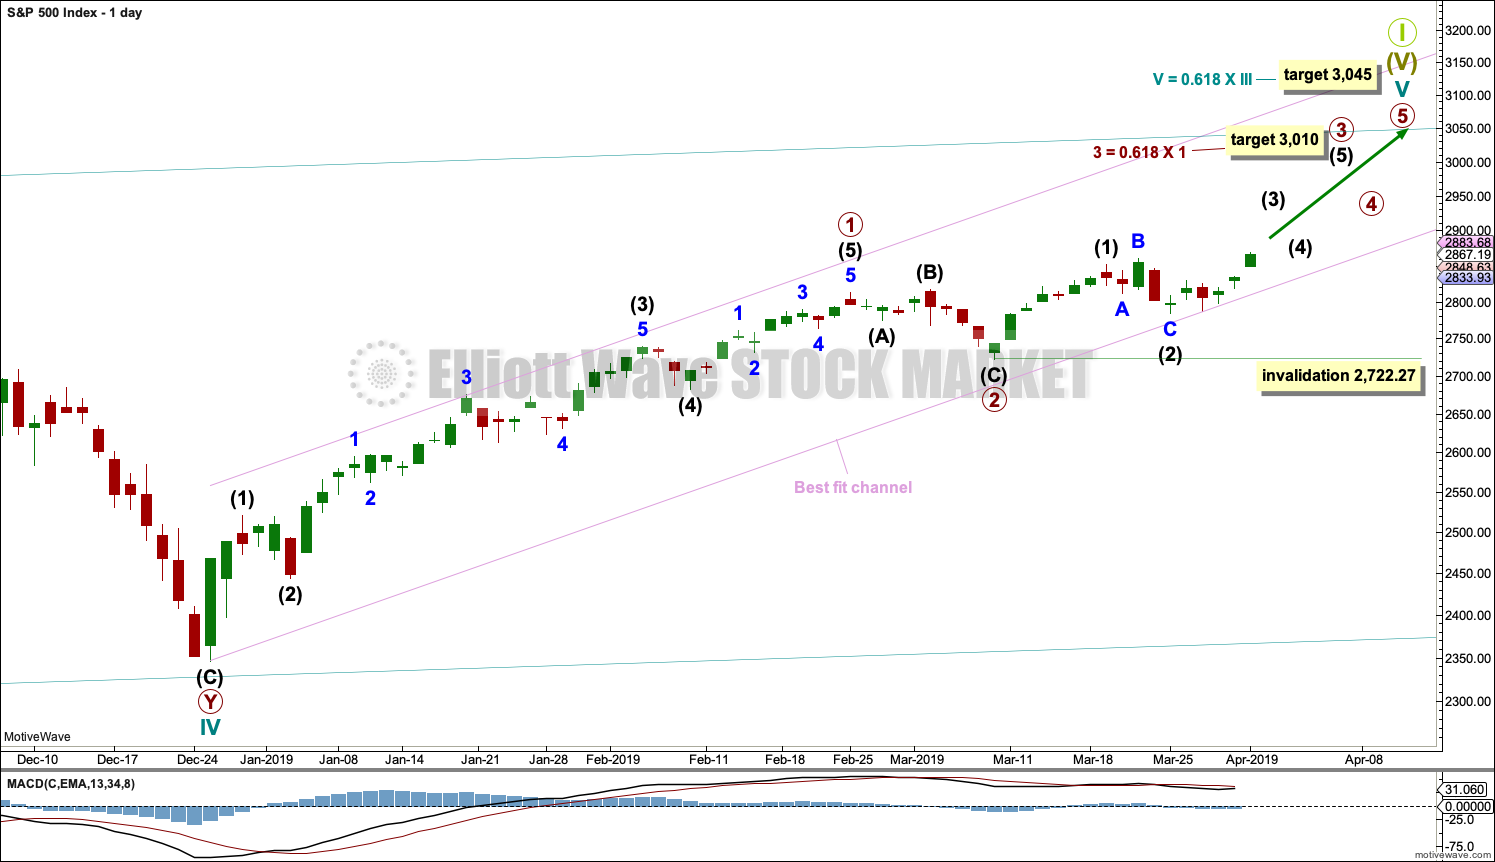
The daily chart will focus on the structure of cycle wave V.
Within Super Cycle wave (V), cycle wave III may not be the shortest actionary wave. Because cycle wave III is shorter than cycle wave I, this limits cycle wave V to no longer than equality in length with cycle wave III at 3,477.39. A target is calculated for cycle wave V to end prior to this point.
However, members are reminded that there is an alternate monthly wave count that does not have a limit to upwards movement. There is a link to it at the start of each analysis.
Cycle wave V must subdivide as a five wave motive structure, either an impulse or an ending diagonal. An impulse is much more common and that will be how it is labelled. A diagonal would be considered if overlapping suggests it.
Primary wave 2 may have been a very brief and shallow expanded flat correction.
Primary wave 3 may now exhibit an increase in upwards momentum. A target is calculated that fits with the higher target for cycle wave V to end.
Within primary wave 3, intermediate wave (2) may not move beyond the start of intermediate wave (1) below 2,722.27.
Intermediate wave (2) may be a complete expanded flat correction. Minor wave B within intermediate wave (2) is 1.2 times the length of minor wave A, which is within the most common range for B waves of flats from 1 to 1.38. Minor wave C may now be complete. It exhibits no Fibonacci ratio to minor wave A.
The channel is adjusted to better show where current small pullbacks are finding support.
HOURLY CHART
Click chart to enlarge.
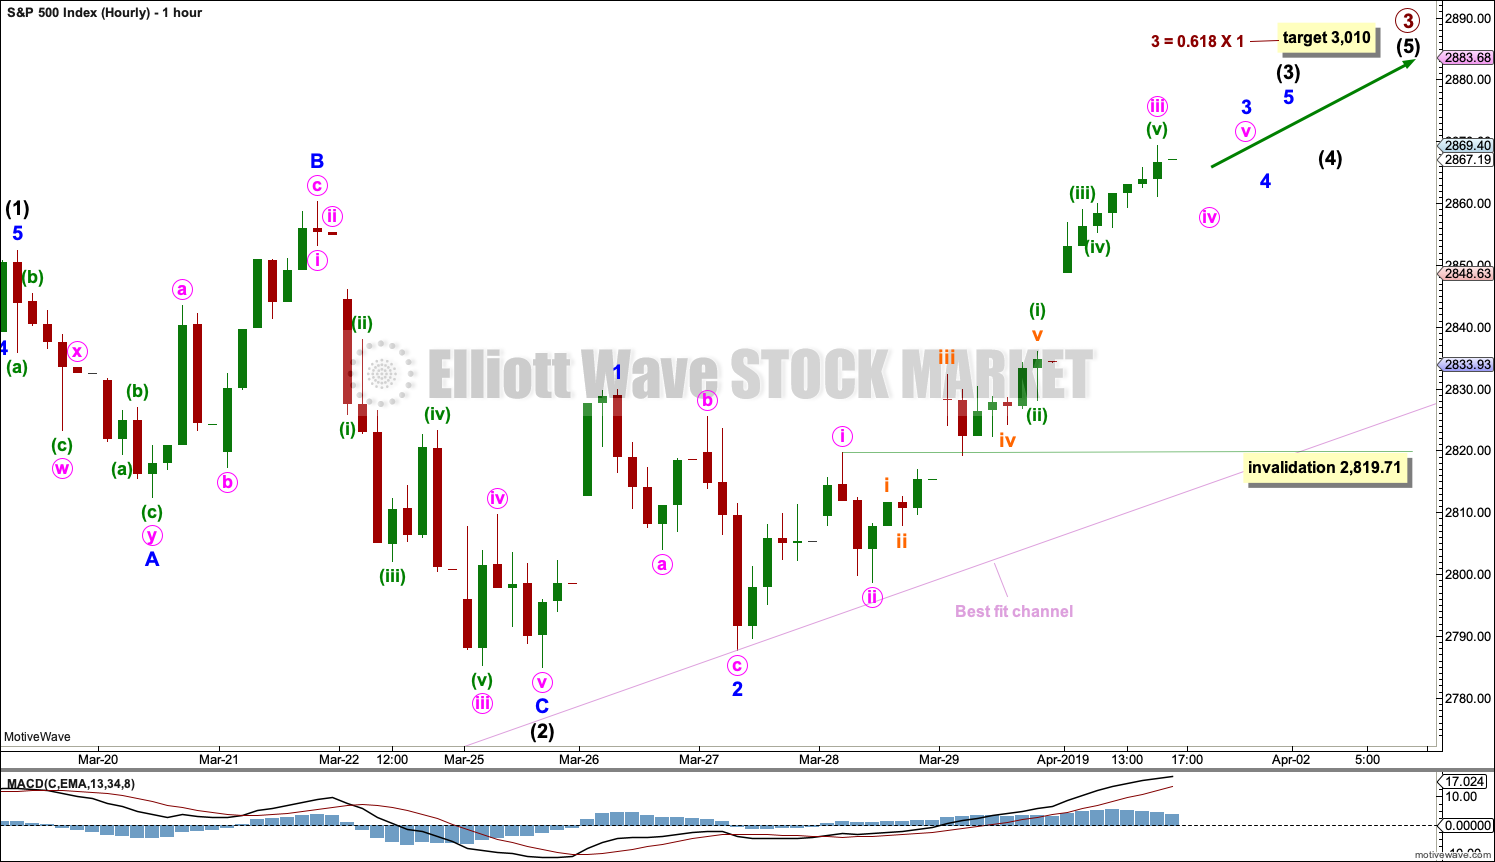
Intermediate wave (2) may be now complete.
Intermediate wave (3) has now moved above the end of intermediate wave (1) meeting a core Elliott wave rule.
All of waves primary wave 3, intermediate wave (3), minor wave 3, minute wave iii and minuette wave (iii) must subdivide as impulses. This wave count now expects a third wave up at five degrees to continue. If labelling here at the hourly chart level is wrong, it may be in prematurely labelling the middle of this third wave complete today. This labelling may need to be moved down one degree; the middle of this third wave may still be ahead.
Within the current impulse upwards, minute wave iv may not move into minute wave i price territory below 2,819.71.
Today, because of a new high, the alternate wave count is discarded.
TECHNICAL ANALYSIS
WEEKLY CHART

Click chart to enlarge. Chart courtesy of et=”_blank”>StockCharts.com.
The last completed week is an outside week that closes green with the balance of volume upwards. Volume within last week does not appear to support upwards movement, but a clearer picture may be obtained by looking inside last week’s daily volume bars.
The close for last week is near highs, suggesting more upwards movement to follow.
DAILY CHART
Click chart to enlarge. Chart courtesy of StockCharts.com.
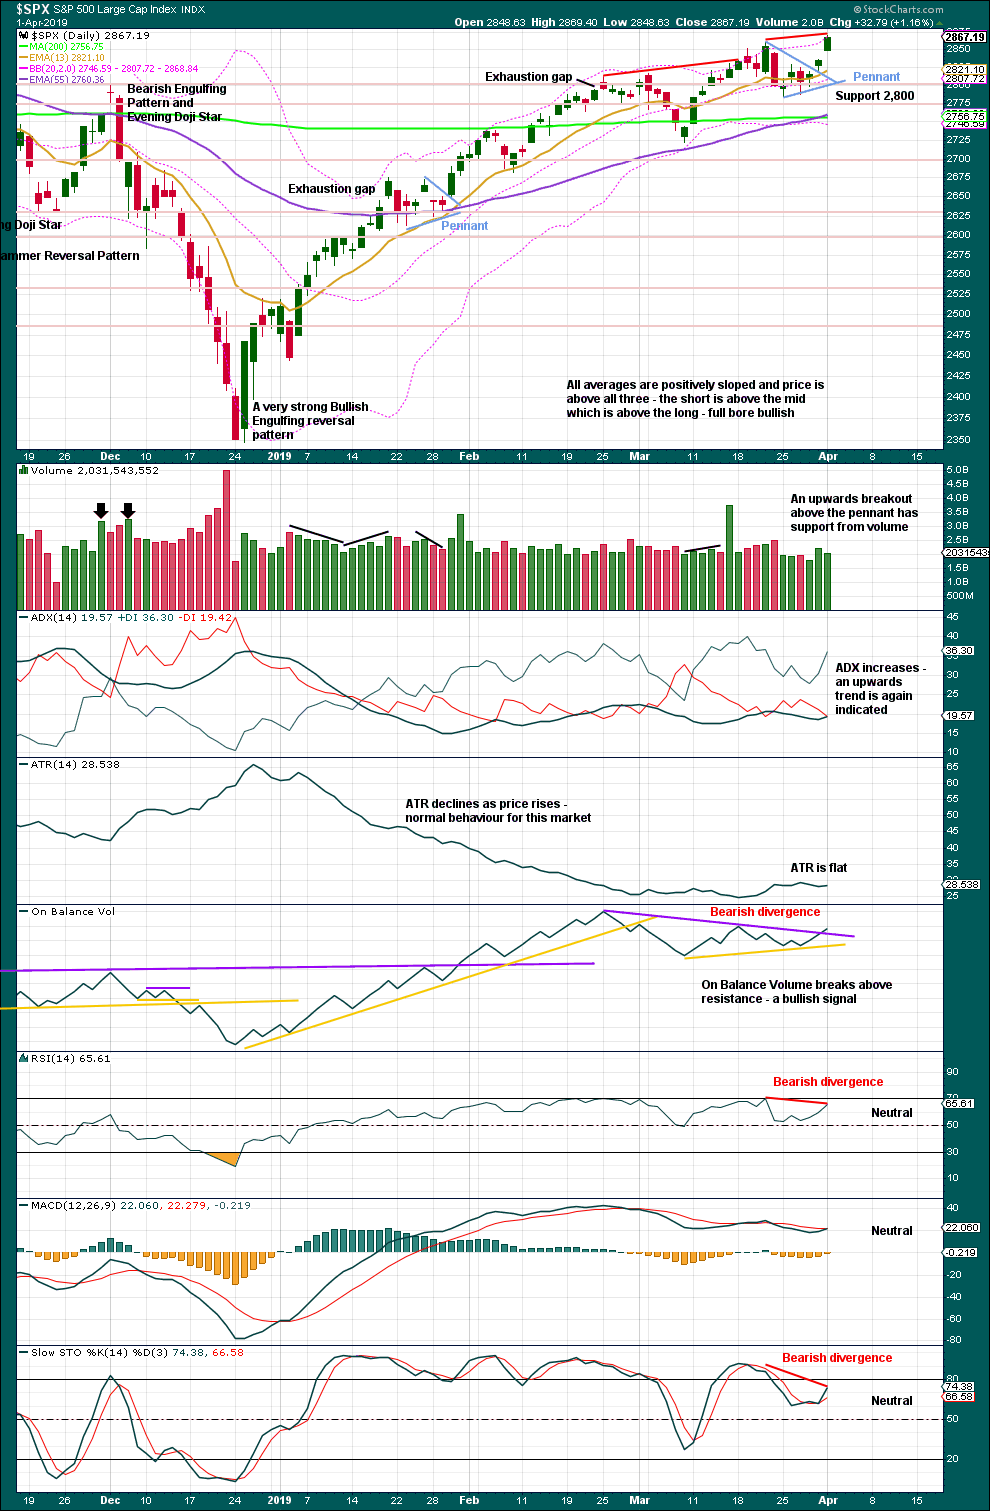
The December 2018 low is expected to remain intact. The two 90% upwards days on 26th December 2018 and 6th January 2019 indicate this upwards trend has internal strength.
Lowry’s data shows Selling Pressure has today reached its lowest point for the entirety of this bull market, which began back in March 2009. This is very bullish and supports the Elliott wave count.
While the last swing low of the 8th of March remains intact, there exists a series of higher highs and higher lows from the major low in December 2018. It would be safest to assume the upwards trend remains intact. Today ADX again agrees.
The pennant pattern is a reliable short-term continuation pattern. Friday may have seen an upwards breakout that has the necessary support from volume for confidence. A target calculated using the flag pole is about 2,956.
A slight decline in volume today is not concerning given current market conditions. It has been noted for a long time now that price has been rising on light and declining volume. This appears to now be a feature of this ageing bull market.
Likewise, some single divergence today between the new high for price and both of RSI and Stochastics is of little concern. This may simply disappear. Single divergence is not particularly reliable.
The gap upwards today may be a breakaway gap. These are not usually closed for some time. It may be used as an area of support; the lower edge is at 2,836.03.
BREADTH – AD LINE
WEEKLY CHART
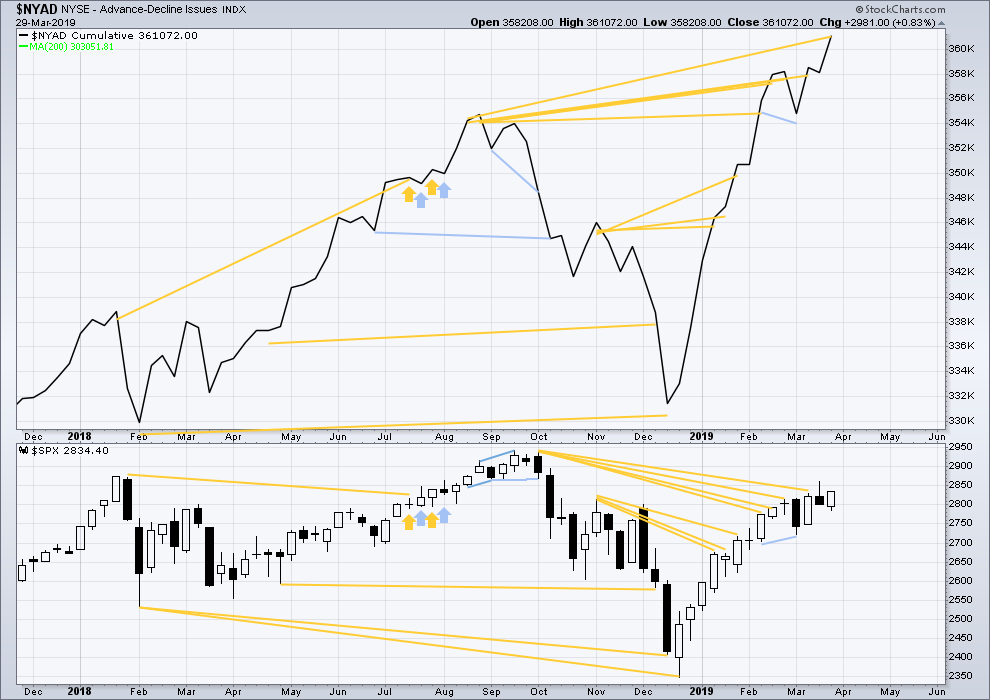
Click chart to enlarge. Chart courtesy of StockCharts.com. So that colour blind members are included, bearish signals
will be noted with blue and bullish signals with yellow.
Every single bear market from the Great Depression and onwards has been preceded by a minimum of 4 months divergence between price and the AD line. With the AD line making a new all time high again last week, the end of this bull market and the start of a new bear market must be a minimum of 4 months away, which is the end of July 2019 at this time.
Last week the AD line makes another new all time high. Bullish mid-term divergence continues.
DAILY CHART
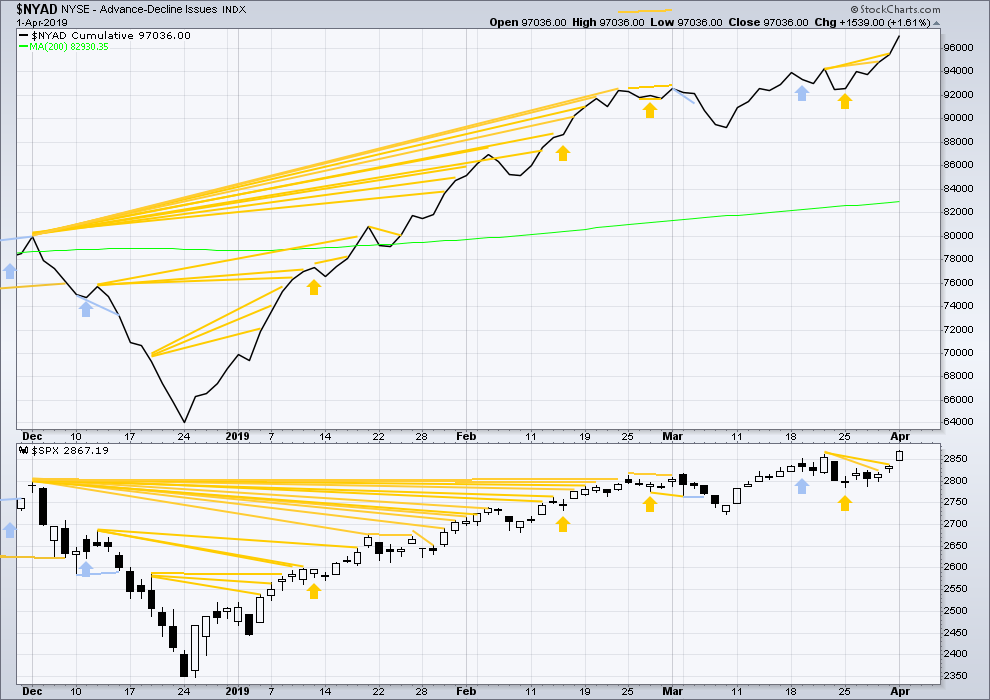
Click chart to enlarge. Chart courtesy of StockCharts.com. So that colour blind members are included, bearish signals
will be noted with blue and bullish signals with yellow.
Breadth should be read as a leading indicator.
Bullish divergence noted in last analysis has been followed by upwards movement. Today both the AD line and price have made new short-term highs. There is no longer any short-term divergence. Upwards movement has good support from rising market breadth; this is bullish.
More weight today is given to bullish support from the AD line than to bearish divergence with VIX. The AD line has been more reliable as an indicator for some time now.
VOLATILITY – INVERTED VIX CHART
WEEKLY CHART
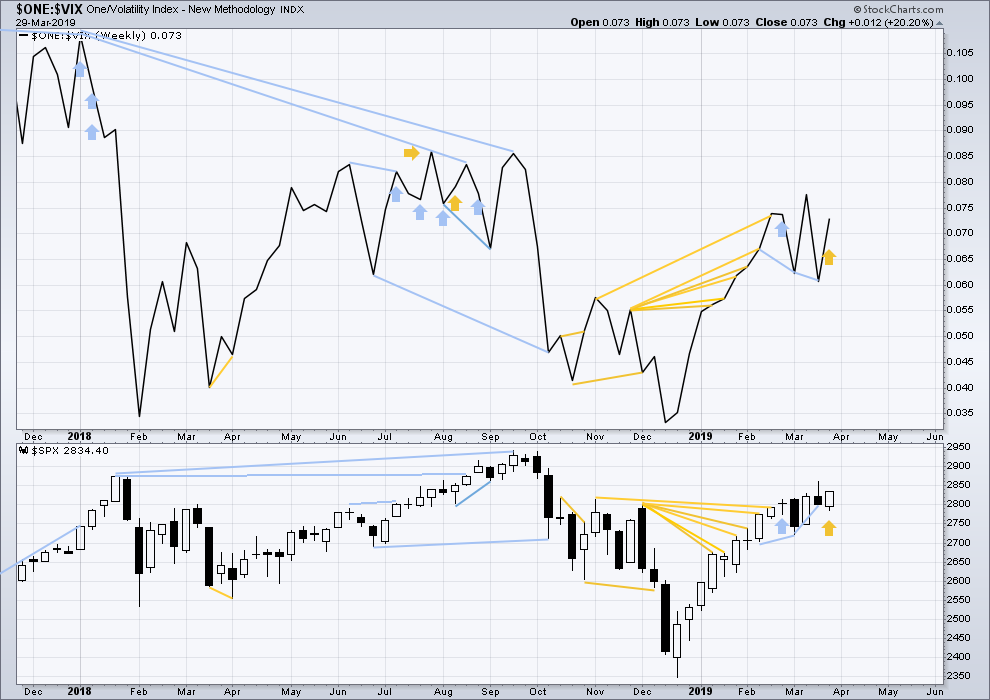
Click chart to enlarge. Chart courtesy of StockCharts.com. So that colour blind members are included, bearish signals
will be noted with blue and bullish signals with yellow.
Last week price moved lower with a lower low and a lower high, but inverted VIX moved higher. This divergence is bullish for the short term.
DAILY CHART
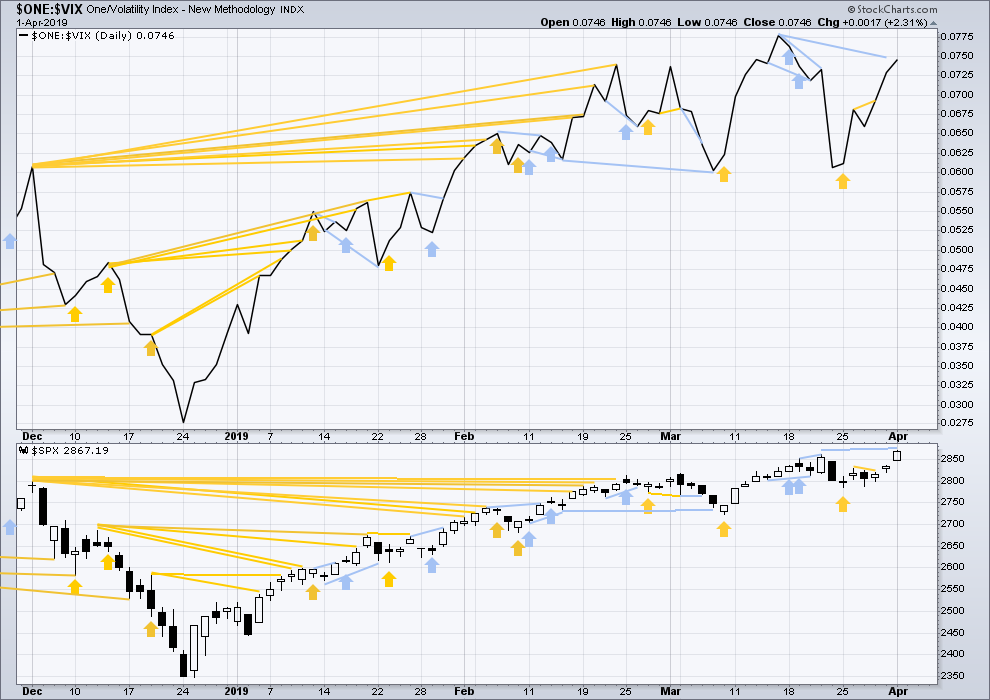
Click chart to enlarge. Chart courtesy of StockCharts.com. So that colour blind members are included, bearish signals
will be noted with blue and bullish signals with yellow.
Today price has made a new short-term swing high, but inverted VIX has not. This divergence is bearish for the short term.
DOW THEORY
Dow Theory confirmed a bear market in December 2018. This does not necessarily mean a bear market at Grand Super Cycle degree though; Dow Theory makes no comment on Elliott wave counts. On the 25th of August 2015 Dow Theory also confirmed a bear market. The Elliott wave count sees that as part of cycle wave II. After Dow Theory confirmation of a bear market in August 2015, price went on to make new all time highs and the bull market continued.
DJIA: 23,344.52 – a close on the 19th of December at 23,284.97 confirms a bear market.
DJT: 9,806.79 – price has closed below this point on the 13th of December.
S&P500: 2,532.69 – a close on the 19th of December at 2,506.96 provides support to a bear market conclusion.
Nasdaq: 6,630.67 – a close on the 19th of December at 6,618.86 provides support to a bear market conclusion.
With all the indices moving now higher, Dow Theory would confirm a bull market if the following highs are made:
DJIA: 26,951.81
DJT: 11,623.58
S&P500: 2,940.91
Nasdaq: 8,133.30.
For the short term, now DJT has made a very slight new low below the prior swing low of the 8th of March. All of the S&P500, DJIA and Nasdaq remain above their prior swing lows of the 8th of March.
Published @ 07:07 p.m. EST.
—
Careful risk management protects your trading account(s).
Follow my two Golden Rules:
1. Always trade with stops.
2. Risk only 1-5% of equity on any one trade.
SPX 2884 has a mountain of fibonacci levels => highly likely resistance/swing price level.
Meanwhile NDX has swing high resistance just overhead at 7505 (much closer than in SPX).
Hourly chart update:
The small pullback today so far looks like a fourth wave.
The degree of labelling may be as on this chart, or the degree may be moved down one within minor wave 3. It may be only minute wave i near an end today. That is a decision I’ll have to make in the next few days.
What that means is it is possible that the middle of a third wave has either passed, or is just ahead. The invalidation point is the same.
So Sorry Lara, if we caused you to work your fingers to the bone
All that typing.
So hard 🙂
Courtesy of a moments inattention, I have a Fat Finger today.
Are you guys sure we should let me anywhere near the markets tomorrow?
Sorry to see that. I noted it was April 2nd and not the 1st when you posted this. So it is not an April Fool’s joke. Sorry. I hope it heals well.
Why don’t you just take the day off. You have not done that in a while and you didn’t get a proper time off for a holiday at Christmas either. I think now is as good a time as any to take a week off.
Knife? Hammer? Dog bite?
Or worse…a new technical indicator?
A new meaning to bloody damn good research.
Love the flesh colored tape 🙂
Heal well!
LOL
I’m fine, it is but a flesh wound. Nothing a good cup of tea won’t sort out.
It was a car door. I do not recommend putting a finger in a car door.
For April fool’s day:
https://www.businessinsider.com.au/holy-crap-its-a-black-swan-formation-2009-1
Funny. Is it time to go short or to drop my shorts?
When your in that place Rodney
Sell upside calls a little out of the money on short time frames after s big run
I sold some 287-288 spy spreads for Wednesday and added to my 29-28 vxxb sold put spreads
They usually skim the greed pretty well I’ve found
Market might now move enough to make shorts happy
But they won’t let Late calls buyers make $
Scott, thanks for the treading advice. But I just went ahead and dropped my shorts. Unfortunately my neighbors didn’t think it was very funny either. But in the end they got it; the rear end that is.
Here in SF no one notices if you drop your shorts…so I closed my primary longs (I also have sold puts on various equities I’m obviously holding) right on open and took a very small short (RUT via IWM puts) myself. Time for at least a little backing and filling I think.
Adv/Dec #’s on all markets are on the middlin’ to weak side.
Lol
I closed as well
On the push down
Little profits taken
Feels like one more push up
And I’ve been happy scalping