
An outside day for Friday closes green as the S&P500 ends with a little strength into the close. This is what the main Elliott wave count has expected, and it now has support from classic technical analysis this week.
Summary: The upwards trend should resume. The mid-term target remains the same at 3,010. Today this view has support from a new all time high from the AD line and a cross of the 50 day moving average above the 200 day moving average.
The final target remains the same at 3,045.
Only a new low below 2,722.27 would indicate a deeper and more sustained pullback would be underway.
New updates to this analysis are in bold.
The biggest picture, Grand Super Cycle analysis, is here.
Last published monthly charts are here. Video is here.
ELLIOTT WAVE COUNTS
WEEKLY CHART
Click chart to enlarge.
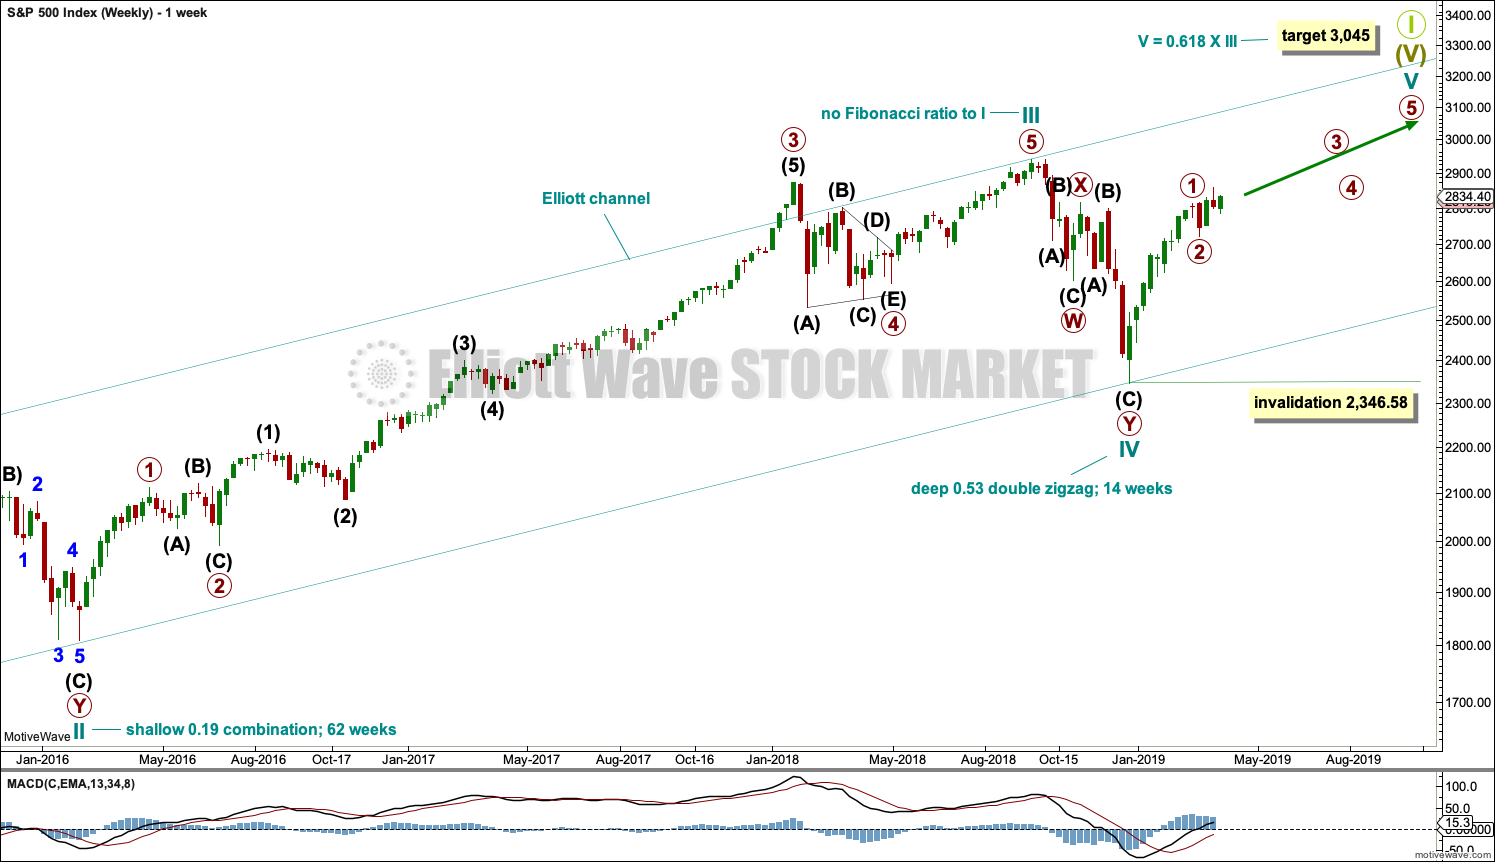
This weekly chart shows all of cycle waves III, IV and V so far.
Cycle wave II fits as a time consuming double combination: flat – X – zigzag. Combinations tend to be more time consuming corrective structures than zigzags. Cycle wave IV has completed as a multiple zigzag that should be expected to be more brief than cycle wave II.
Cycle wave IV may have ended at the lower edge of the Elliott channel.
Within cycle wave V, no second wave correction may move beyond the start of its first wave below 2,346.58.
Although both cycle waves II and IV are labelled W-X-Y, they are different corrective structures. There are two broad groups of Elliott wave corrective structures: the zigzag family, which are sharp corrections, and all the rest, which are sideways corrections. Multiple zigzags belong to the zigzag family and combinations belong to the sideways family. There is perfect alternation between the possible double zigzag of cycle wave IV and the combination of cycle wave II.
Although there is gross disproportion between the duration of cycle waves II and IV, the size of cycle wave IV in terms of price makes these two corrections look like they should be labelled at the same degree. Proportion is a function of either or both of price and time.
Draw the Elliott channel about Super Cycle wave (V) with the first trend line from the end of cycle wave I (at 2,079.46 on the week beginning 30th November 2014) to the high of cycle wave III, then place a parallel copy on the low of cycle wave II. Cycle wave V may find resistance about the upper edge.
It is possible that cycle wave V may end in October 2019. If it does not end there, or if the AD line makes new all time highs during or after June 2019, then the expectation for cycle wave V to end would be pushed out to March 2020 as the next possibility. Thereafter, the next possibility may be October 2020. March and October are considered as likely months for a bull market to end as in the past they have been popular. That does not mean though that this bull market may not end during any other month.
MAIN WAVE COUNT
DAILY CHART
Click chart to enlarge.
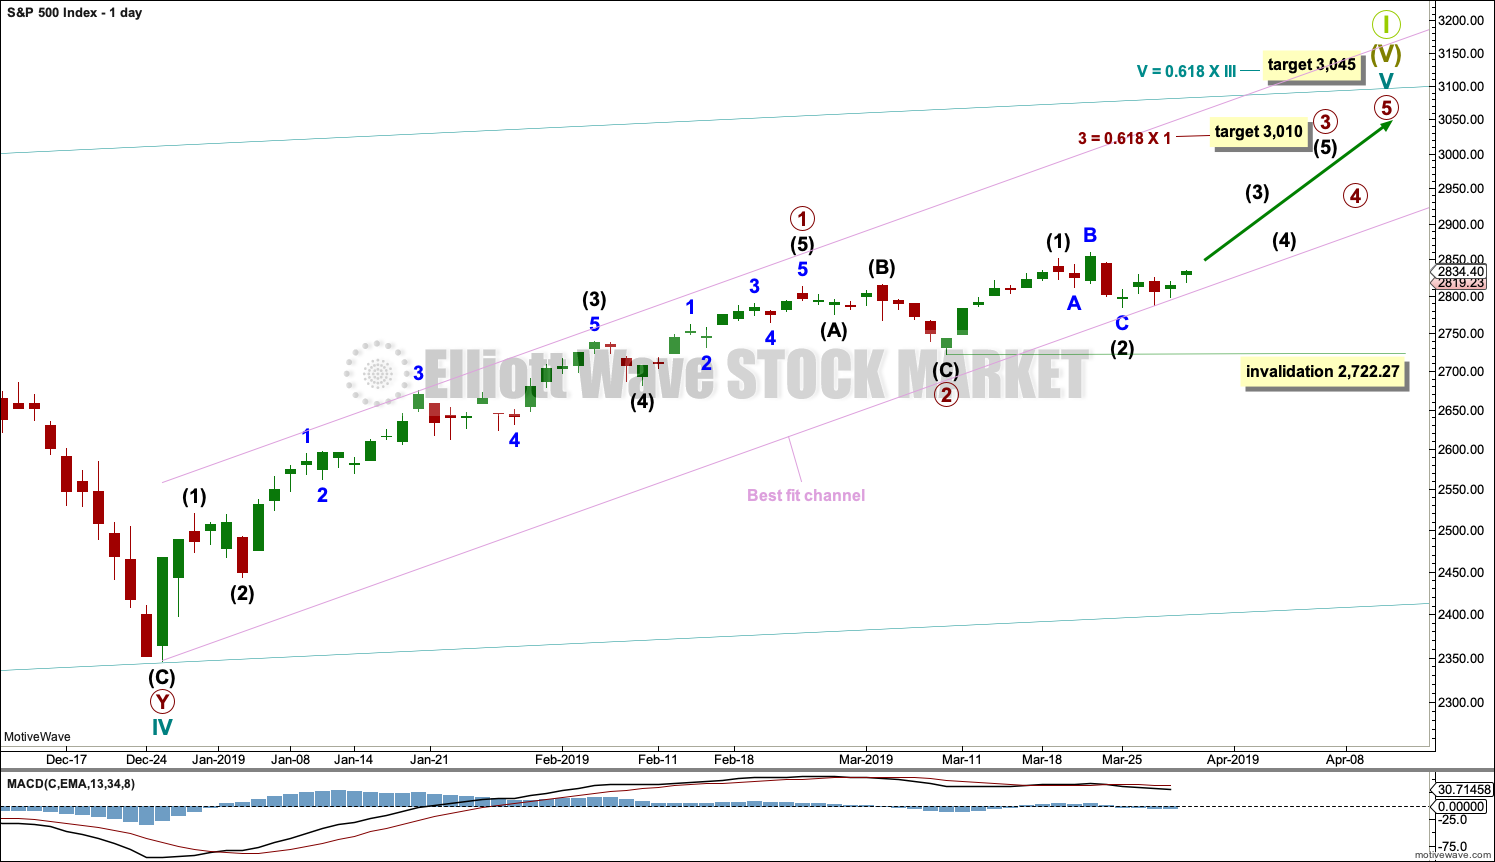
The daily chart will focus on the structure of cycle wave V.
Within Super Cycle wave (V), cycle wave III may not be the shortest actionary wave. Because cycle wave III is shorter than cycle wave I, this limits cycle wave V to no longer than equality in length with cycle wave III at 3,477.39. A target is calculated for cycle wave V to end prior to this point.
Cycle wave V must subdivide as a five wave motive structure, either an impulse or an ending diagonal. An impulse is much more common and that will be how it is labelled. A diagonal would be considered if overlapping suggests it.
Primary wave 2 may have been a very brief and shallow expanded flat correction.
Primary wave 3 may now exhibit an increase in upwards momentum. A target is calculated that fits with the higher target for cycle wave V to end.
Within primary wave 3, intermediate wave (2) may not move beyond the start of intermediate wave (1) below 2,722.27.
Intermediate wave (2) may be a complete expanded flat correction. Minor wave B within intermediate wave (2) is 1.2 times the length of minor wave A, which is within the most common range for B waves of flats from 1 to 1.38. Minor wave C may now be complete. It exhibits no Fibonacci ratio to minor wave A.
The channel is adjusted to better show where current small pullbacks are finding support.
HOURLY CHART
Click chart to enlarge.
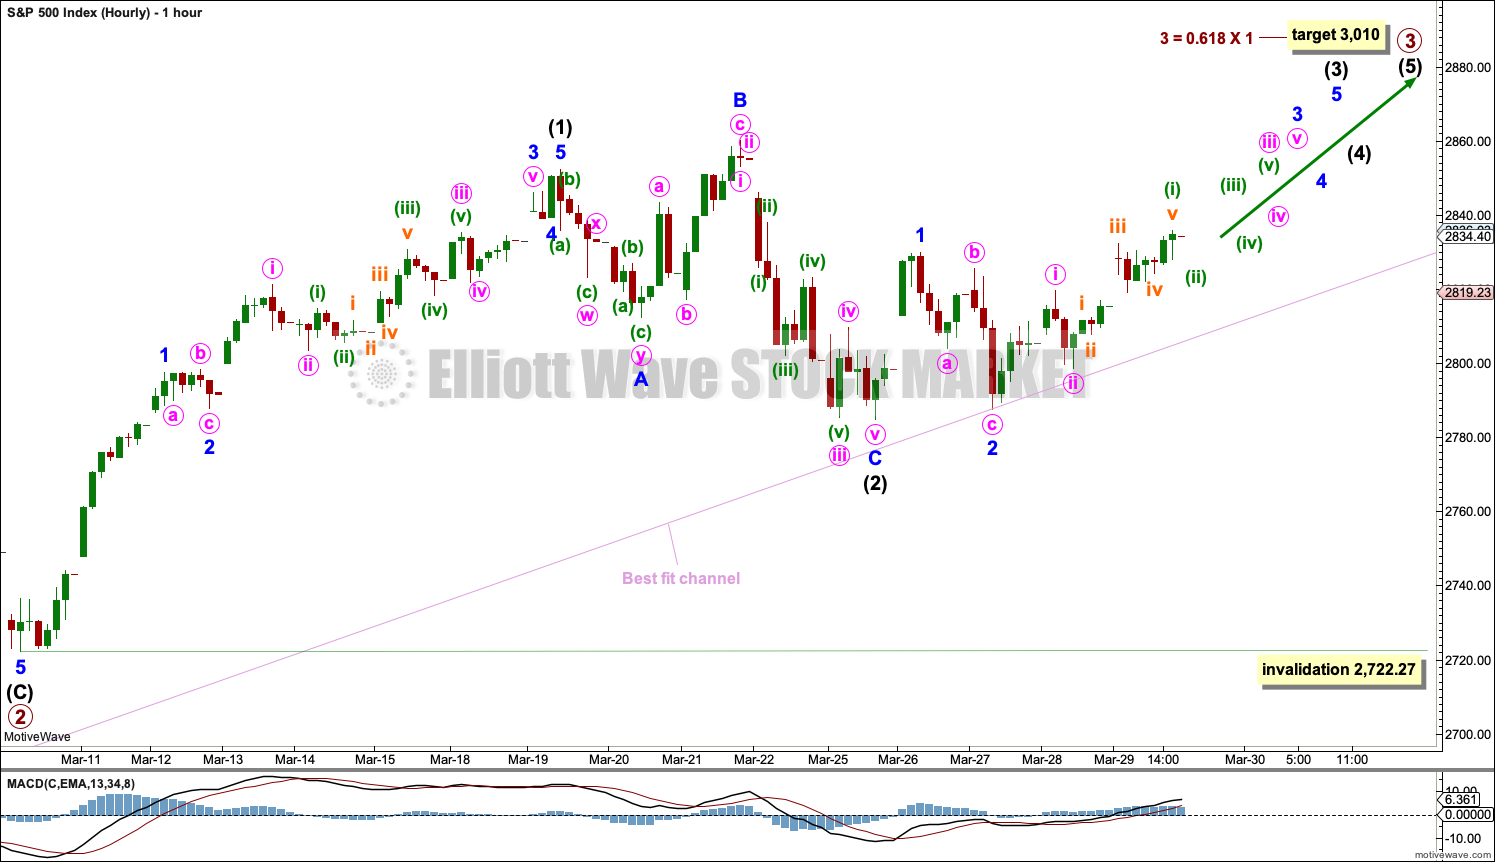
Intermediate wave (2) may be now complete.
However, until price has made a new high above the end of intermediate wave (1) the invalidation point must remain the same. It will remain possible that intermediate wave (2) may be incomplete and may continue sideways or lower. Intermediate wave (2) may not move beyond the start of intermediate wave (1) below 2,722.27.
Intermediate wave (3) must move above the end of intermediate wave (1).
All of waves primary wave 3, intermediate wave (3), minor wave 3, minute wave iii and minuette wave (iii) must subdivide as impulses. This wave count now expects a third wave up at five degrees next week. An increase in upwards momentum may be expected.
ALTERNATE WAVE COUNT
DAILY CHART
Click chart to enlarge.
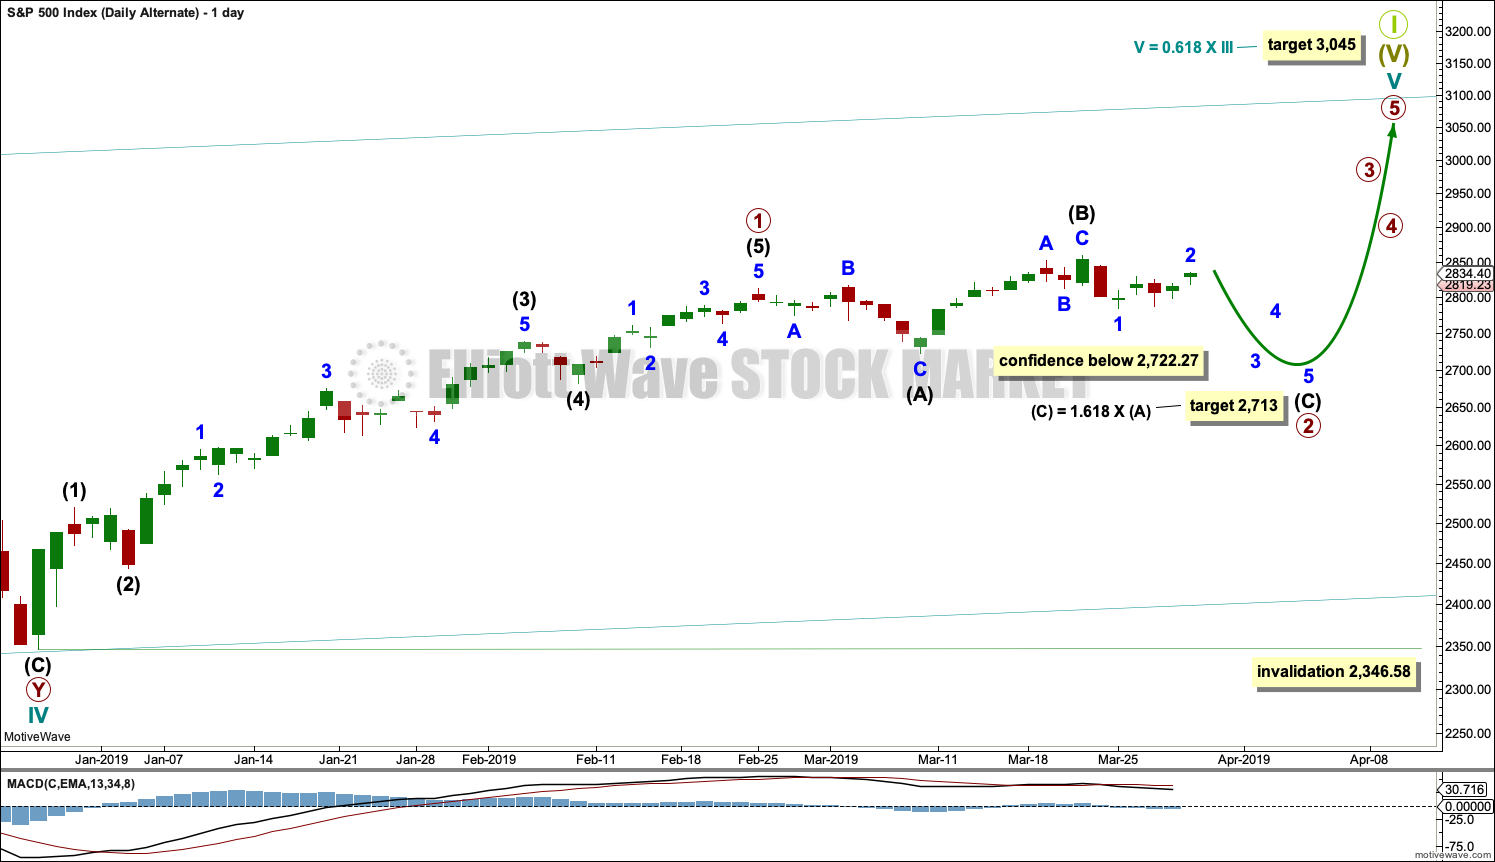
It is also possible that primary wave 2 may continue as an expanded flat correction.
Intermediate wave (B) is 1.51 times the length of intermediate wave (A). This is longer than the common range of 1 to 1.38 but within allowable limits of up to 2.
A target is calculated for intermediate wave (C); it expects to exhibit the most common Fibonacci ratio to intermediate wave (A).
Intermediate wave (C) must subdivide as a five wave motive structure. Within intermediate wave (C), minor wave 2 may not move beyond the start of minor wave 1 above 2,860.31. This wave count would be discarded with a new high.
Primary wave 2 may not move beyond the start of primary wave 1 below 2,346.58.
The breach of the channel on the main daily Elliott wave chart indicates this alternate should now be more seriously considered.
TECHNICAL ANALYSIS
WEEKLY CHART

Click chart to enlarge. Chart courtesy of et=”_blank”>StockCharts.com.
The last completed week is an outside week that closes green with the balance of volume upwards. Volume within the week does not appear to support upwards movement, but a clearer picture may be obtained by looking inside the week at daily volume bars.
The close for the week is near highs, suggesting more upwards movement to follow.
DAILY CHART
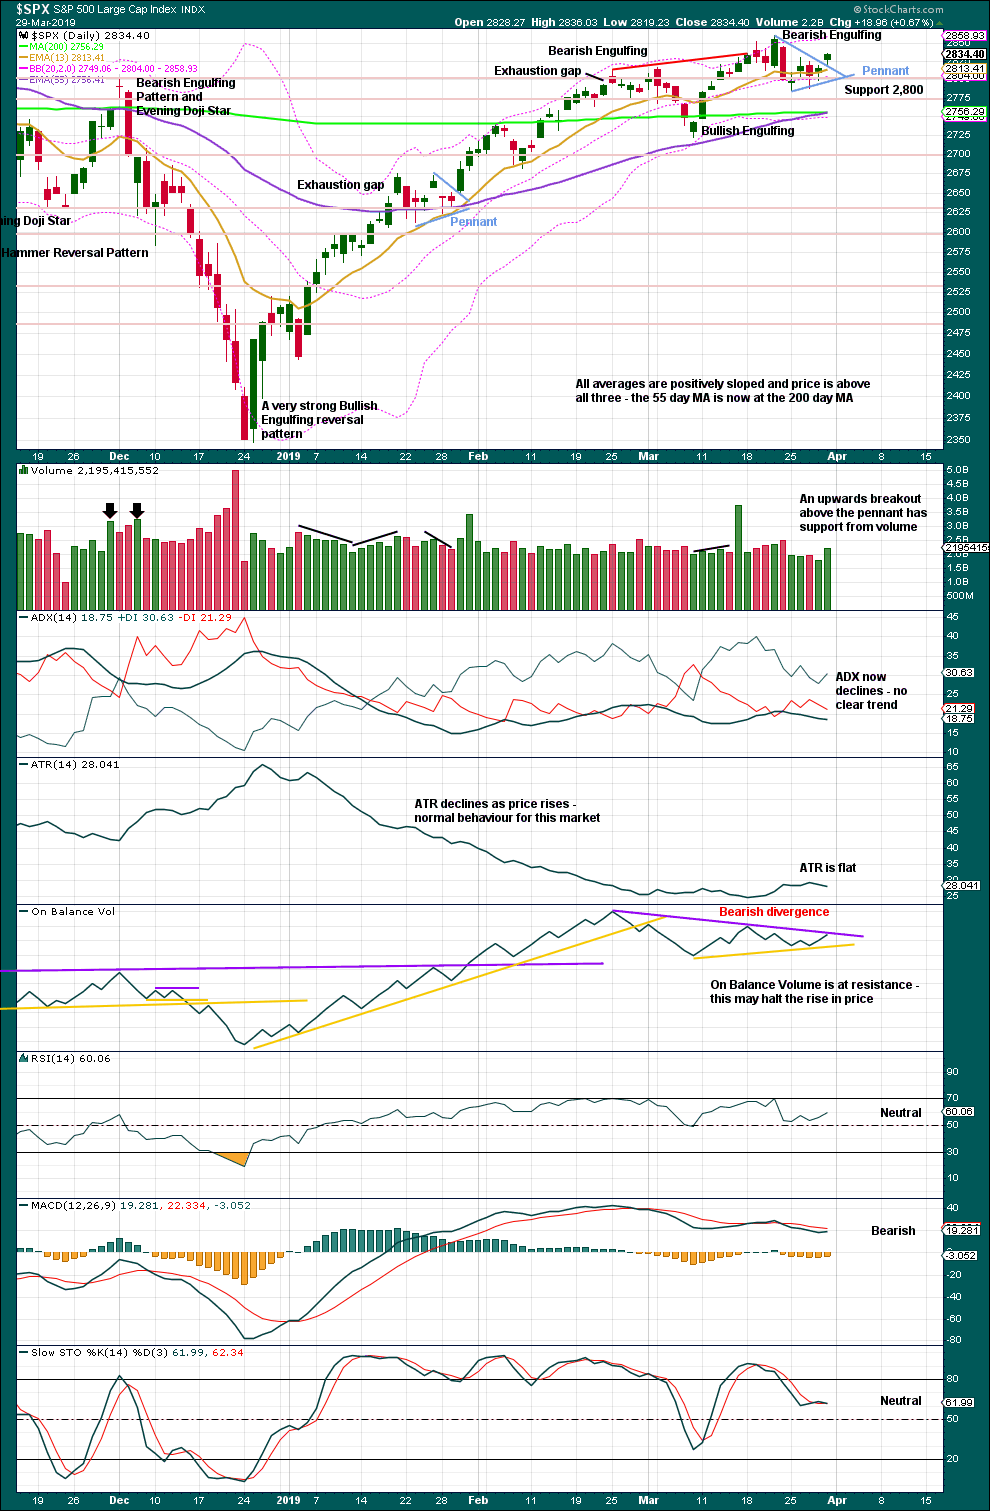
Click chart to enlarge. Chart courtesy of StockCharts.com.
The December 2018 low is expected to remain intact. The two 90% upwards days on 26th December 2018 and 6th January 2019 indicate this upwards trend has internal strength.
Lowry’s data shows rising Buying Power and falling Selling Pressure. This situation is normally associated with a strong and healthy bull market. Pullbacks are normal and to be expected, and they are more likely to be short term.
While the last swing low of the 8th of March remains intact, there exists a series of higher highs and higher lows from the major low in December 2018. It would be safest to assume the upwards trend remains intact despite a decline in ADX.
The pennant pattern is a reliable short-term continuation pattern. Friday may have seen an upwards breakout that has the necessary support from volume for confidence. A target calculated using the flag pole is about 2,956.
BREADTH – AD LINE
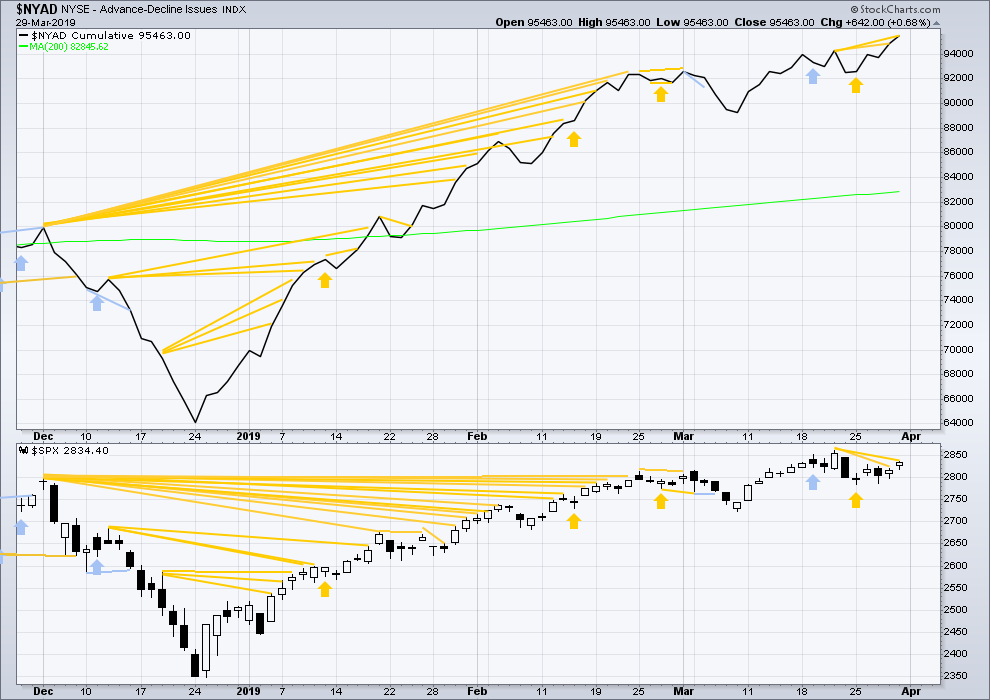
WEEKLY CHART
Click chart to enlarge. Chart courtesy of StockCharts.com. So that colour blind members are included, bearish signals
will be noted with blue and bullish signals with yellow.
Every single bear market from the Great Depression and onwards has been preceded by a minimum of 4 months divergence between price and the AD line. With the AD line making a new all time high again this week, the end of this bull market and the start of a new bear market must be a minimum of 4 months away, which is the end of July 2019 at this time.
This week the AD line makes another new all time high. Bullish mid-term divergence continues.
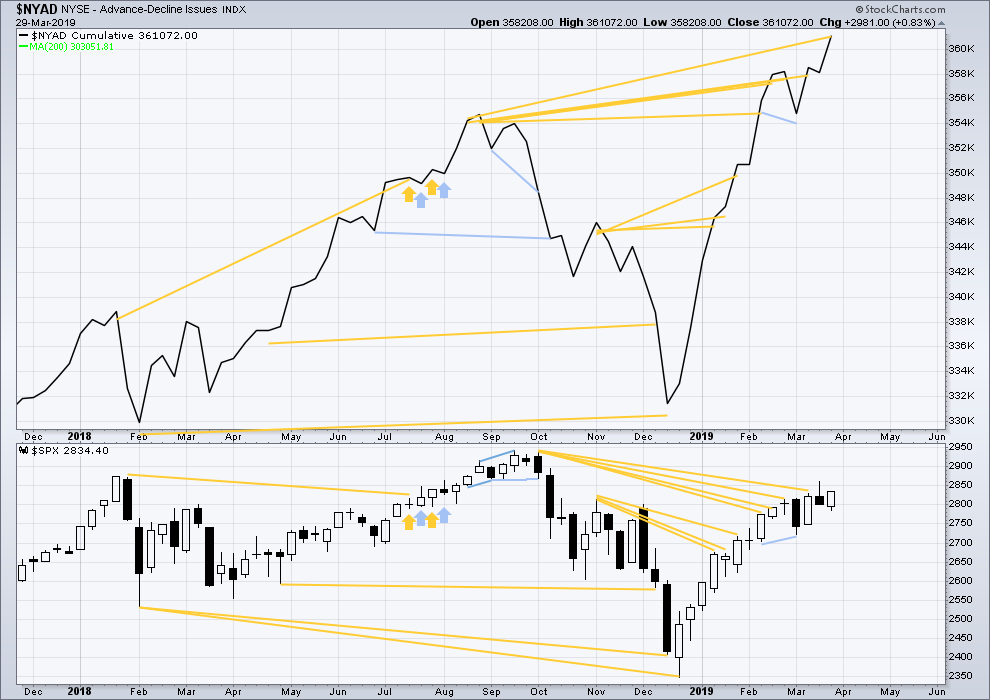
DAILY CHART
Click chart to enlarge. Chart courtesy of StockCharts.com. So that colour blind members are included, bearish signals
will be noted with blue and bullish signals with yellow.
Breadth should be read as a leading indicator.
Bullish divergence noted in last analysis has been followed by upwards movement. For Friday the AD line has made another short-term high as well as longer-term highs. This divergence continues to be bullish.
VOLATILITY – INVERTED VIX CHART
WEEKLY CHART
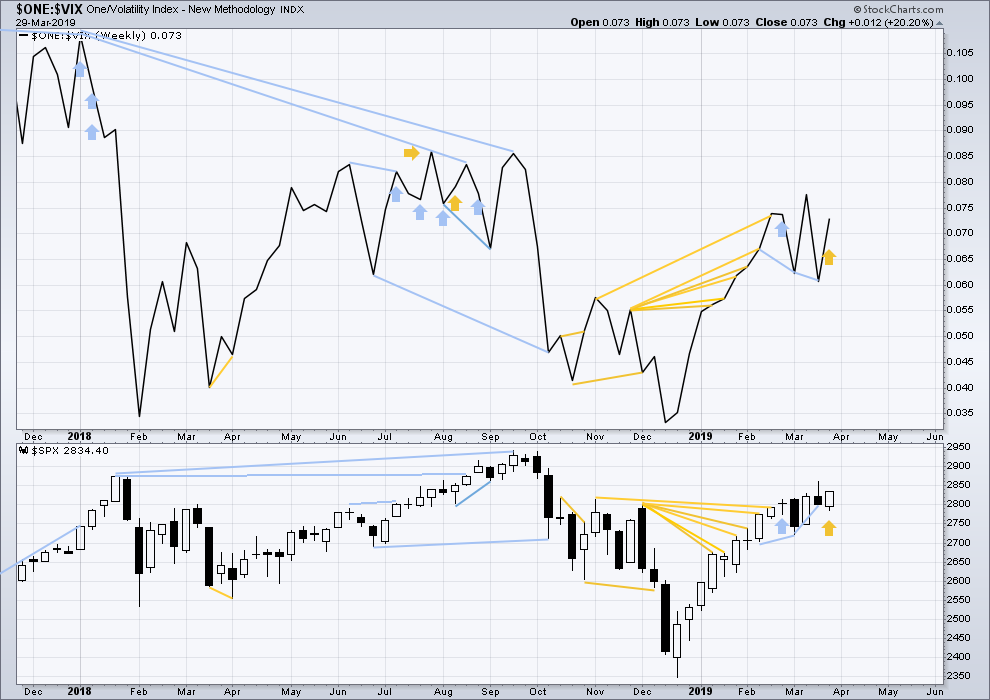
Click chart to enlarge. Chart courtesy of StockCharts.com. So that colour blind members are included, bearish signals
will be noted with blue and bullish signals with yellow.
This week price moved lower with a lower low and a lower high, but inverted VIX moved higher. This divergence is bullish for the short term.
DAILY CHART
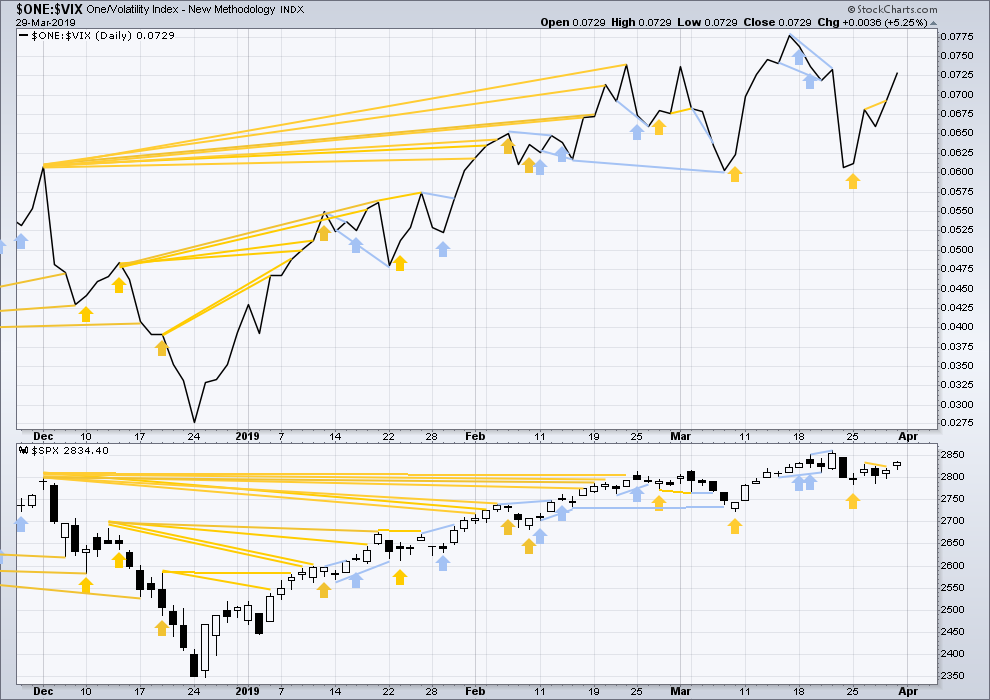
Click chart to enlarge. Chart courtesy of StockCharts.com. So that colour blind members are included, bearish signals
will be noted with blue and bullish signals with yellow.
Price and inverted VIX have both moved higher during the last two sessions. There is no short-term divergence.
DOW THEORY
Dow Theory confirmed a bear market in December 2018. This does not necessarily mean a bear market at Grand Super Cycle degree though; Dow Theory makes no comment on Elliott wave counts. On the 25th of August 2015 Dow Theory also confirmed a bear market. The Elliott wave count sees that as part of cycle wave II. After Dow Theory confirmation of a bear market in August 2015, price went on to make new all time highs and the bull market continued.
DJIA: 23,344.52 – a close on the 19th of December at 23,284.97 confirms a bear market.
DJT: 9,806.79 – price has closed below this point on the 13th of December.
S&P500: 2,532.69 – a close on the 19th of December at 2,506.96 provides support to a bear market conclusion.
Nasdaq: 6,630.67 – a close on the 19th of December at 6,618.86 provides support to a bear market conclusion.
With all the indices moving now higher, Dow Theory would confirm a bull market if the following highs are made:
DJIA: 26,951.81
DJT: 11,623.58
S&P500: 2,940.91
Nasdaq: 8,133.30.
For the short term, now DJT has made a very slight new low below the prior swing low of the 8th of March. All of the S&P500, DJIA and Nasdaq remain above their prior swing lows of the 8th of March.
Published @ 12:30 a.m. EST on March 30, 2019.
—
Careful risk management protects your trading account(s).
Follow my two Golden Rules:
1. Always trade with stops.
2. Risk only 1-5% of equity on any one trade.
I’m going to be fascinated to see how the largest EW analysis service deals with their SPX and NDX and DJI calls being almost certainly completely wrong (they say secular bear market and in general the move up from Dec lows is a 2 wave, and price is now in the early stages of a 3 down). I suspect they won’t throw in the towel until there is absolutely no choice, which isn’t quite yet. And if so, I will note the vast difference between that commercial behavior of “don’t upset the customers” and what we get from Lara: she IMMEDIATELY adjusts without concern for criticism if/when the data indicates the adjustment is necessary. So so so vital in the trading business!! Day by day is the only way. Any need to be “right” is a deadly weakness.
Agree
And here is RH, big exhaustion candle on Friday, and today might be a nice tail to trade against. Talk about a roundie $100
Goooood morning everybody! ?
Hourly chart updated:
So far today there’s a new high, after a gap up. This so far looks like another breakaway gap. If price can close on a new high that would be bullish and would strongly support the EW count.
If this is a breakaway gap then it should provide support.
If my labelling here on the hourly chart is wrong it may be in labelling the middle of this third wave as complete. It may not be yet, it may still be ahead of us.
Well that ?? didn’t work.
I’ve a nice new laptop and its has a Touch Bar. Which tells me I can choose any emoji I want.
Except it’s lying to me. My emoji…Turned out to be a ?
And here I was getting all excited at the prospect of flipping out something more than 🙂
:0
Geez, looking at the hourly main, I guess price is in a i of a iii of a iii. And overall, it indicates some very substantial upward momentum coming down the pipe, similar to this move.
But first, we have a possible shorter term double top at 2860.3 to contend with.
Finally the McClellan Oscillator ($NYMO) has exceeded +20 after having fallen to below -40 during Intermediate wave 2. This is a confirmation of the this leg up in the current bullish scenario which should propel the SPX over 3000 for the first time in history.
Sometimes it just amazes me how well Elliott Wave Theory works as a predictive model to the US equity markets. Of course, it requires a top notch analyst to tell me what it is saying. So, thanks Lara.
Now if we get a trade agreement between the US and China, it should give the markets another powerful push up.
IMO a trade agreement will push it a little but is largely already priced in. I believe the trade agreement now is more of a risk in that it could fail to completely take new massive tariffs clearly off the table, and I think the market would adjust price downward pretty hard if so.
Thanks for your additional analysis Rodney not many pundits use or discuss some of the tools you use (like McClellan Oscillator) so it’s valuable.
You are probably right on t he trade deal; priced in. If the US closes the borders completely with Mexico, it stops $1.7 Billion per day in trade and threatens 5 million jobs. The US is between a rock and a hard place.
As a shorter term trader, it’s become clear to me over the last few weeks that very often to arguably even more often than not, the larger moves are happening over night, and the day sessions are consolidation sessions. If you want price movement, ya gotta hold over night. That in turns means I have to lean heavily on my “belief” in the the wave count and trend, because of the high risk of opening up to a solidly red position.
Everything said “up” late Friday, and my buy then worked out well this time. I took profits 5 minutes after open. Now, what next…
One major EW prognosticator called a top in longer term bonds over the weekend (TLT, /ZB). The opening price this morning tends to support that hypothesis. I just bought puts in TLT.
And remember: if/as interest rates start rising again, banks will start performing again, which are the heartbeat of the SPX. Falling TLT right here is strongly supportive (IMO) of the bull wave count for SPX.
Rod, I watched the last few Ciovacco videos
Very interesting, thanks for the rec
You are most welcome. I watch them almost every week and have learned a great deal.
I’m working to develop a new theory to apply to trading. Still need a little more data before it is ready to present. Here is what the theory is telling me now. We are approaching a top between ES 2844 and 2848. Both values are absolute limits. ES 2844 is an absolute minimum that needs to be reached and ES 2848 is a level that can not be exceeded.
This is a top for the Wednesday session through the present day. Just for the most recent run-up.
exceeded
Ha! Blowed up, blowed up real good. This science experiment had a takeaway. Using a 4 day time frame can be over-ridden by a larger timeframe. One positive is that price is tracking toward ES 2872.
I have a quick question for Lara and all the members. This is a chart of the last 3 ½ days of ES trading sessions. The candlesticks are 1-hour Heikin-Ashi. The trend channel is shown as a rising wedge.
I want to start a wave count for this upward move. The point I chose for starting a count is the low point shown in the circle.
My question is; What do you perceive as a good point to begin the first wave up? Would it be at the circle or should I pick the low point from the bunch of candles over to the left of the circle? Which would be the lower point from that big down candle (11AM candle on 3/27)
Thanks for your help. The more responses the better.
Assuming that’s a simple ABC zig-zag correction on the left, seems hard to argue the next up/down is part of that prior correction.
Thanks Kevin, I would still like to hear other’s thoughts too please.
I would choose the point to the right of the circle that actually touches the lower trendline as the beginning of the wedge. Wedges are tricky and quite often do not break out the way we would like. So, I believe to draw and perceive a wedge, one must only use points that make contact with trendlines. Even so wedges are a 50-50 probability of direction at completion.
In an EW parlance, we might say, wedges are triangles and they morph into something else most of the time.
Therefore, any labeling begins at the lowest point following the correction and to the left of the circle.
Why do you ask this question?
Thank you Rodney. I’m working on a theory. I will fully lay it all out, but first I need to understand how we all percieve this scenario. No one will be called out as being right or wrong.
I would appreciate more input … thanks all.
It could be counted as an overlapping ending diagonal. Not much else it could be beyond a series of 1s and 2s because of the overlap. I think you almost have to start the count from the low previous to your circle though.
Thanks!
Elliott wave is fractal. So you can’t really count a small portion on a lower time frame in isolation. It all has to make sense in how it fits into higher time frames.
For this piece of movement you’d have to start to the swing low to the left of your circled low.
If you want to figure out what structure is in that wedge you’ve outlined, then you have to start at its beginning which is the low.
And as Tradeshark points out it could be a diagonal. The only other EW structures it could be is part of an impulse, or some kind of zigzag (single, double or triple). That’s it.
Thank you so much!
The rising wedge got blown to smithereens. Or as Rodney says, it morphed.
I would add that ES may not be reliable for EW analysis on any timeframe smaller than daily bars because of the low volume in the overnight hours. (As always, I’m happy to be corrected about this if I’m wrong.)
Yip-E-I-AY! That is what we say out in the wild west when we are excited. First again on the weekend.
For all those so interested, especially you Verne, Ciovacco Capital’s video this week is on the yield curve inversion.
Thanks Lara for all your analysis and commentary.