
Price moved lower but remains above the last short-term low and the short-term invalidation point on the hourly chart.
Summary: The upwards trend should resume. The mid-term target remains the same at 3,010.
The final target remains the same at 3,045.
Only a new low below 2,722.27 would indicate a deeper and more sustained pullback would be underway.
New updates to this analysis are in bold.
The biggest picture, Grand Super Cycle analysis, is here.
Last published monthly charts are here. Video is here.
ELLIOTT WAVE COUNTS
WEEKLY CHART
Click chart to enlarge.
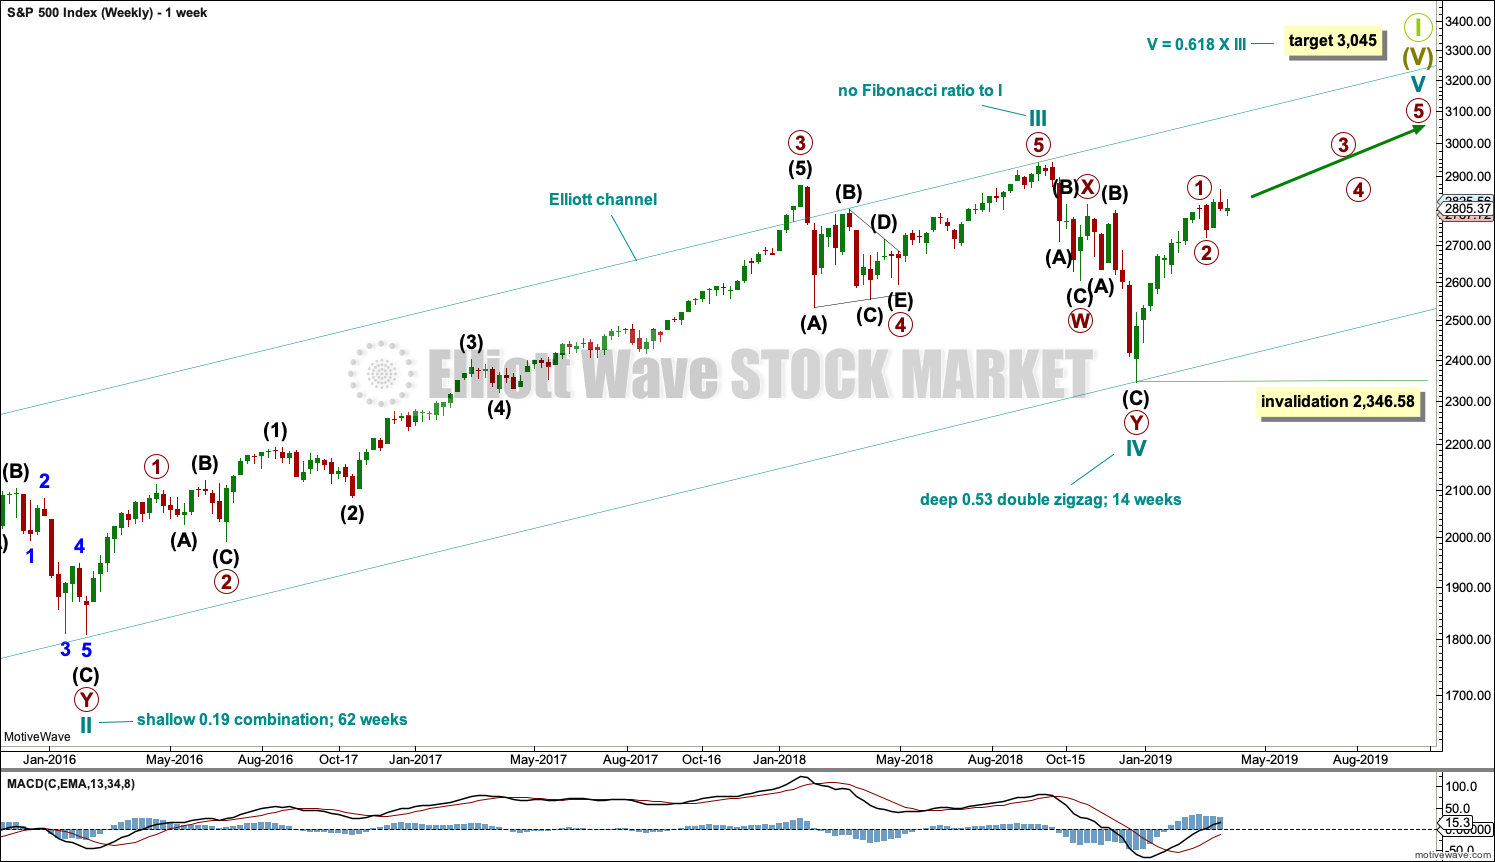
This weekly chart shows all of cycle waves III, IV and V so far.
Cycle wave II fits as a time consuming double combination: flat – X – zigzag. Combinations tend to be more time consuming corrective structures than zigzags. Cycle wave IV has completed as a multiple zigzag that should be expected to be more brief than cycle wave II.
Cycle wave IV may have ended at the lower edge of the Elliott channel.
Within cycle wave V, no second wave correction may move beyond the start of its first wave below 2,346.58.
Although both cycle waves II and IV are labelled W-X-Y, they are different corrective structures. There are two broad groups of Elliott wave corrective structures: the zigzag family, which are sharp corrections, and all the rest, which are sideways corrections. Multiple zigzags belong to the zigzag family and combinations belong to the sideways family. There is perfect alternation between the possible double zigzag of cycle wave IV and the combination of cycle wave II.
Although there is gross disproportion between the duration of cycle waves II and IV, the size of cycle wave IV in terms of price makes these two corrections look like they should be labelled at the same degree. Proportion is a function of either or both of price and time.
Draw the Elliott channel about Super Cycle wave (V) with the first trend line from the end of cycle wave I (at 2,079.46 on the week beginning 30th November 2014) to the high of cycle wave III, then place a parallel copy on the low of cycle wave II. Cycle wave V may find resistance about the upper edge.
It is possible that cycle wave V may end in October 2019. If it does not end there, or if the AD line makes new all time highs during or after June 2019, then the expectation for cycle wave V to end would be pushed out to March 2020 as the next possibility. Thereafter, the next possibility may be October 2020. March and October are considered as likely months for a bull market to end as in the past they have been popular. That does not mean though that this bull market may not end during any other month.
MAIN WAVE COUNT
DAILY CHART
Click chart to enlarge.
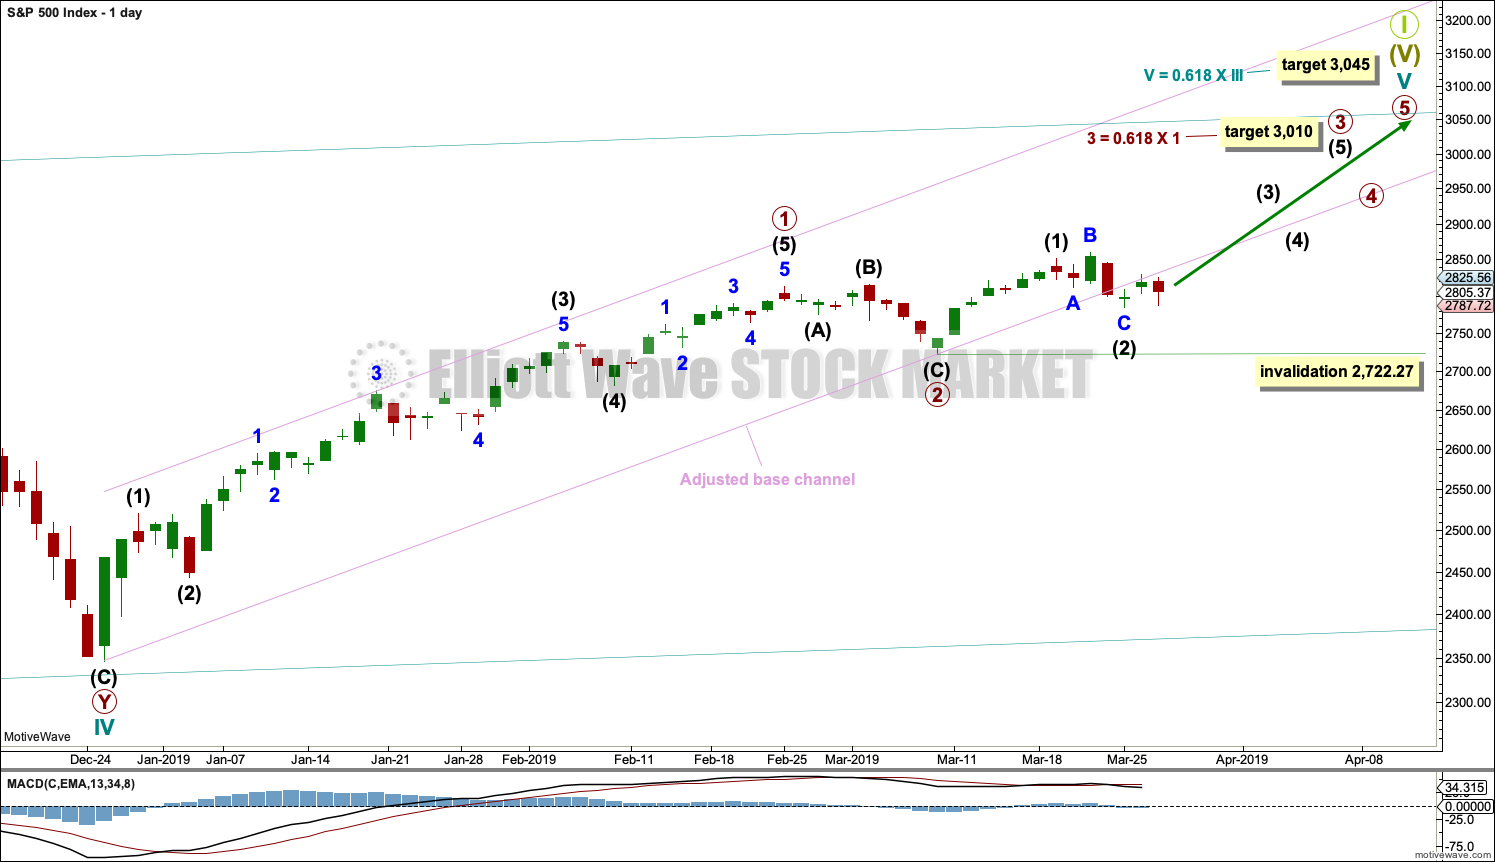
The daily chart will focus on the structure of cycle wave V.
Within Super Cycle wave (V), cycle wave III may not be the shortest actionary wave. Because cycle wave III is shorter than cycle wave I, this limits cycle wave V to no longer than equality in length with cycle wave III at 3,477.39. A target is calculated for cycle wave V to end prior to this point.
Cycle wave V must subdivide as a five wave motive structure, either an impulse or an ending diagonal. An impulse is much more common and that will be how it is labelled. A diagonal would be considered if overlapping suggests it.
Primary wave 2 may have been a very brief and shallow expanded flat correction.
Primary wave 3 may now exhibit an increase in upwards momentum. A target is calculated that fits with the higher target for cycle wave V to end.
Within primary wave 3, intermediate wave (2) may not move beyond the start of intermediate wave (1) below 2,722.27.
Intermediate wave (2) may be a complete expanded flat correction. Minor wave B within intermediate wave (2) is 1.2 times the length of minor wave A, which is within the most common range for B waves of flats from 1 to 1.38. Minor wave C may now be complete. It exhibits no Fibonacci ratio to minor wave A.
The lower edge of the adjusted base channel may provide support for pullbacks along the way up. The channel is now breached by downwards movement. The lower edge of this channel is not showing exactly where price is finding support.
HOURLY CHART
Click chart to enlarge.
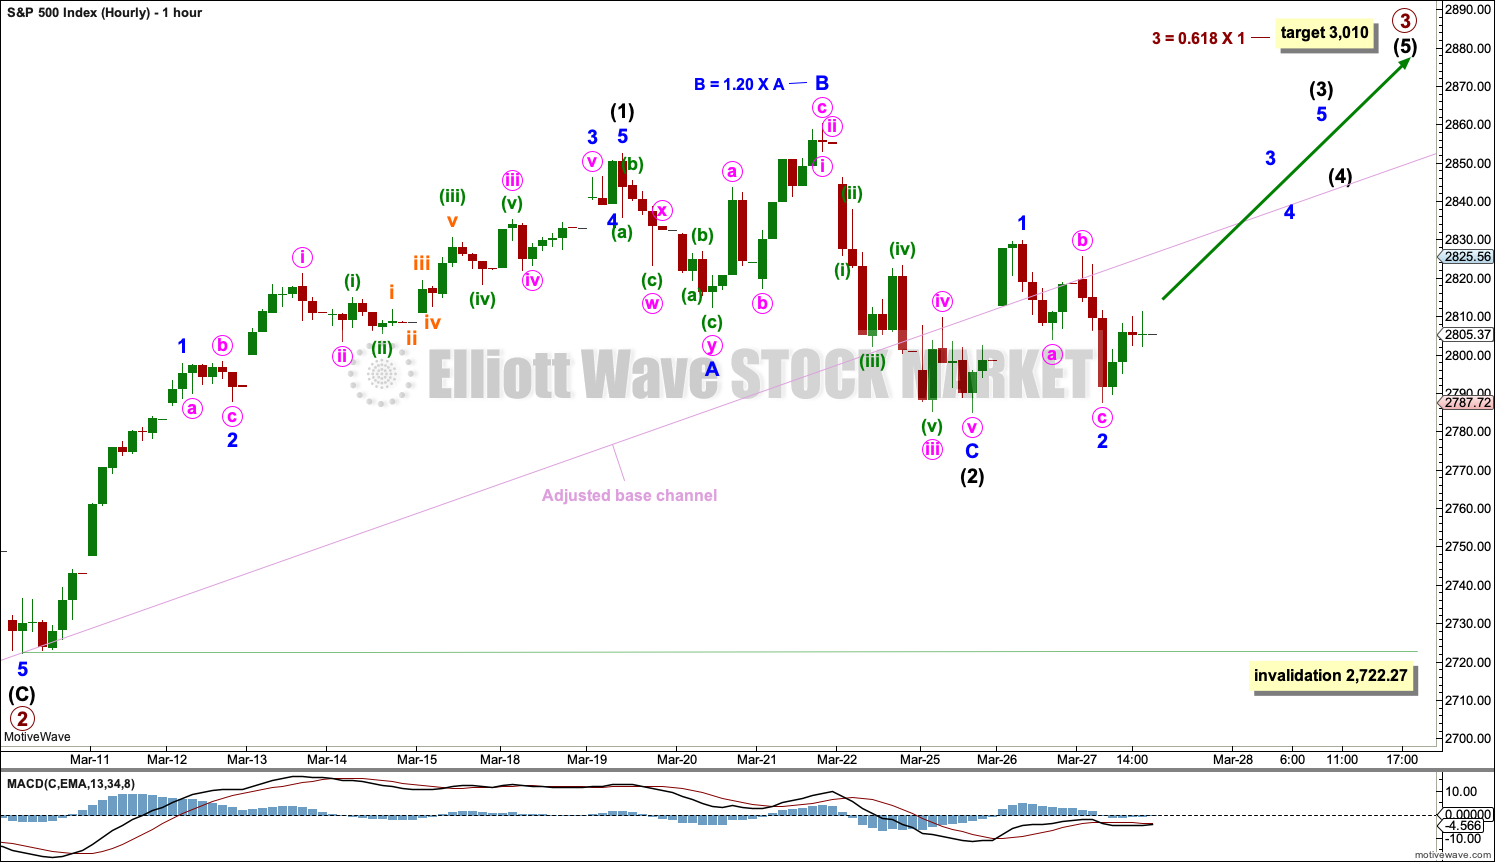
Intermediate wave (2) may be now complete.
Minor wave C subdivides as a completed five wave impulse on the five minute chart.
The adjusted base channel is breached clearly on the hourly chart, but the S&P does not always fit well within trend channels. While a breach of this channel indicates the alternate wave count below should be considered, more weight will be given to classic technical analysis, which still favours this main wave count.
This wave count now expects to see an increase in upwards momentum as a third wave at three degrees begins.
Each of primary wave 3, intermediate wave (3) and minor wave 3 may only subdivide as an impulse. It is normal for this market to exhibit extended third waves. When a third wave extends, the subdivisions often show up on higher time frames. So far this looks typical.
Minor wave 2 now looks like an obvious three wave structure on the hourly chart.
If it continues lower, then intermediate wave (2) may not move beyond the start of intermediate wave (1) below 2,722.27.
ALTERNATE WAVE COUNT
DAILY CHART
Click chart to enlarge.
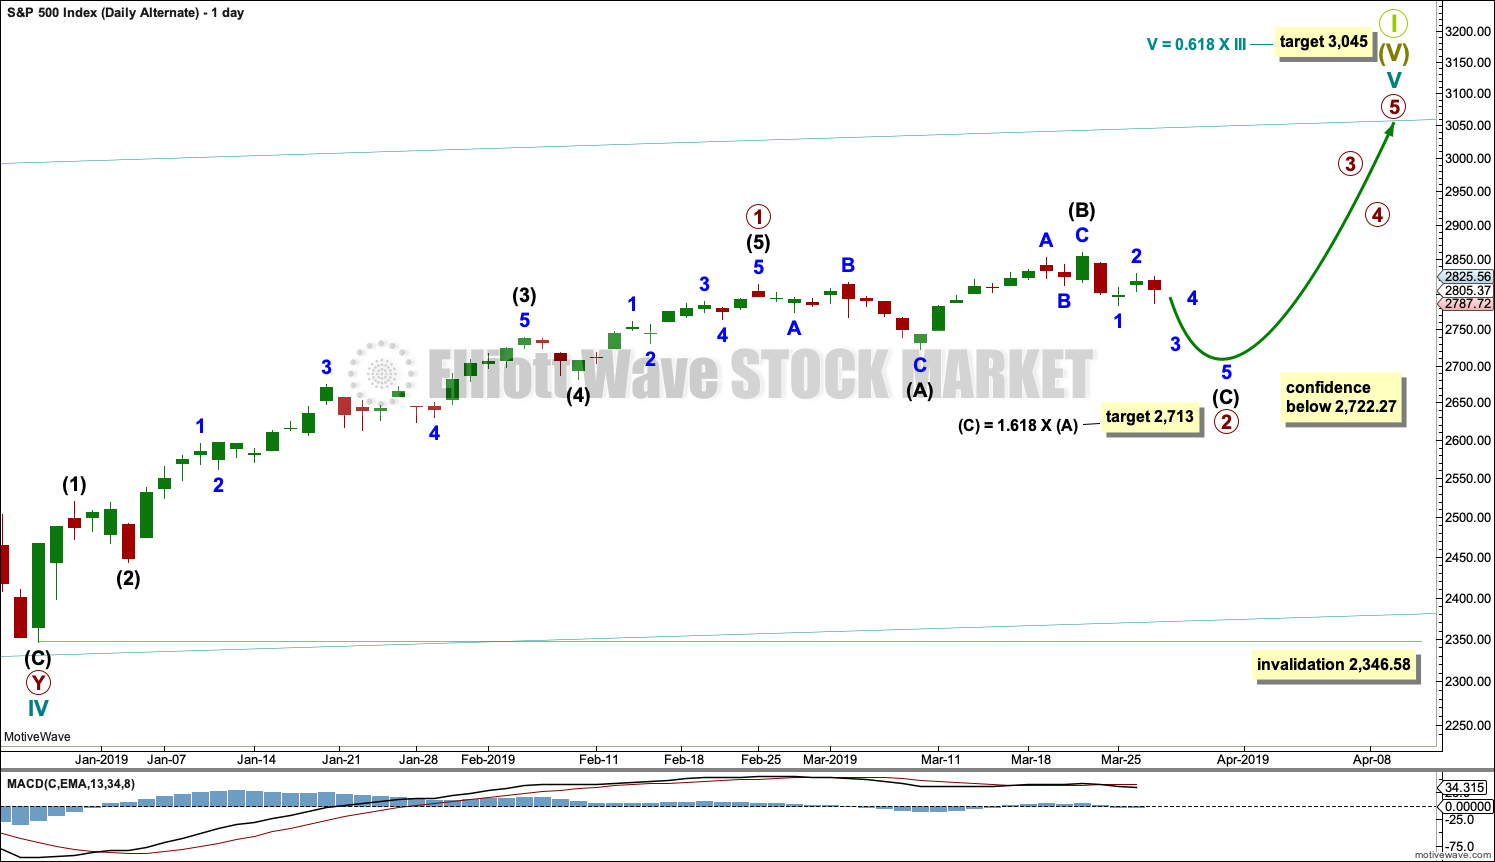
It is also possible that primary wave 2 may continue as an expanded flat correction.
Intermediate wave (B) is 1.51 times the length of intermediate wave (A). This is longer than the common range of 1 to 1.38 but within allowable limits of up to 2.
A target is calculated for intermediate wave (C); it expects to exhibit the most common Fibonacci ratio to intermediate wave (A).
Intermediate wave (C) must subdivide as a five wave motive structure. Within intermediate wave (C), minor wave 2 may not move beyond the start of minor wave 1 above 2,860.31. This wave count would be discarded with a new high.
Primary wave 2 may not move beyond the start of primary wave 1 below 2,346.58.
The breach of the channel on the main daily Elliott wave chart indicates this alternate should now be more seriously considered.
TECHNICAL ANALYSIS
WEEKLY CHART
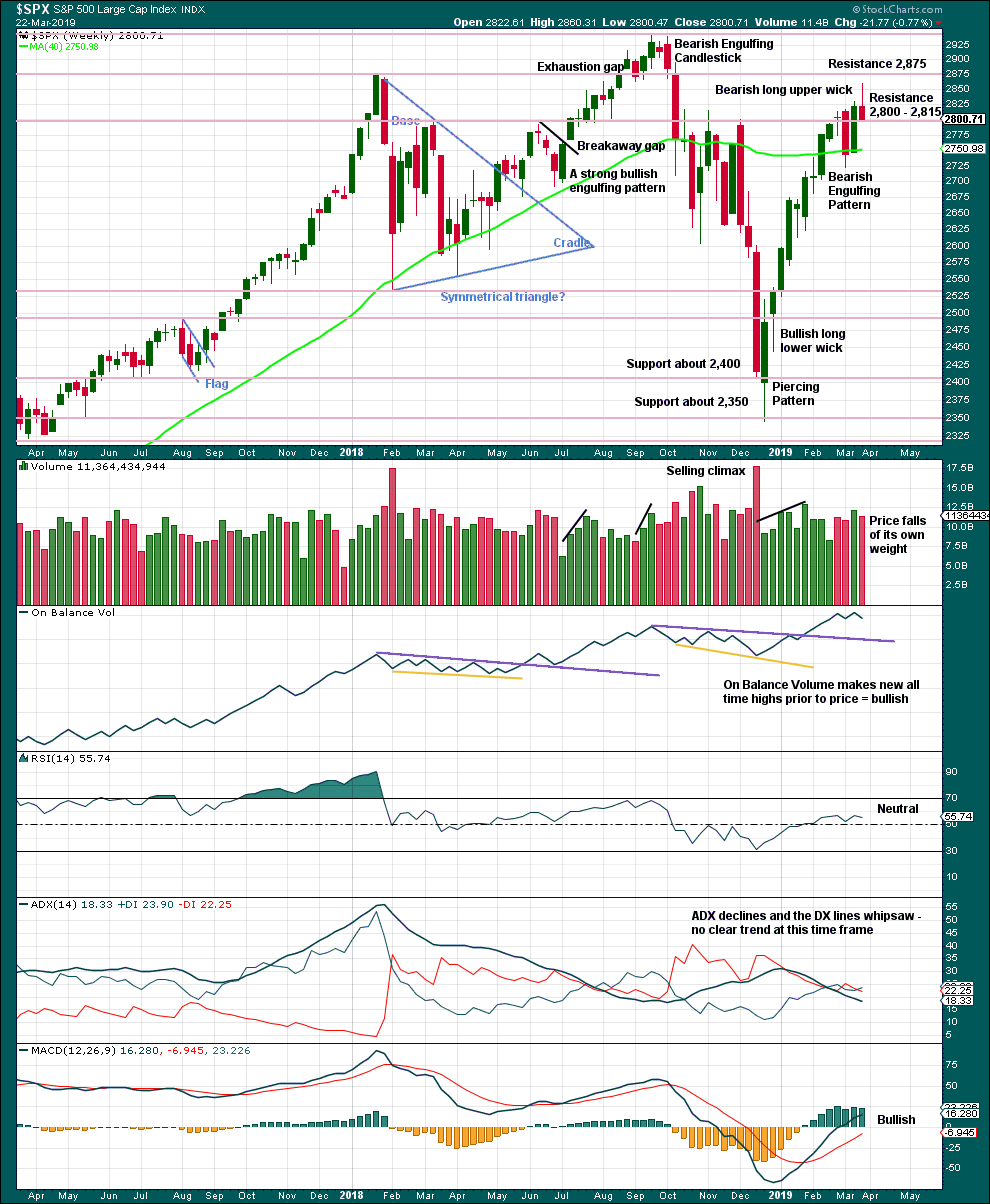
Click chart to enlarge. Chart courtesy of et=”_blank”>StockCharts.com.
The long upper wick last week is bearish.
Support at 2,800 remains. Price has not closed below this point yet.
DAILY CHART
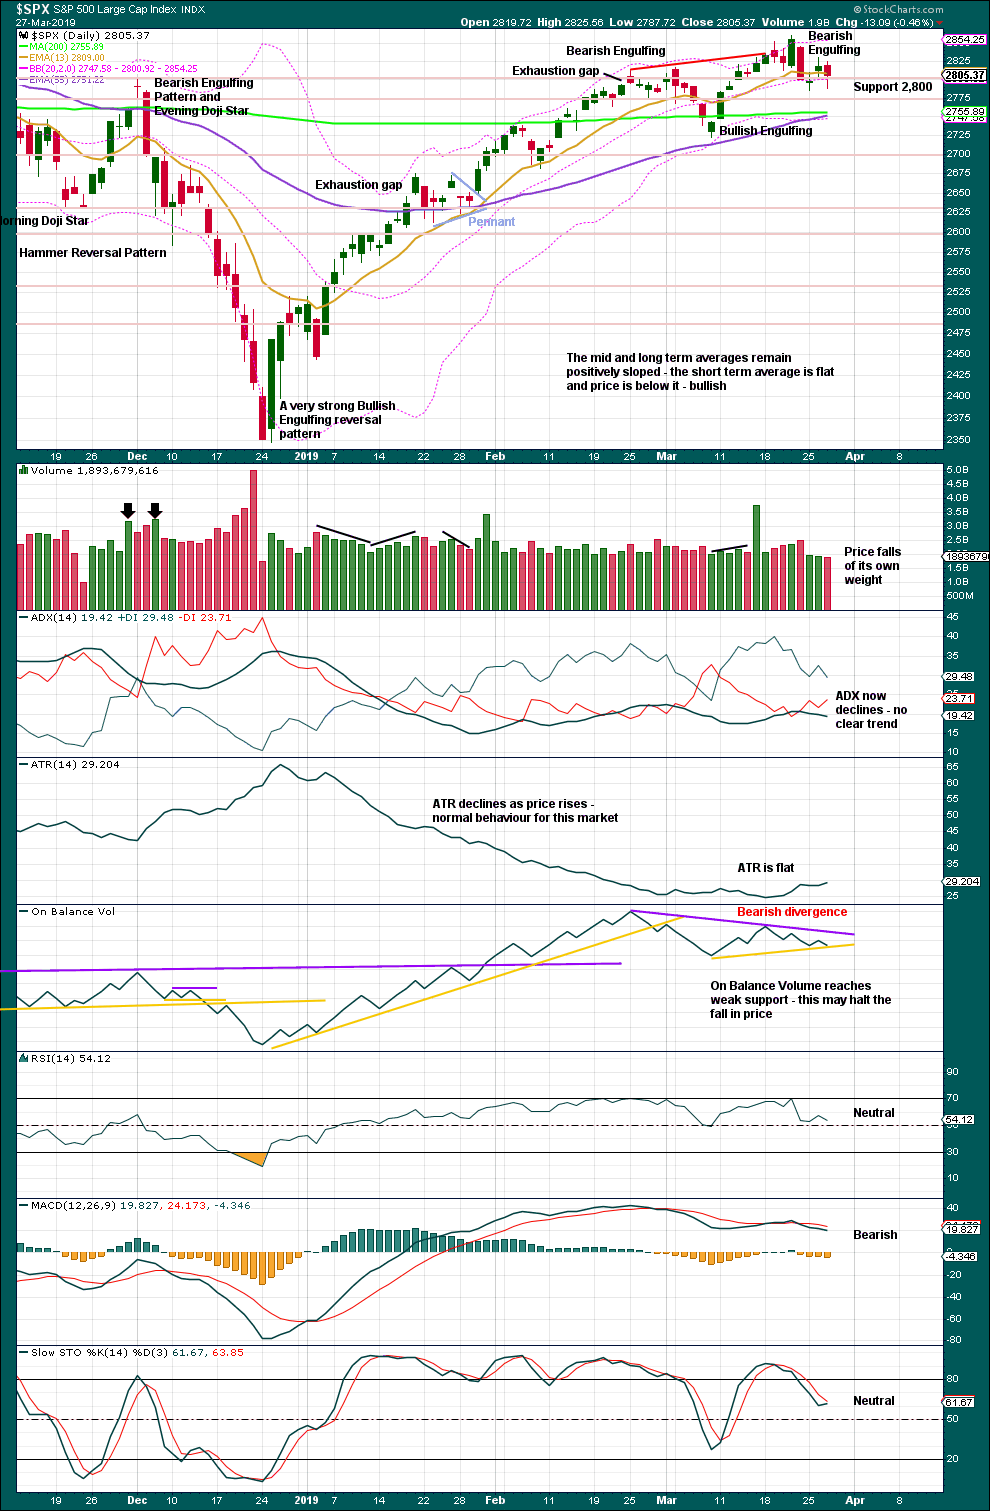
Click chart to enlarge. Chart courtesy of StockCharts.com.
The December 2018 low is expected to remain intact. The two 90% upwards days on 26th December 2018 and 6th January 2019 indicate this upwards trend has internal strength.
Lowry’s data shows rising Buying Power and falling Selling Pressure. The latter is now just one point off its low for the entire bull market (beginning March 2009). This situation is normally associated with a strong and healthy bull market. Pullbacks are normal and to be expected, and they are more likely to be short term.
While the last swing low of the 8th of March remains intact, there exists a series of higher highs and higher lows from the major low in December 2018. It would be safest to assume the upwards trend remains intact despite a decline in ADX.
Price is again back above 2,800, which may again offer support. On Balance Volume is at support, although this is weak as the support line has only two prior tests.
BREADTH – AD LINE
WEEKLY CHART
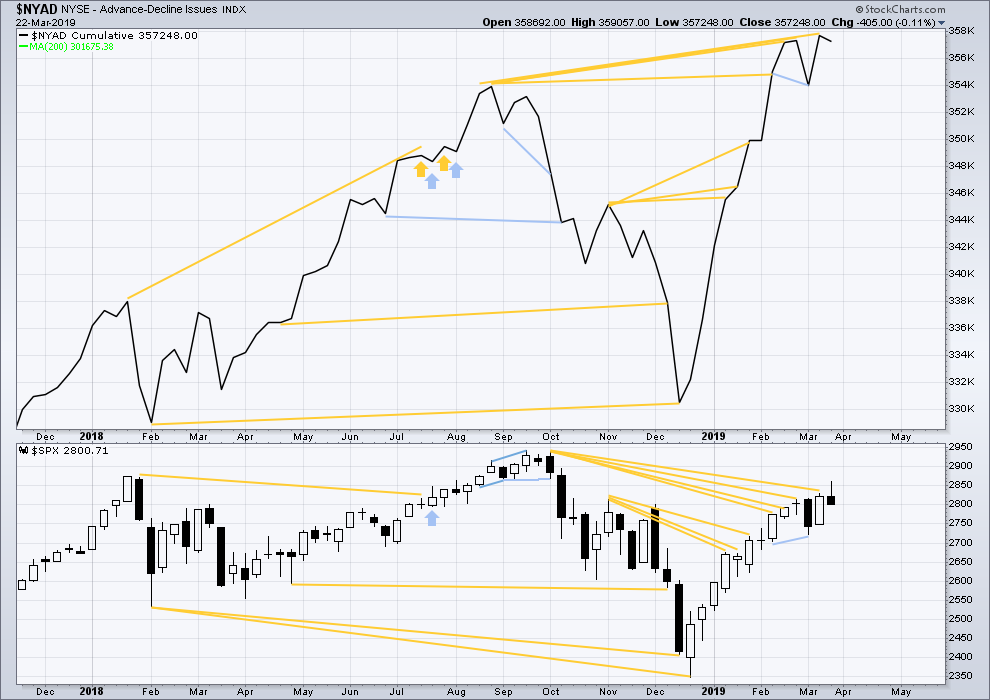
Click chart to enlarge. Chart courtesy of StockCharts.com. So that colour blind members are included, bearish signals
will be noted with blue and bullish signals with yellow.
Every single bear market from the Great Depression and onwards has been preceded by a minimum of 4 months divergence between price and the AD line. With the AD line making a new all time high again last week, the end of this bull market and the start of a new bear market must be a minimum of 4 months away, which is the end of July 2019 at this time.
This week both price and the AD line declined. The AD line is not declining any faster than price, there is no short term divergence.
Last week mid and large caps have declined but have not made new swing lows below the prior swing low of the 8th of March. Small caps have made a new low below their 8th of March low. There is some weakness in this downwards movement. Large caps remain strongest and the decline is focussed mostly in small caps.
DAILY CHART
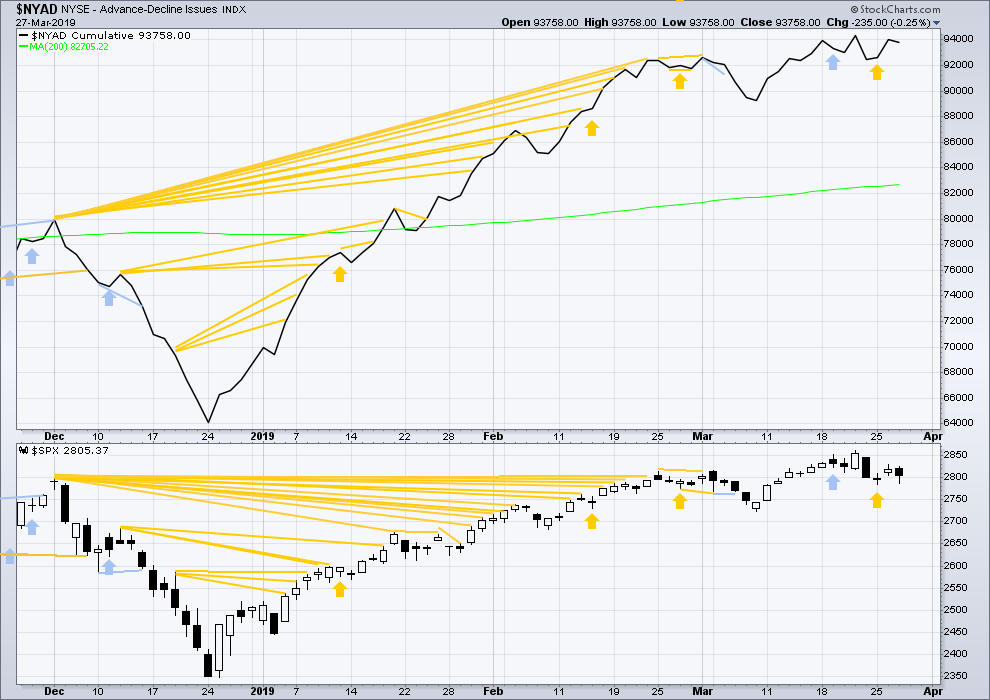
Click chart to enlarge. Chart courtesy of StockCharts.com. So that colour blind members are included, bearish signals
will be noted with blue and bullish signals with yellow.
Breadth should be read as a leading indicator.
Downwards movement today comes with a small decline in breadth. There is no new divergence.
VOLATILITY – INVERTED VIX CHART
WEEKLY CHART
Click chart to enlarge. Chart courtesy of StockCharts.com. So that colour blind members are included, bearish signals
will be noted with blue and bullish signals with yellow.
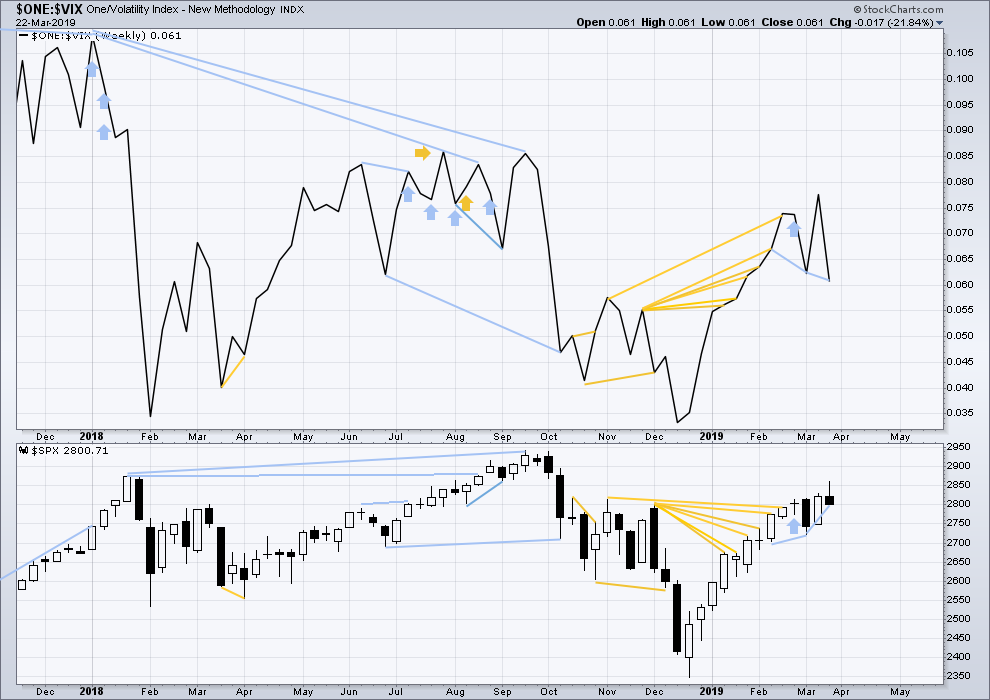
Inverted VIX has made a new short-term high and a mid-term high along with price. Upwards movement comes with a decline in VIX. There is no short nor mid-term divergence.
Longer-term divergence between price and inverted VIX at the last all time high in September 2018 remains.
DAILY CHART
Click chart to enlarge. Chart courtesy of StockCharts.com. So that colour blind members are included, bearish signals
will be noted with blue and bullish signals with yellow.
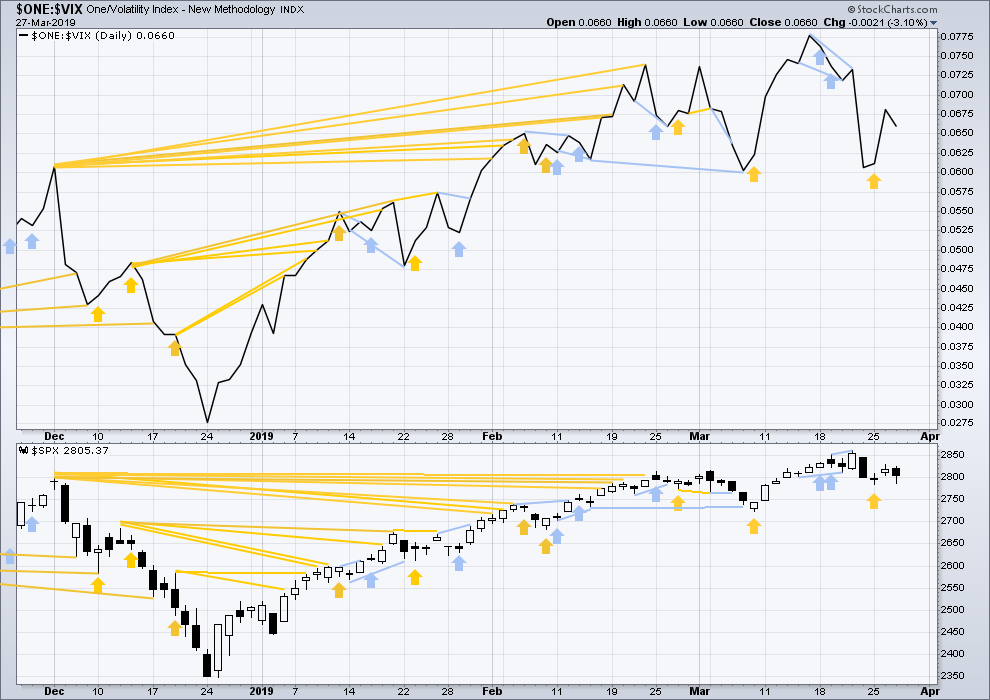
Downwards movement today comes with a normal corresponding decline in inverted VIX. There is no new divergence.
DOW THEORY
Dow Theory confirmed a bear market in December 2018. This does not necessarily mean a bear market at Grand Super Cycle degree though; Dow Theory makes no comment on Elliott wave counts. On the 25th of August 2015 Dow Theory also confirmed a bear market. The Elliott wave count sees that as part of cycle wave II. After Dow Theory confirmation of a bear market in August 2015, price went on to make new all time highs and the bull market continued.
DJIA: 23,344.52 – a close on the 19th of December at 23,284.97 confirms a bear market.
DJT: 9,806.79 – price has closed below this point on the 13th of December.
S&P500: 2,532.69 – a close on the 19th of December at 2,506.96 provides support to a bear market conclusion.
Nasdaq: 6,630.67 – a close on the 19th of December at 6,618.86 provides support to a bear market conclusion.
With all the indices moving now higher, Dow Theory would confirm a bull market if the following highs are made:
DJIA: 26,951.81
DJT: 11,623.58
S&P500: 2,940.91
Nasdaq: 8,133.30.
For the short term, all of the S&P500, DJIA, DJT and Nasdaq remain above the last swing low of the 8th of March. For the short term, all these markets have shown a series of higher highs and higher lows from the major low in December 2018. All remain currently in an upwards trend.
Published @ 07:20 p.m. EST.
—
Careful risk management protects your trading account(s).
Follow my two Golden Rules:
1. Always trade with stops.
2. Risk only 1-5% of equity on any one trade.
Price remains range bound. The longer it is range bound, the closer the breakout will be. The longer it coils sideways the stronger the breakout may be.
There may now be another first and second wave completing today. I’ve checked the subdivisions of minute wave i on the five and one minute charts, it fits.
NDX (daily) is fast approaching it’s intermediate term (bull run from Dec lows) lower channel line.
The nominal thing upcoming would be a turn up and back toward the center of the channel. Breaking through and down…could be a key signal of a trend change.
Am sticking with shorting gold for now – much clearer waves!
Amen! This market making chop suey out of both bulls and bears. I wouldn’t be surprised if we close above 2820, or below 2780 today, who knows…
Meanwhile GLD has fallen and it can’t get up. Great gold analysis on Lara’s gold forum 🙂
been adding to my GLD puts this morning myself…
I don’t see anything as decided here until the Darvas box on the this chart is exceeded (yellow lines above/below current action). 2786 on the low side, 2830 on the high side. A broad range.
Is this a coil yet? Entered from above…so price should exit down?
Hmm….
Over here we have the granddaddy of fibo’s and the “dual timeframe reversal” calling for a bear market to start up in the dollar.
And over there we have the granddaddy of elliott wave theory’s top daily chartest calling for a bull market to continue from here in the dollar. This side strikes me as a more credible on this one, or should I say, I’d go with it if only because the trend is your friend and the dollar has been strong at the weekly/monthly.
In gold it seems everyone’s short term bearish (down in an E wave), medium term bullish (up and out of the triangle) and long term bearish (finishes a 2 wave correction then sells off hard). Or something vaguely like that.
interest rates falling hard, TLT on a tear. The EW guys are calling for a top and turn very soon, a 2 up completing. It’s at a 78.6% now.
In SP500 we have the EW guys calling the recent high a now complete 2 up. A BIG 3 down coming very soon to a market near you. We know Lara’s call, but it’s fair to say that a significant primary 2 down in Lara’s alternate would look a lot like the big 3 down call for quite awhile and we’d not be able to determine the difference.
Ciovacco is clearly and pretty strongly bullish (though he’d never say so, “we take it a day at a time” etc.). He’s long, that’s clear and what’s important. He might change his tune if the 200 day SMA gets undercut a second time, though.
And so we probe further into the future. One pundit went out on a limb and called “high volatility” (a large move, up or down) Thursday/Friday, to fulfill the week’s volatility pricing in SPX options expiring Friday. Very brave call (yes, that’s mild cynicism). So I’m ready to go with any explosive action but I’m suspecting we are going to get more chop here Thurs/Fri. More backing and filling as Larry Williams likes to say.
At the higher timeframe if you put a gun to my head to make a call on where the market will be in 3 months…I’d have to go with the bullish call. This consolidation is completely reasonable in the context of an ongoing bull market, and the fact that it’s holding above the 200 day SMA is significant for the longer term (and my view changes fast if it’s undercut). The evidence Ciovacco lays out for signs this is the early stages of a larger bull run is pretty strong.
Looking at vol
Vix futures through vxxb
It’s up 6 of last 8 days
But it’s not really going anywhere..
That could change
But each spike reaches a lower level the last week…
So watching carefully … but in the past as when it has many vxxb “up”days.. and can’t make a singnificant spike…
That usually corresponds to the market backfilling and preparing for the next leg up….
I’m sitting on a lot of 355 and above nflx calls for Friday that I grabbed today…
I’ll bascially flush all my short calls work the past two weeks if I don’t get a % or two upside by Friday …
Sold bull spreads in spy for both Monday and Wednesday
But got in the money.. they stopped out on this knife chop
Tried another 280-278 spread for Friday at the close
With the intention to go long ….to catch the next wave 3 folks are talking about
But I’m having my doubts ..
I thought it would be easier to be bullish on these things …lol
yea, chop slices just about everyone.
I Lara’s main plays out, VIX is headed back below 13 fast. And a good VIX buy sets up.
Well
The 280-278 spy bull put spread allowed me to be paid
No stop out this time 🙂
Was able to exit my nflx calls
Not a bad bull day
Did sell some vxxb 29-28 put spreads end of day
They did a nice job smashing vxxb today as that pattern was showing
Missed the trade down though
Also sold nflx 352.50-347.50 put spreads today for around $2.00 for next Friday
Did a call butterfly $352.50-360 -372.50 for around a buck
Also did a spy call 282.50 -284-286 butterfly for .30 Monday to catch an move up with limited risk …
Good thoughts, Thx
B-I-N-G-O
B-I-N-G-O
B-I-N-G-O
And Bingo was his name-O.