
A little more downwards movement was expected for Monday, although the short-term target at 2,796 was too high.
Summary: The upwards trend should resume. The mid-term target remains the same at 3,010.
The final target remains the same at 3,045.
Only a new low below 2,722.27 would indicate a deeper and more sustained pullback would be underway.
New updates to this analysis are in bold.
The biggest picture, Grand Super Cycle analysis, is here.
Last published monthly charts are here. Video is here.
ELLIOTT WAVE COUNTS
WEEKLY CHART
Click chart to enlarge.
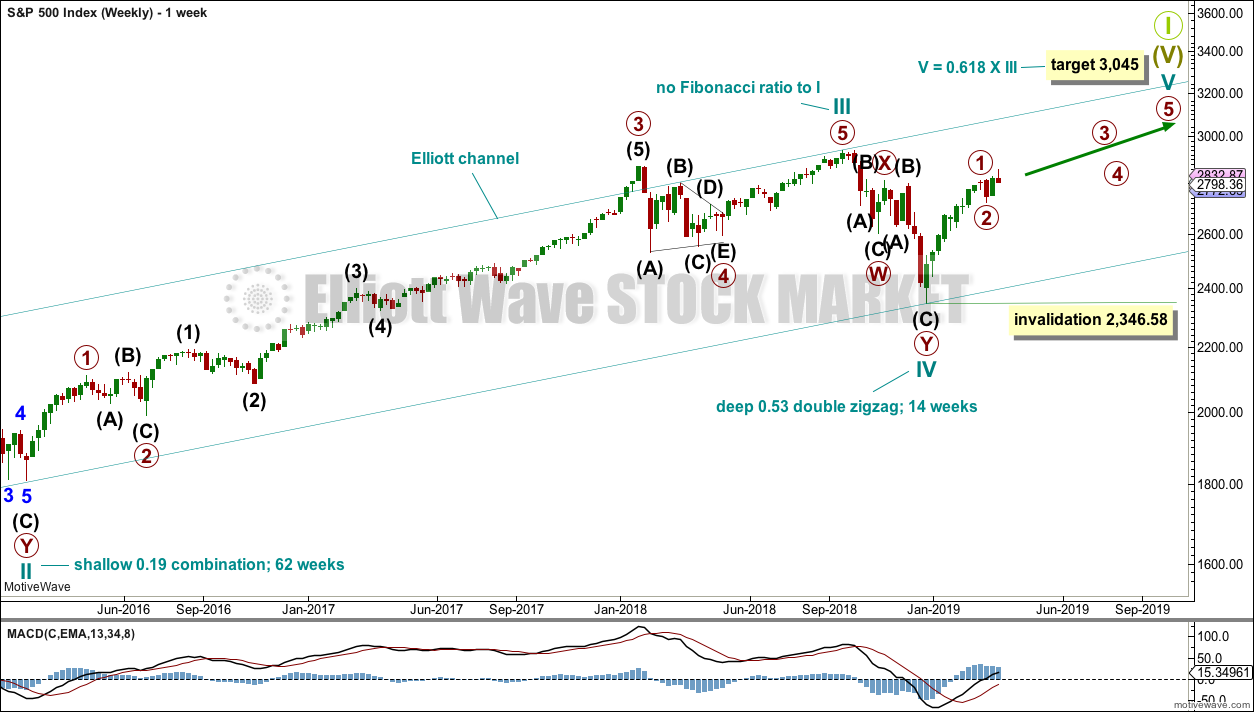
This weekly chart shows all of cycle waves III, IV and V so far.
Cycle wave II fits as a time consuming double combination: flat – X – zigzag. Combinations tend to be more time consuming corrective structures than zigzags. Cycle wave IV has completed as a multiple zigzag that should be expected to be more brief than cycle wave II.
Cycle wave IV may have ended at the lower edge of the Elliott channel.
Within cycle wave V, no second wave correction may move beyond the start of its first wave below 2,346.58.
Although both cycle waves II and IV are labelled W-X-Y, they are different corrective structures. There are two broad groups of Elliott wave corrective structures: the zigzag family, which are sharp corrections, and all the rest, which are sideways corrections. Multiple zigzags belong to the zigzag family and combinations belong to the sideways family. There is perfect alternation between the possible double zigzag of cycle wave IV and the combination of cycle wave II.
Although there is gross disproportion between the duration of cycle waves II and IV, the size of cycle wave IV in terms of price makes these two corrections look like they should be labelled at the same degree. Proportion is a function of either or both of price and time.
Draw the Elliott channel about Super Cycle wave (V) with the first trend line from the end of cycle wave I (at 2,079.46 on the week beginning 30th November 2014) to the high of cycle wave III, then place a parallel copy on the low of cycle wave II. Cycle wave V may find resistance about the upper edge.
It is possible that cycle wave V may end in October 2019. If it does not end there, or if the AD line makes new all time highs during or after June 2019, then the expectation for cycle wave V to end would be pushed out to March 2020 as the next possibility. Thereafter, the next possibility may be October 2020. March and October are considered as likely months for a bull market to end as in the past they have been popular. That does not mean though that this bull market may not end during any other month.
MAIN WAVE COUNT
DAILY CHART
Click chart to enlarge.
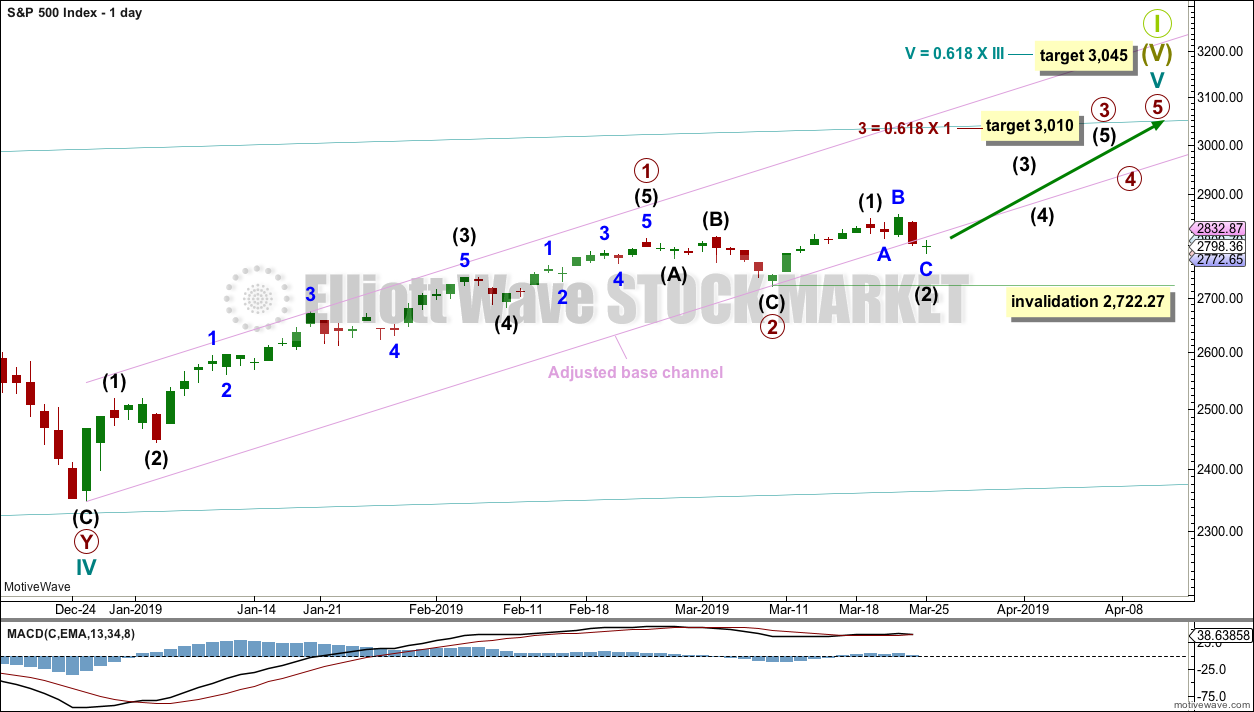
The daily chart will focus on the structure of cycle wave V.
Within Super Cycle wave (V), cycle wave III may not be the shortest actionary wave. Because cycle wave III is shorter than cycle wave I, this limits cycle wave V to no longer than equality in length with cycle wave III at 3,477.39. A target is calculated for cycle wave V to end prior to this point.
Cycle wave V must subdivide as a five wave motive structure, either an impulse or an ending diagonal. An impulse is much more common and that will be how it is labelled. A diagonal would be considered if overlapping suggests it.
Price has closed above resistance, which was about 2,815, on an upwards day with support from volume. This classic upwards breakout above resistance indicates underlying strength. This may be the early stage of a third wave. Primary waves 1 and 2 may both be over. Primary wave 2 may have been a very brief and shallow expanded flat correction.
Primary wave 3 may now exhibit an increase in upwards momentum. A target is calculated that fits with the higher target for cycle wave V to end.
Within primary wave 3, intermediate wave (2) may not move beyond the start of intermediate wave (1) below 2,722.27.
Intermediate wave (2) may be a complete expanded flat correction. Minor wave B within intermediate wave (2) is 1.2 times the length of minor wave A, which is within the most common range for B waves of flats from 1 to 1.38. Minor wave C may now be complete. It exhibits no Fibonacci ratio to minor wave A.
The lower edge of the adjusted base channel may provide support for pullbacks along the way up. Price closed below the lower edge of this channel on Friday, but the channel was not properly breached. Today the channel is now breached by a full daily candlestick below and not touching the lower edge. Although the candlestick has closed as a doji, this is not convincing downwards movement.
HOURLY CHART
Click chart to enlarge.
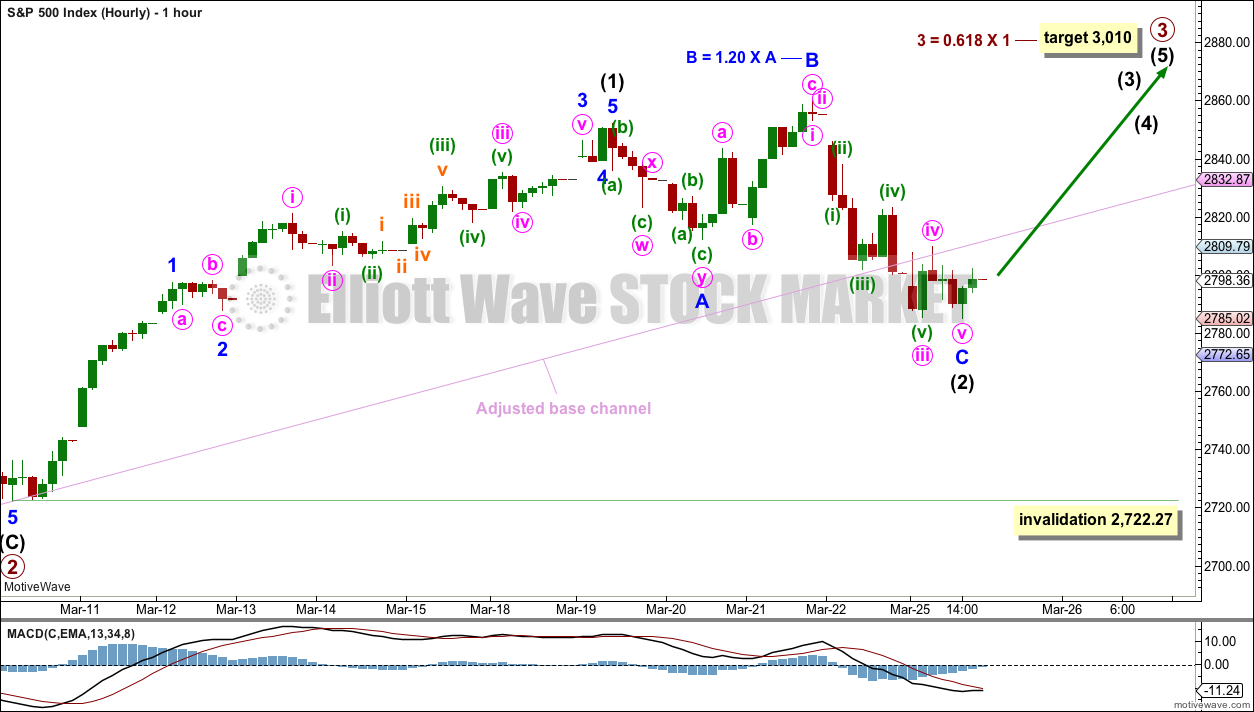
Intermediate wave (2) may be now complete.
Minor wave C subdivides as a completed five wave impulse on the five minute chart.
The adjusted base channel is breached clearly on the hourly chart, but the S&P does not always fit well within trend channels. While a breach of this channel indicates the alternate wave count below should be considered, more weight will be given to classic technical analysis, which still favours this main wave count.
This wave count now expects to see an increase in upwards momentum as a third wave at two large degrees begins.
If it continues lower, then intermediate wave (2) may not move beyond the start of intermediate wave (1) below 2,722.27.
ALTERNATE WAVE COUNT
DAILY CHART
Click chart to enlarge.
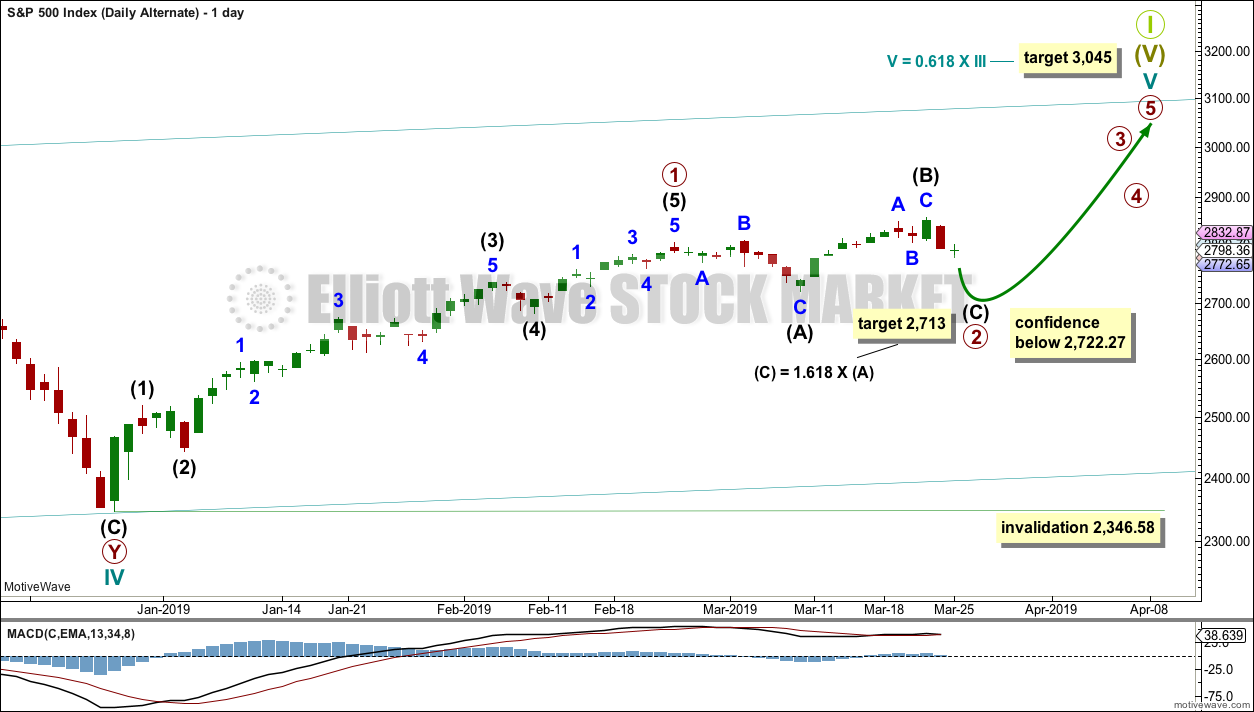
It is also possible that primary wave 2 may continue as an expanded flat correction.
Intermediate wave (B) is 1.51 times the length of intermediate wave (A). This is longer than the common range of 1 to 1.38 but within allowable limits of up to 2.
A target is calculated for intermediate wave (C); it expects to exhibit the most common Fibonacci ratio to intermediate wave (A).
Primary wave 2 may not move beyond the start of primary wave 1 below 2,346.58.
TECHNICAL ANALYSIS
WEEKLY CHART
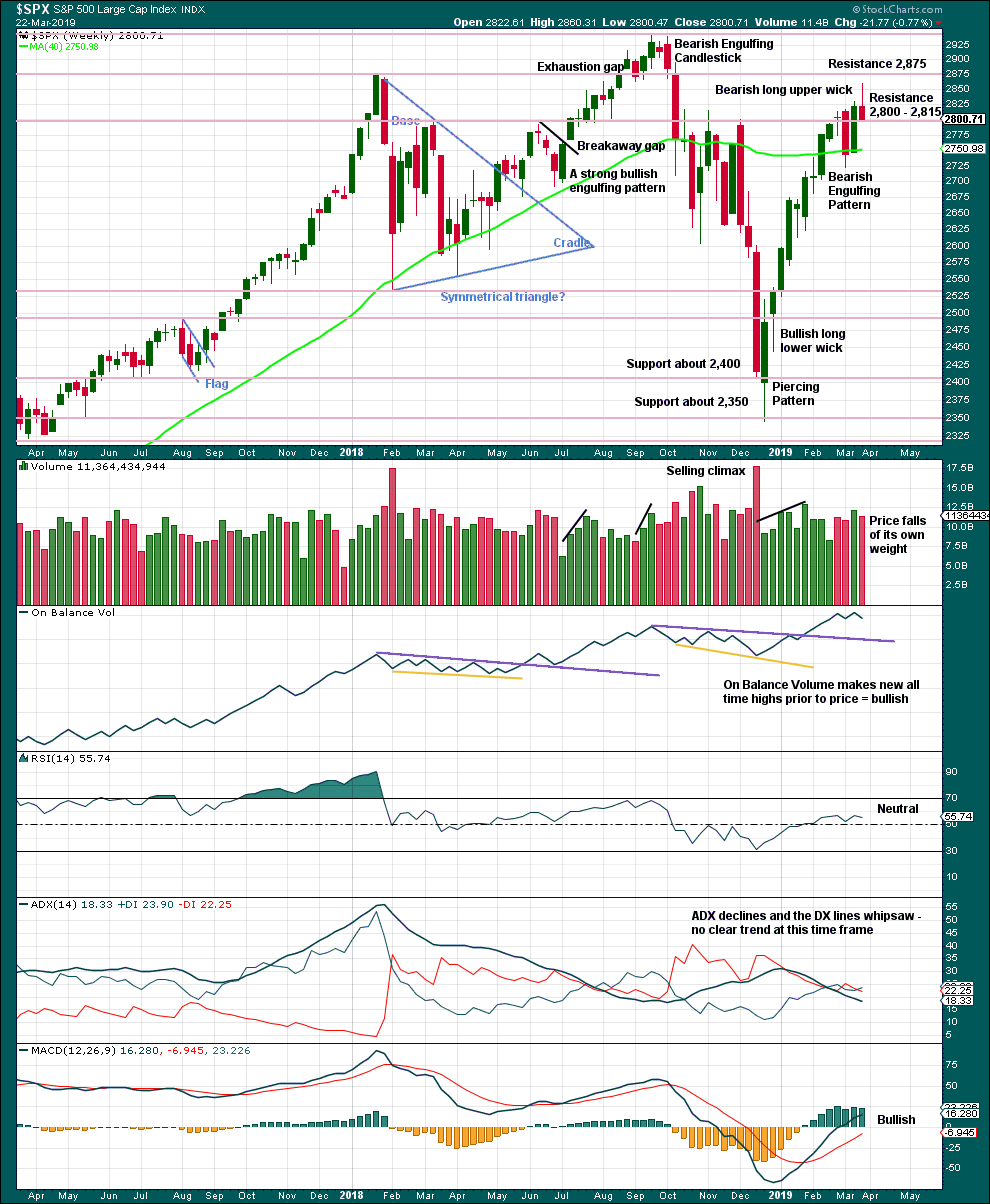
Click chart to enlarge. Chart courtesy of et=”_blank”>StockCharts.com.
The long upper wick last week is bearish.
Support at 2,800 remains. Price has not closed below this point yet.
DAILY CHART
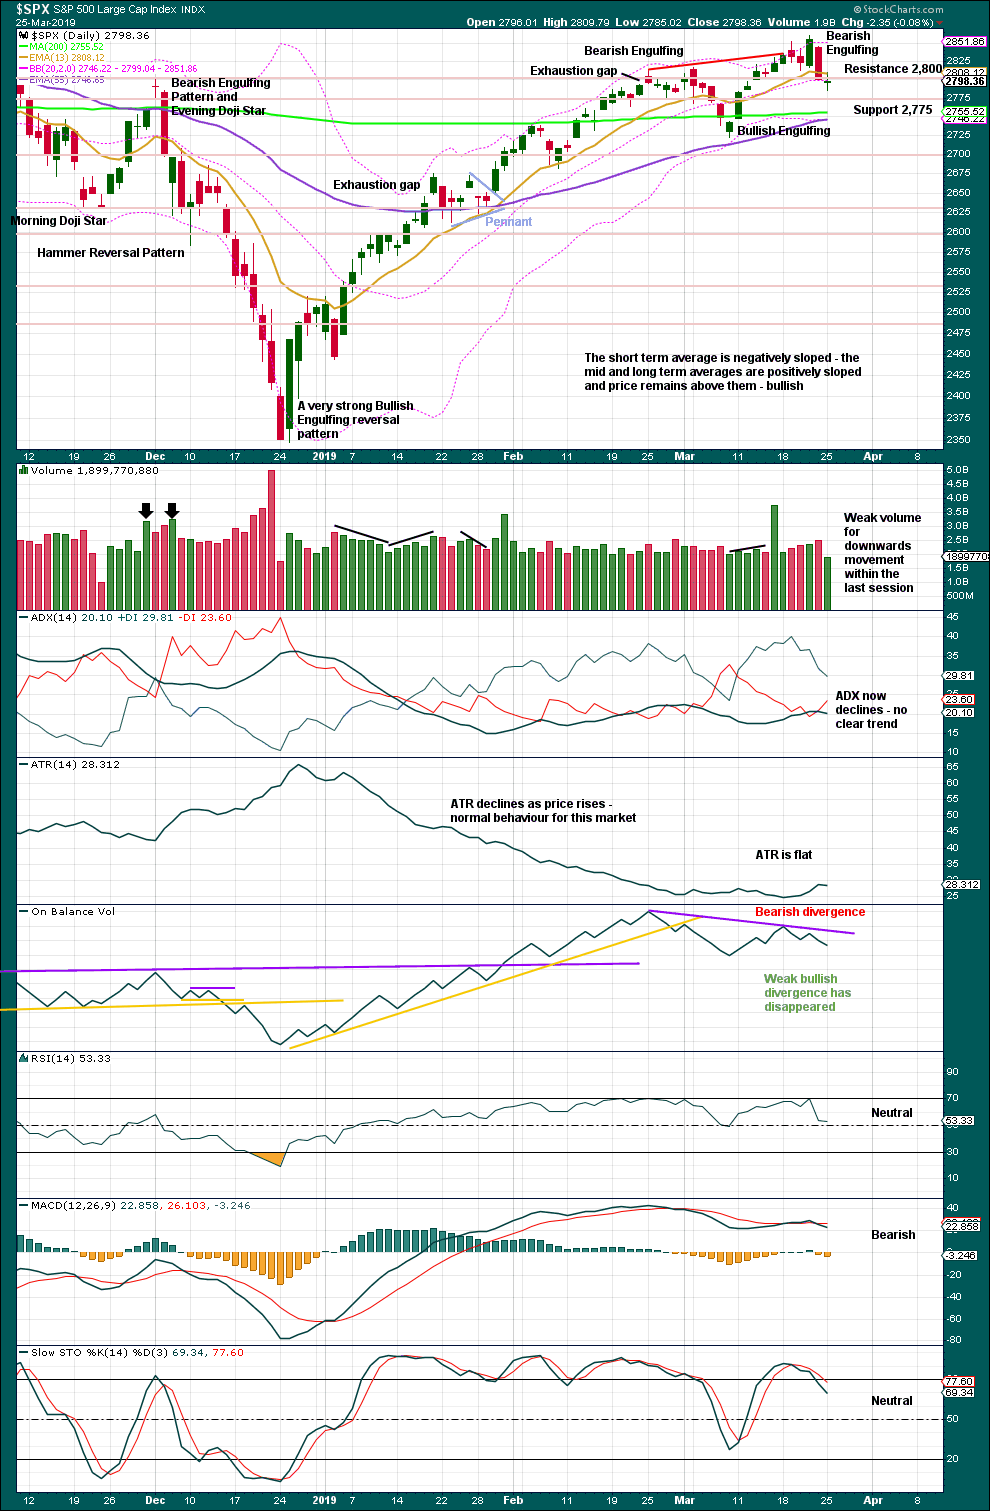
Click chart to enlarge. Chart courtesy of StockCharts.com.
The December 2018 low is expected to remain intact. The two 90% upwards days on 26th December 2018 and 6th January 2019 indicate this upwards trend has internal strength.
Friday’s candlestick engulfs several prior candlesticks. After a clear upwards trend, this is a bearish reversal signal. This supports the alternate Elliott wave count.
Now Monday’s candlestick closes as a doji, putting the very short-term trend from down to neutral. Weak volume supports a more neutral view.
Lowry’s data shows rising Buying Power and falling Selling Pressure. The latter is now just a few points of its low for the entire bull market (beginning March 2009). This situation is normally associated with a strong and healthy bull market. Pullbacks are normal and to be expected, and they are more likely to be short term.
BREADTH – AD LINE
WEEKLY CHART
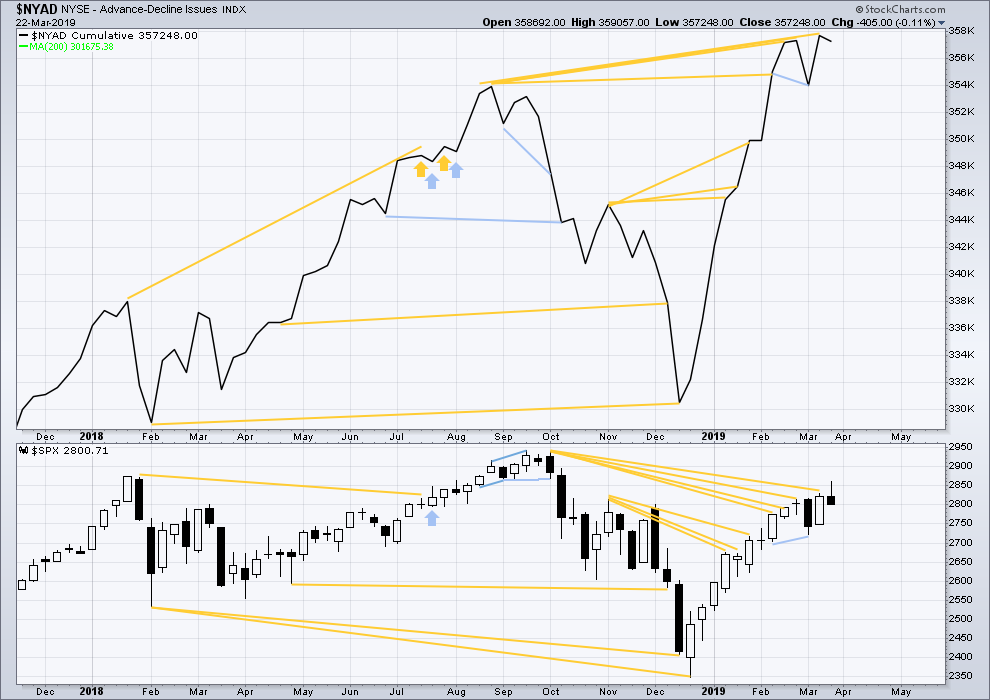
Click chart to enlarge. Chart courtesy of StockCharts.com. So that colour blind members are included, bearish signals
will be noted with blue and bullish signals with yellow.
Every single bear market from the Great Depression and onwards has been preceded by a minimum of 4 months divergence between price and the AD line. With the AD line making a new all time high again last week, the end of this bull market and the start of a new bear market must be a minimum of 4 months away, which is the end of July 2019 at this time.
This week both price and the AD line declined. The AD line is not declining any faster than price, there is no short term divergence.
Last week mid and large caps have declined but have not made new swing lows below the prior swing low of the 8th of March. Small caps have made a new low below their 8th of March low. There is some weakness in this downwards movement. Large caps remain strongest and the decline is focussed mostly in small caps.
DAILY CHART
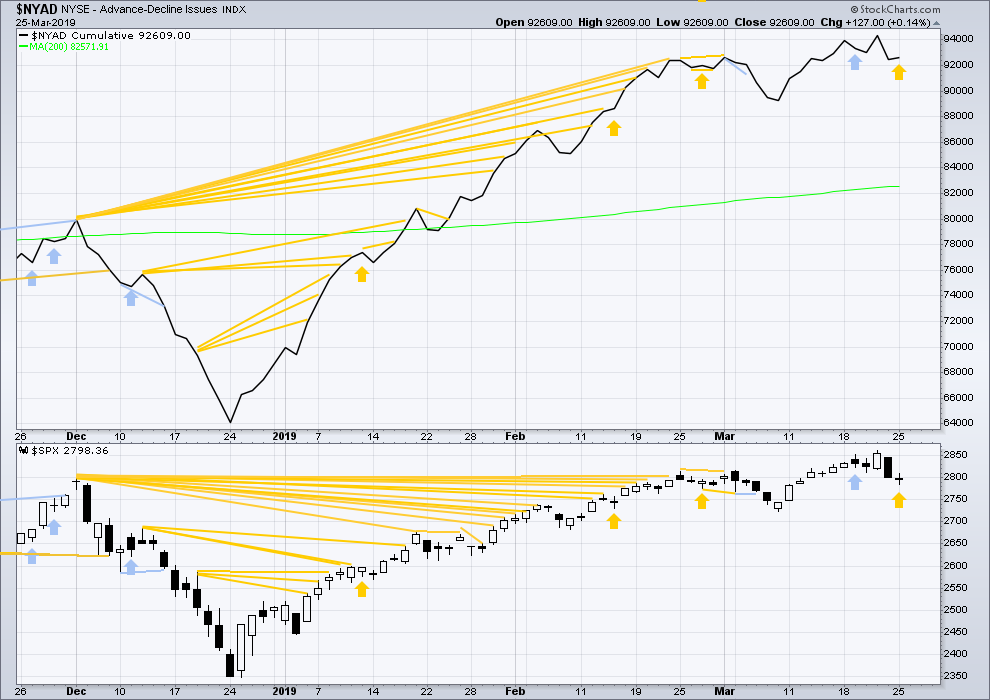
Click chart to enlarge. Chart courtesy of StockCharts.com. So that colour blind members are included, bearish signals
will be noted with blue and bullish signals with yellow.
Breadth should be read as a leading indicator.
Today price moved lower, but the AD line has moved slightly higher. This divergence is bullish.
VOLATILITY – INVERTED VIX CHART
WEEKLY CHART
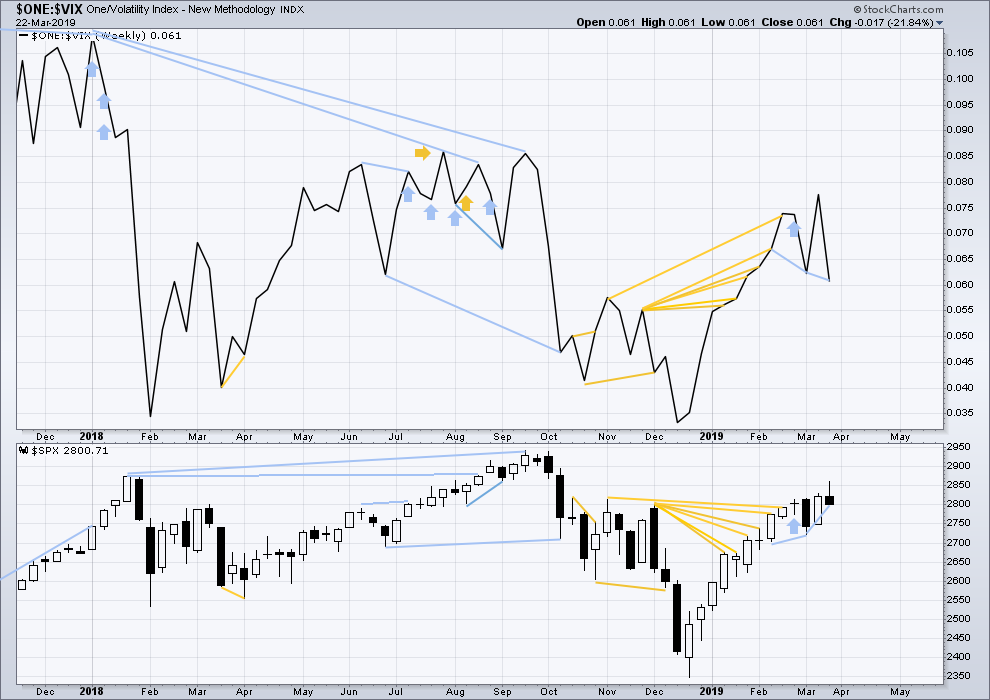
Click chart to enlarge. Chart courtesy of StockCharts.com. So that colour blind members are included, bearish signals
will be noted with blue and bullish signals with yellow.
Inverted VIX has made a new short-term high and a mid-term high along with price. Upwards movement comes with a decline in VIX. There is no short nor mid-term divergence.
Longer-term divergence between price and inverted VIX at the last all time high in September 2018 remains.
DAILY CHART

Click chart to enlarge. Chart courtesy of StockCharts.com. So that colour blind members are included, bearish signals
will be noted with blue and bullish signals with yellow.
Bearish divergence noted in last analysis has now been followed by a downwards day.
Today price moved lower, but inverted VIX has moved higher. This divergence is bullish.
DOW THEORY
Dow Theory confirmed a bear market in December 2018. This does not necessarily mean a bear market at Grand Super Cycle degree though; Dow Theory makes no comment on Elliott wave counts. On the 25th of August 2015 Dow Theory also confirmed a bear market. The Elliott wave count sees that as part of cycle wave II. After Dow Theory confirmation of a bear market in August 2015, price went on to make new all time highs and the bull market continued.
DJIA: 23,344.52 – a close on the 19th of December at 23,284.97 confirms a bear market.
DJT: 9,806.79 – price has closed below this point on the 13th of December.
S&P500: 2,532.69 – a close on the 19th of December at 2,506.96 provides support to a bear market conclusion.
Nasdaq: 6,630.67 – a close on the 19th of December at 6,618.86 provides support to a bear market conclusion.
With all the indices moving now higher, Dow Theory would confirm a bull market if the following highs are made:
DJIA: 26,951.81
DJT: 11,623.58
S&P500: 2,940.91
Nasdaq: 8,133.30.
For the short term, all of the S&P500, DJIA, DJT and Nasdaq remain above the last swing low of the 8th of March. For the short term, all these markets have shown a series of higher highs and higher lows from the major low in December 2018. All remain currently in an upwards trend.
Published @ 07:34 p.m. EST.
—
Careful risk management protects your trading account(s).
Follow my two Golden Rules:
1. Always trade with stops.
2. Risk only 1-5% of equity on any one trade.
JPM (hourly) may be close. Should go if Lara’s later this week call plays out. I’ve initiated a pilot long here. Below 98 I’m out.
Good morning everybody.
The gap from this morning’s open remains open… just. If it remains open it may be a breakaway gap. If it’s closed then it’s a pattern gap.
If it remains open at the close of this session then assume (until proven otherwise) it’s a breakaway gap and so may offer support.
For this count there now would be three overlapping first and second waves completing. This count expects an increase in upwards momentum, most likely that should happen by the end of this week.
NFLX is worth watching for a long set up and triggers here, as it continues to move down to key fibo levels and the lower volatility band.
I’m closing all short call positions for this week at open
Not writing more till over 365
I think some weekly 362-365 calls could be worth a pick up
They ran huge last week….
For you chart pattern traders, heck of a bull flag forming on the hourly in AVGO! A measured move up should move it almost $25.
Well I bought the close yesterday and sold around today’s high. Guess I’m gonna by the gap full too!
Well this should be amusing. We all know Lara’s big picture bullish call. Those Other Guys have the Dec-Mar rise as a 2 up of a new motive wave down of high degree in a secular bear market. Hmm. And then there’s Todd who is calling the broad action here the start of a massive triangle 4, and is probably calling the downward movement wave C down starting (will know more Wednesday, free update day).
Well, there you have have it anyway. Three EW calls, all different.
Me, I think it’s going to be choppy as heck no matter what so I don’t care. I’m trading extremely defensively, for better or worse, with focus on executing off clean intraday fibo level turns in RUT, SPX and/or NDX, until there’s more clarity of day/week trend from here.
Shown is SPX weekly, daily, hourly, and 5 minute, clockwise from top left. I have SPX weekly trend back an neutral now (so far this week, one day only) after 2 weeks of mild up. Daily trend is still up, and of course hourly is down (but mild only due to the stalling action at the 50% level 2791) at the moment. So everything is pretty mixed up right here.
It does look like a move up off the lower volatility band (purple on my charts) on the hourly and up to the upper one is due here. Matching a move up and away from the 21 period EMA on the daily (blue line). I will have a mild long bias to start tomorrow, all else being equal.
Keep an eye on RUT (this is 4 hour w/overnight). It’s polarity inverted to “bearish” big time. That said, maybe it just completed an ABC correction down and it’s time for new highs soon. The large cluster of support elements in the 1485-1495 range is key; if price breaks below there, watch out below, and I’d expect all markets to be heading off the cliff then.
AG closed above it’s 100 Week Moving Average today of $7.10 (C $7.15) and will make N52WH’s and touch it’s 100 month MA. This is a one to 2 month trade from here.
Good Luck!
I have discovered a new EW channel. The old one broke and I needed one that supported my bullish narrative. So, wham, here it is. It’s not so much a channel but more of a chunnel. The ES is tunneling its way higher!
Looks like today was a big retracement to the 50% level. Though I had threatened to become a bear, I haven’t sold anything and am still as bullish as ever. We just broke above the little volcano at ES 2815.25
The fib levels on the chart are made from the March low to the March high.
I thought I might be first but the moderator beat me to it. This is the first time I have ever seen Lara as first. Good for you Lara. Also even though you said “No response is required” I would like to say, “Thank you very much.” I am perfectly content to not post about any sort of political issues here, USA or otherwise.
Finally, thanks for the analysis and commentary. It / you are always appreciated.
Agreed
Moderation note:
The topic of US politics is going to be off limits here, because it is so polarising. Unless it is directly related to the markets.
When it comes up it does tend to lead to some rudeness and some people being upset.
I want us to share our technical and fundamental market analysis, learn from each other and support each other. I do not want this forum to descend into rudeness.
Also, I’m a New Zealander. I am rather tired of US politics, it is discussed everywhere. I am not prepared to enter into the fray on my own websites.
This is not an issue of free speech. You are all free to say whatever you like and there are multiple spaces to do so. This is not one of them.
I thank you all for your understanding. And I really do heartily encourage all to discuss the markets and market analysis here.
Other topics may also be discussed as long as everybody remains ultra polite.
No response to this comment is required. Thank you very much.