
Upwards movement continues towards the targets.
Summary: A close above resistance at 2,815 (November 2018 highs) on an upwards day with support from volume is a classic upwards breakout.
A third wave up may now gather strength. A new short-term target is calculated at 2,893.
The mid-term target remains at 3,010.
The final target remains the same at 3,045.
New updates to this analysis are in bold.
The biggest picture, Grand Super Cycle analysis, is here.
Last published monthly charts are here. Video is here.
ELLIOTT WAVE COUNTS
WEEKLY CHART
Click chart to enlarge.
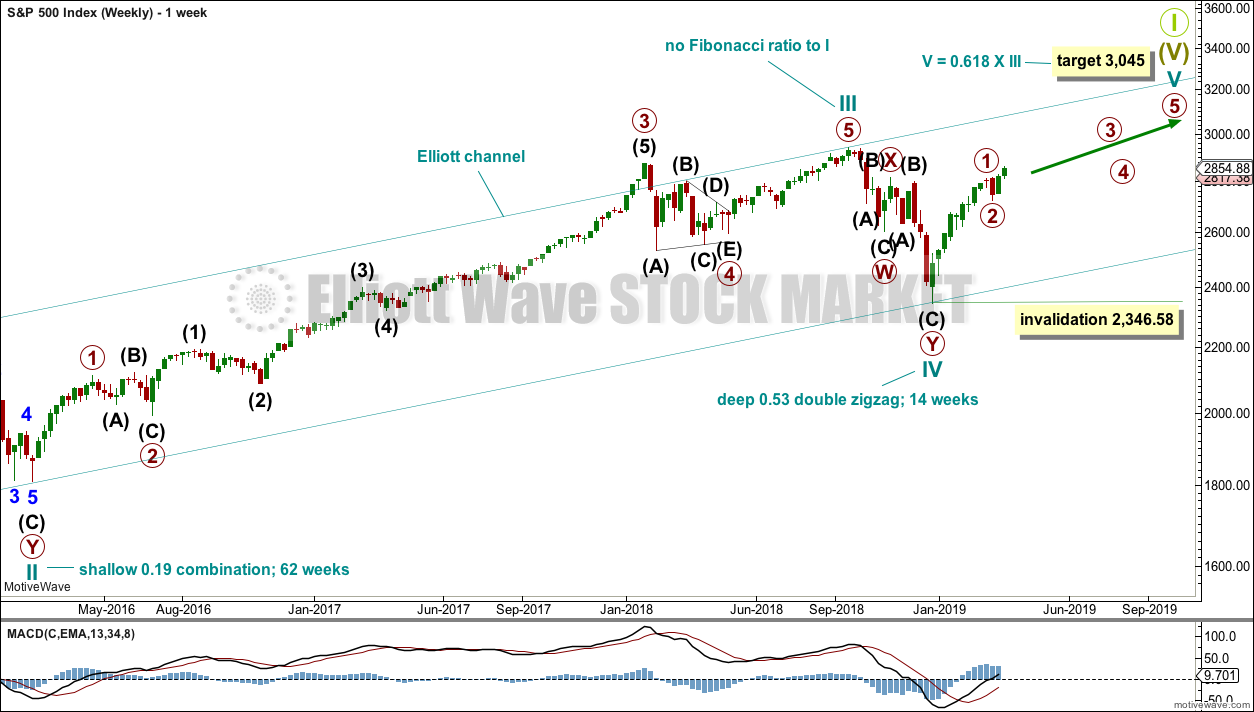
This weekly chart shows all of cycle waves III, IV and V so far.
Cycle wave II fits as a time consuming double combination: flat – X – zigzag. Combinations tend to be more time consuming corrective structures than zigzags. Cycle wave IV has completed as a multiple zigzag that should be expected to be more brief than cycle wave II.
Cycle wave IV may have ended at the lower edge of the Elliott channel.
Within cycle wave V, no second wave correction may move beyond the start of its first wave below 2,346.58.
Although both cycle waves II and IV are labelled W-X-Y, they are different corrective structures. There are two broad groups of Elliott wave corrective structures: the zigzag family, which are sharp corrections, and all the rest, which are sideways corrections. Multiple zigzags belong to the zigzag family and combinations belong to the sideways family. There is perfect alternation between the possible double zigzag of cycle wave IV and the combination of cycle wave II.
Although there is gross disproportion between the duration of cycle waves II and IV, the size of cycle wave IV in terms of price makes these two corrections look like they should be labelled at the same degree. Proportion is a function of either or both of price and time.
Draw the Elliott channel about Super Cycle wave (V) with the first trend line from the end of cycle wave I (at 2,079.46 on the week beginning 30th November 2014) to the high of cycle wave III, then place a parallel copy on the low of cycle wave II. Cycle wave V may find resistance about the upper edge.
It is possible that cycle wave V may end in October 2019. If it does not end there, or if the AD line makes new all time highs during or after June 2019, then the expectation for cycle wave V to end would be pushed out to March 2020 as the next possibility. Thereafter, the next possibility may be October 2020. March and October are considered as likely months for a bull market to end as in the past they have been popular. That does not mean though that this bull market may not end during any other month.
MAIN WAVE COUNT
DAILY CHART
Click chart to enlarge.
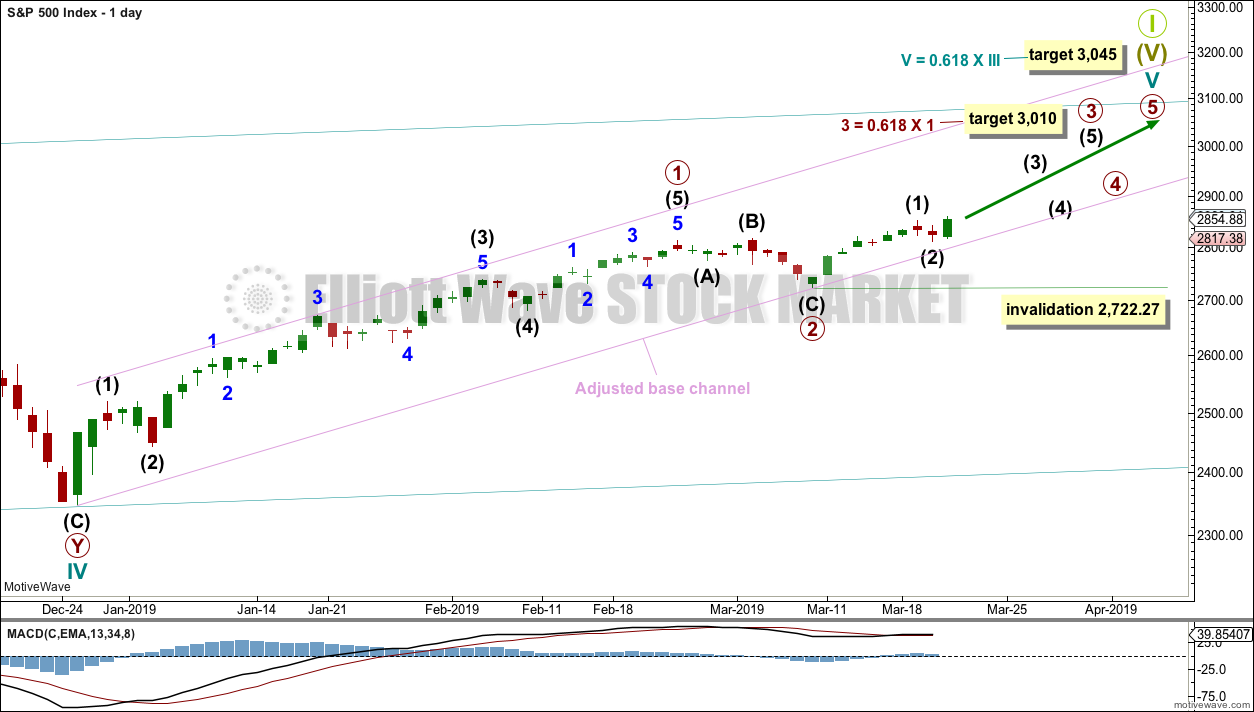
The daily chart will focus on the structure of cycle wave V.
Within Super Cycle wave (V), cycle wave III may not be the shortest actionary wave. Because cycle wave III is shorter than cycle wave I, this limits cycle wave V to no longer than equality in length with cycle wave III at 3,477.39. A target is calculated for cycle wave V to end prior to this point.
Cycle wave V must subdivide as a five wave motive structure, either an impulse or an ending diagonal. An impulse is much more common and that will be how it is labelled. A diagonal would be considered if overlapping suggests it.
Price has closed above resistance, which was about 2,815, on an upwards day with support from volume. This classic upwards breakout above resistance indicates underlying strength. This may be the early stage of a third wave. Primary waves 1 and 2 may both be over. Primary wave 2 may have been a very brief and shallow expanded flat correction.
Primary wave 3 may now exhibit an increase in upwards momentum. A target is calculated that fits with the higher target for cycle wave V to end.
Within primary wave 3, no second wave correction may move beyond the start of its first wave below 2,722.27.
The lower edge of the adjusted base channel may provide support for pullbacks along the way up. If price breaks below the lower edge of this channel, then the alternate wave count below should be considered.
HOURLY CHART
Click chart to enlarge.
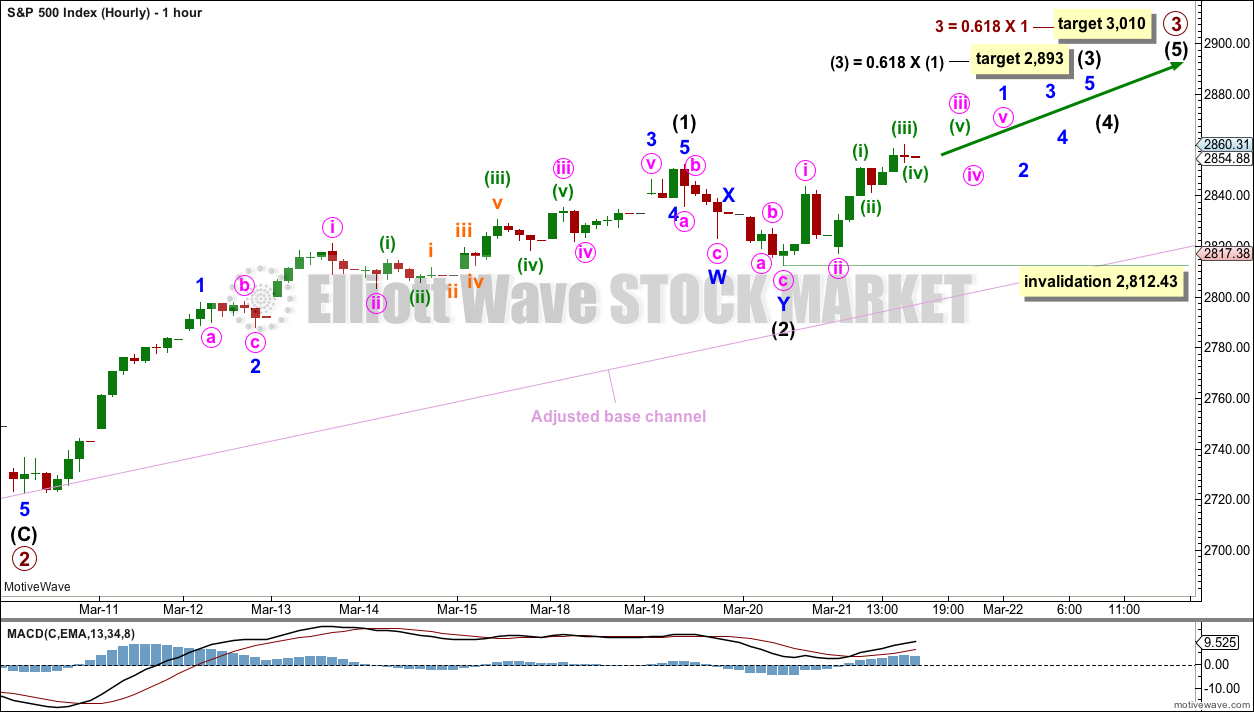
Primary wave 3 may only subdivide as an impulse. Within the impulse, intermediate waves (1) and (2) may be over.
Intermediate wave (3) may only subdivide as an impulse. Within intermediate wave (3), minor wave 1 is today labelled as incomplete. When minor wave 1 may be a complete five wave impulse, then minor wave 2 may not move beyond its start below 2,812.43.
Because of a new high the alternate wave count is invalidated today.
TECHNICAL ANALYSIS
WEEKLY CHART
Click chart to enlarge. Chart courtesy of et=”_blank”>StockCharts.com.
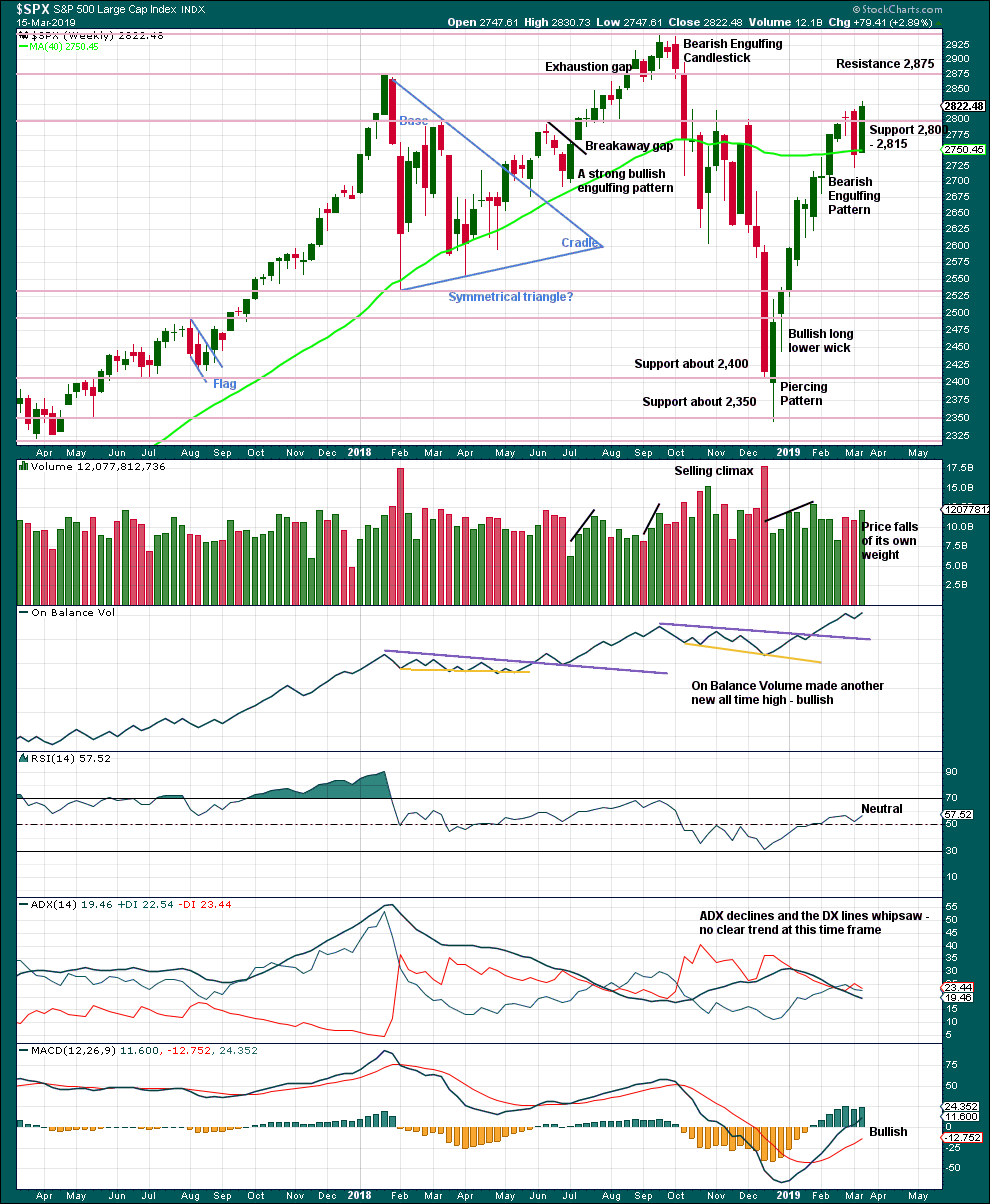
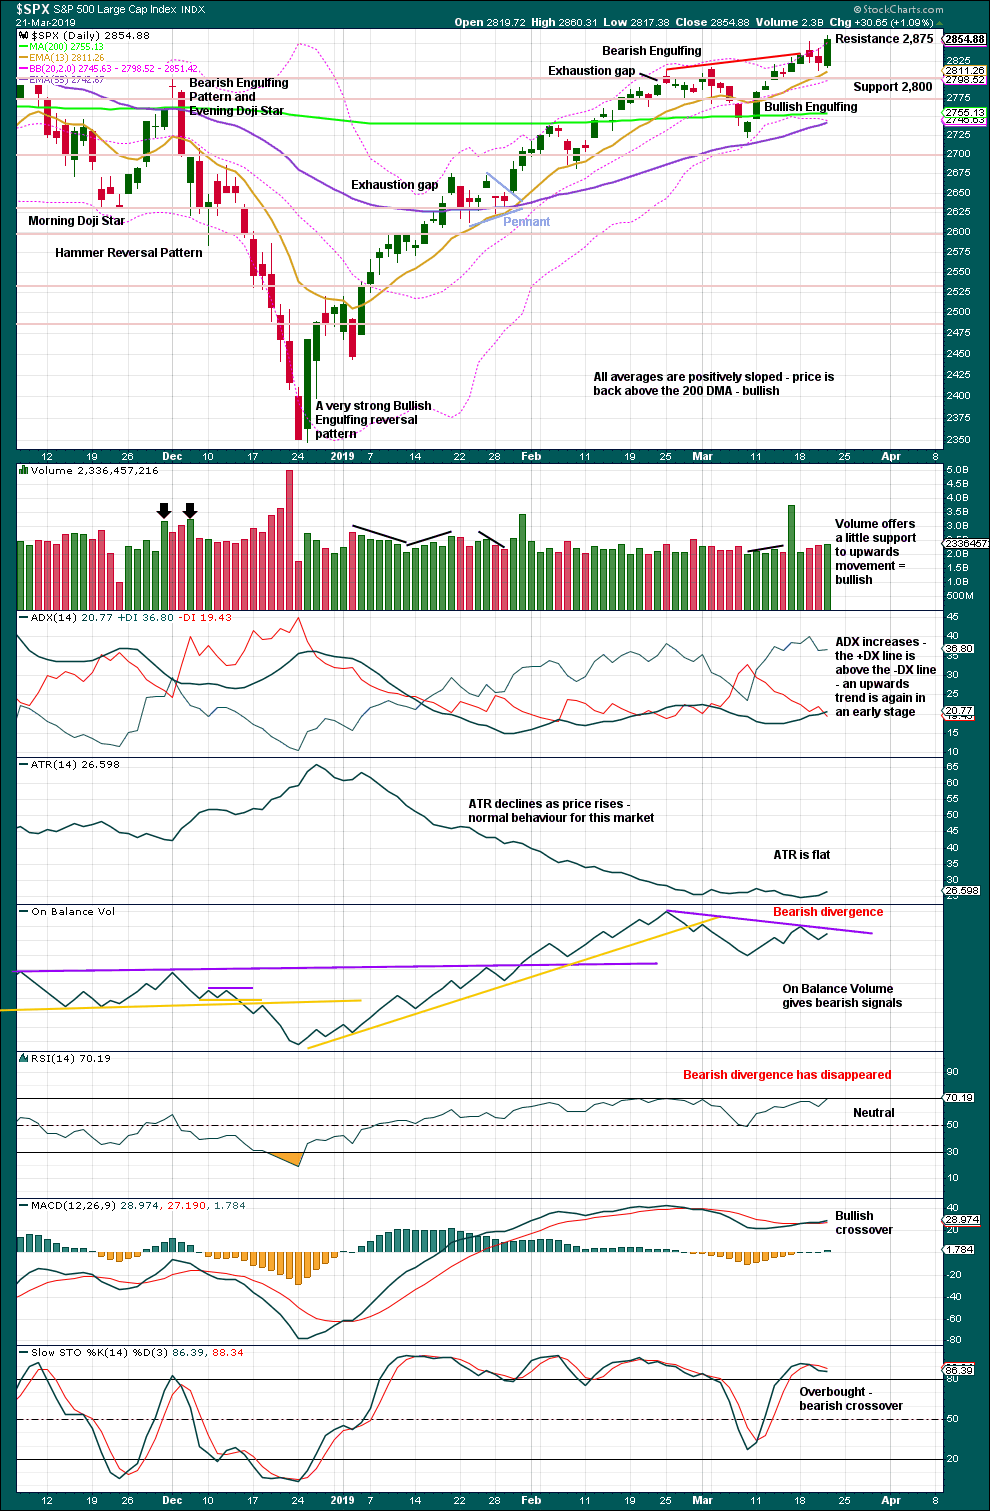
Last week has seen a sharp reversal in price. A very strong bullish candlestick has support from volume, and closes above prior resistance at 2,815. This area may now offer support.
Next resistance is 2,875 and then at 2,940.
DAILY CHART
Click chart to enlarge. Chart courtesy of StockCharts.com.
The December 2018 low is expected to remain intact. The two 90% upwards days on 26th December 2018 and 6th January 2019 indicate this upwards trend has internal strength.
A close above resistance at 2,815 on an upwards day, which has support from volume, is significant. Yesterday looks now like a successful backtest of support at prior resistance. It would now be typical to see price move up and away.
Bearish divergence between price and both of On Balance Volume and RSI remains; however, the divergence between price and RSI has today disappeared.
Stochastics may remain extreme for long periods of time when markets trend strongly. Stochastics overbought here does not indicate upwards movement should end.
There is still some room above before price finds next resistance about 2,875.
There is an upwards trend in place. A new high today supports this view.
BREADTH – AD LINE
WEEKLY CHART
Click chart to enlarge. Chart courtesy of StockCharts.com. So that colour blind members are included, bearish signals
will be noted with blue and bullish signals with yellow.
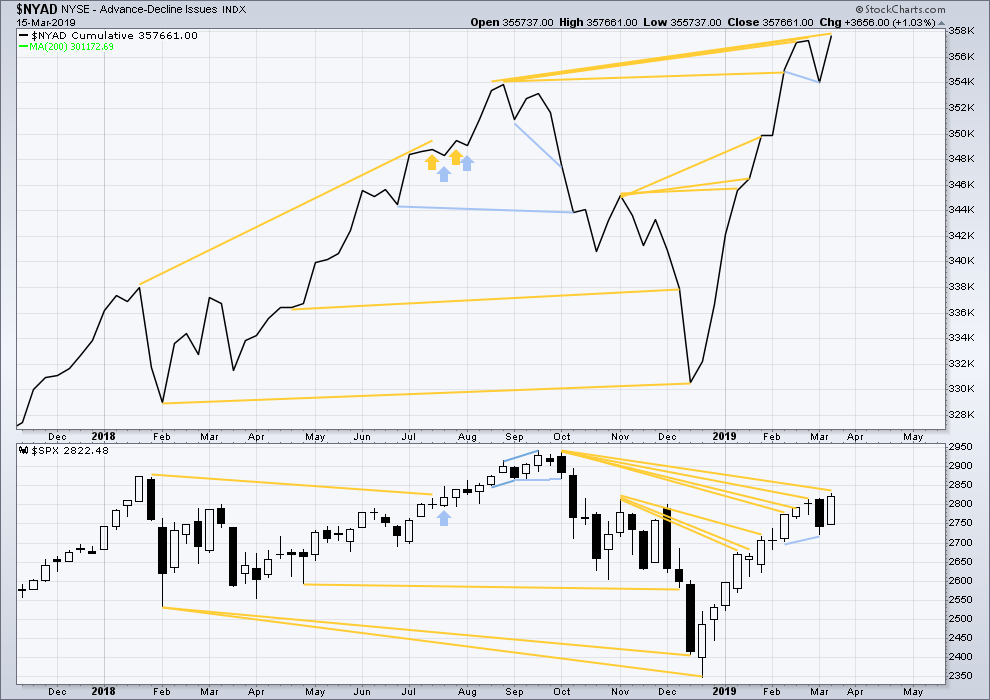
Every single bear market from the Great Depression and onwards has been preceded by a minimum of 4-6 months divergence between price and the AD line. With the AD line making a new all time high again last week, the end of this bull market and the start of a new bear market must be a minimum of 4 months away, which is mid to end June 2019 at this time.
The AD line makes a new all time high last week. Upwards movement has support from rising market breadth, and breath is rising faster than price. This is longer-term bullish divergence.
Only large caps have made new highs last week above the prior high of the 25th of February. Mid and small caps have not. This indicates some weakness in market breadth. The upwards rise may becoming selective. This would be normal towards the end of a bull market run.
DAILY CHART
Click chart to enlarge. Chart courtesy of StockCharts.com. So that colour blind members are included, bearish signals
will be noted with blue and bullish signals with yellow.
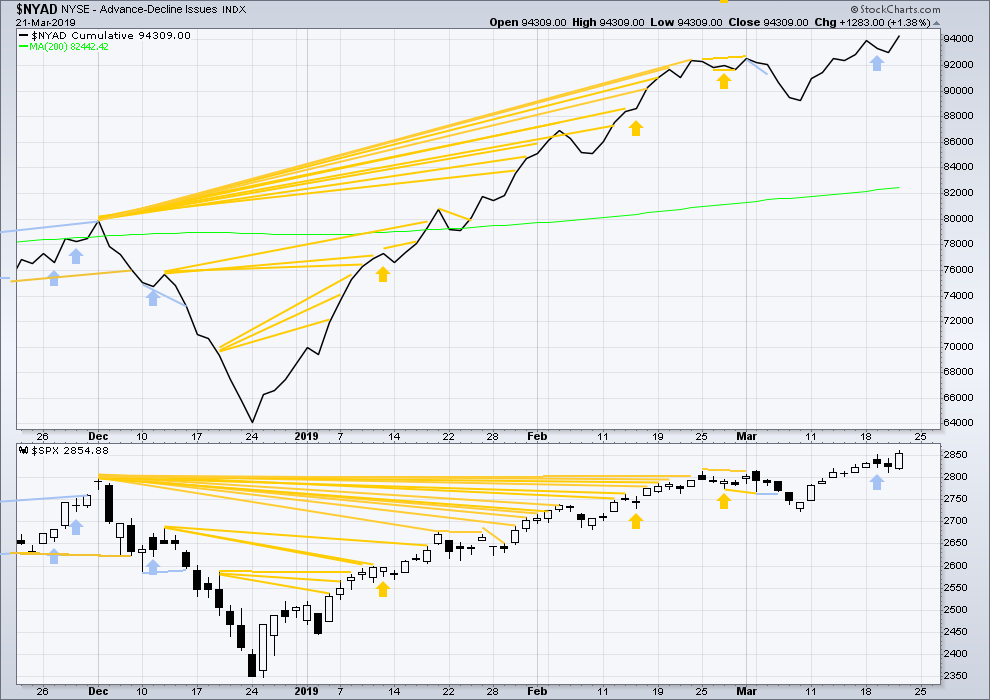
Breadth should be read as a leading indicator.
Both price and the AD line today have made new highs. Upwards movement has support from rising market breadth. There is no divergence.
VOLATILITY – INVERTED VIX CHART
WEEKLY CHART
Click chart to enlarge. Chart courtesy of StockCharts.com. So that colour blind members are included, bearish signals
will be noted with blue and bullish signals with yellow.
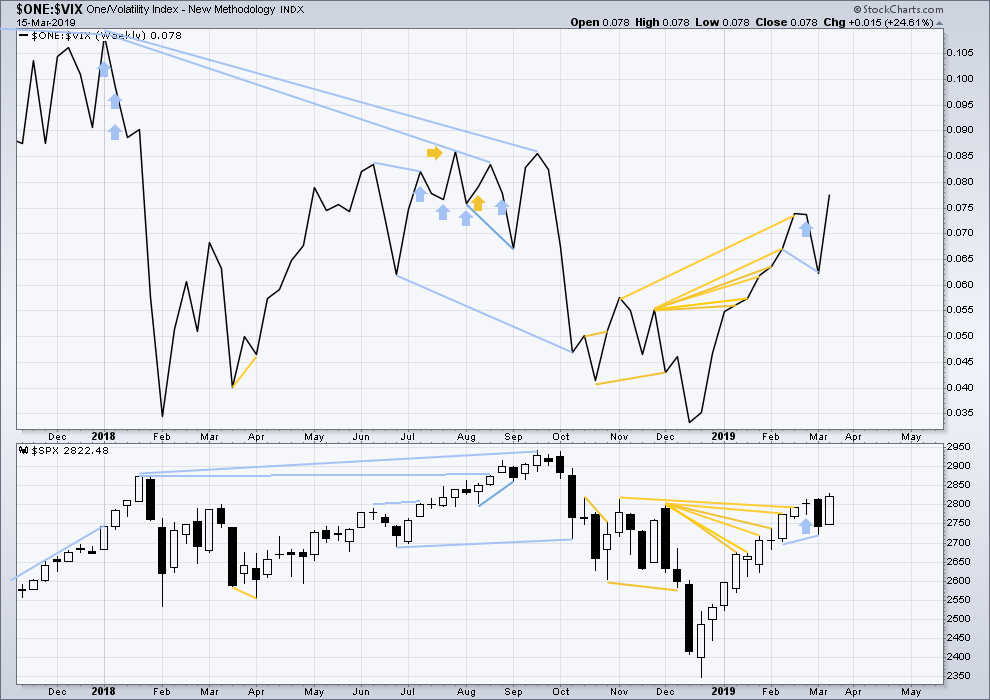
Inverted VIX has made a new short-term high and a mid-term high along with price. Upwards movement comes with a decline in VIX. There is no short nor mid-term divergence.
Longer-term divergence between price and inverted VIX at the last all time high in September 2018 remains.
DAILY CHART
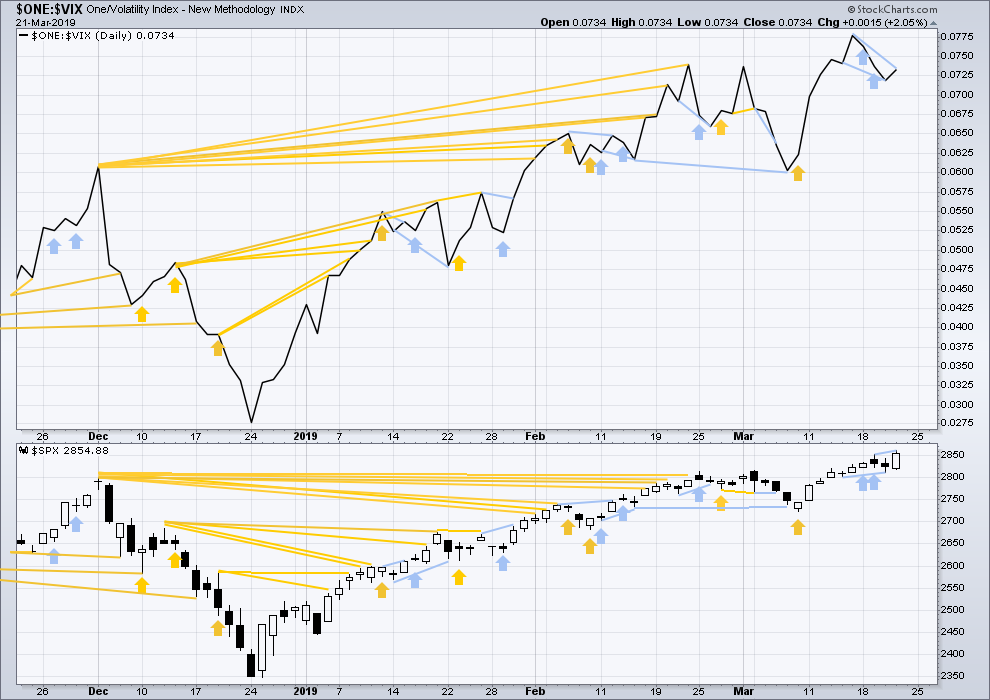
Click chart to enlarge. Chart courtesy of StockCharts.com. So that colour blind members are included, bearish signals
will be noted with blue and bullish signals with yellow.
Today price has made a new high above the high of the 15th of March, but inverted VIX has not. Upwards movement does not come with a normal corresponding decline in VIX. This divergence is bearish for the short term.
DOW THEORY
Dow Theory confirms a bear market. This does not necessarily mean a bear market at Grand Super Cycle degree though; Dow Theory makes no comment on Elliott wave counts. On the 25th of August 2015 Dow Theory also confirmed a bear market. The Elliott wave count sees that as part of cycle wave II. After Dow Theory confirmation of a bear market in August 2015, price went on to make new all time highs and the bull market continued.
DJIA: 23,344.52 – a close on the 19th of December at 23,284.97 confirms a bear market.
DJT: 9,806.79 – price has closed below this point on the 13th of December.
S&P500: 2,532.69 – a close on the 19th of December at 2,506.96 provides support to a bear market conclusion.
Nasdaq: 6,630.67 – a close on the 19th of December at 6,618.86 provides support to a bear market conclusion.
With all the indices moving now higher, Dow Theory would confirm a bull market if the following highs are made:
DJIA: 26,951.81
DJT: 11,623.58
S&P500: 2,940.91
Nasdaq: 8,133.30.
For the short term, only the S&P500 and Nasdaq have made new highs above the February 25th highs. DJIA and DJT remain lower. There is some divergence: the rise in price for the S&P500 is not mirrored across the indices.
Published @ 09:11 p.m. EST.
—
Careful risk management protects your trading account(s).
Follow my two Golden Rules:
1. Always trade with stops.
2. Risk only 1-5% of equity on any one trade.
Just to throw this out there and Im aware that no one will agree but I’m not sure that Cycle 4 is over. Just a thought
Did you see what the banksters did?!
Unbelievable!!!
Show them no mercy!!
Have a great week-end all! 🙂
Taking forum bets everyone!!
Does 2800 fall???!
Or does it hold???!
Step right up and make you bets, ladies and gents!! 🙂
In ES numbers, I vote for no 2800 fail. I do like a 2804 level. That is the level setup by this 2 day fib extension that we just watched. Today’s low was 2805.25. I like 2804 because I believe that there is a higher target that we haven’t reached. So, no need to pull all the way back to 2796.25, which is the 50% retracement from this month’s low to this month’s high.
If we rip through 2804, that would be my line in the sand. That’s where I convert from a short term bull to a bear. When they hit the fib extension levels there’s not much of a smoke screen that they put out. It’s kind of a touch and go thing. So, I’m a believer until just slightly lower than 2804. I do plan to trade at 2804.25 with a nice tight stop.
And that’s my bias. It’s a “higher target” bias. I guess I have to own it.
Updated hourly chart:
The wave count was invalidated.
I should have considered this as an alternate idea.
Intermediate (2) may now be a completed expanded flat correction. These are fairly common structures, although they more often turn up in B wave positions.
Price is bouncing up right at the lower edge of the best fit channel. This looks like intermediate (2) may have ended there.
Thank you, Lara! C of (2) looks incomplete to my eye at the moment, but the trend line support you point out is pretty compelling. I sure do appeciate your guidance!!!
Trend change
nyet.
Well, it did trade to 2828.50. Just before it dropped like a frozen anvil.
🙁
Back to the drawing board
That looks like a hallmark of a break a way gap to the downside.
Not good folks
lets see if lara is right here
ATM, I’m suspecting a low-degree 3-wave bounce underway. (All usual disclaimers apply, of course.)
Counting a bit different. Thinking a fourth with a an extended fifth down needed to convince me this is the real deal…. 🙂
One thing’s for sure. We are not going to end this session quietly! 🙂
Moment of truth.
The next wave down needs to decisively smash 2800 to smithereens, into a billion irretrievable fragments. If it does not, the banksters are still baiting bearish trades and you can take that to the bank!
Has anyone else noticed how traders are being repeatedly spoofed with phony candlestick patterns? After that massive bullish engulfing candle yesterday, who would have thunk it about today’s decline? Does anyone really think this is all co-indicence?
Trading is war…!
The art of war includes deception…!
Great book that outlines this exact behaviour…
The 48 Laws of Power – Sep 1 2000
by Robert Greene (Author), Joost Elffers (Contributor)
*thumbs up
Thank you so much for that recommendation.
Can’t wait to read it!
I cannot tell you often I get a rolling of the eyes when I express the opinion above. Of course, I have been trading awhile, lol!
I am often struck by the low efficacy of simple candlestick patterns. I find they “fail” all the time, and I give them relatively little weight. I don’t think there’s any study that supports their efficacy with good statistical science (and no, looking at 100-200 instances is NOT CLOSE to sufficient. Talk to me when you’ve got 30,000 data points, minimum).
There is a very good reason why they have become less reliable!
Have you ever heard of the study of mice on different continents solving similar mazes?
Damn expanding triangles. Rob Smith
@robintheblack had this one nailed.
Wow, haven’t seen one
Bull flag in VIX suggesting the bears are going to take a bit out of the banksters’ hide…hehe!
That is one huge dogfight going on over the 2800 support shelf.
You probably want to stay away from that fight until there is a clear victor! 🙂
Hey where’s Mr. ChartMonkey? Your long time 2860 pivot high call…current high 2860.31. Okay you revised that to 2872 a day or two ago but you still get 95% credit.
Bada-bing!
Thanks Kevin, that’s very kind of you. The only correlation between those 2 values is methodology. ES (June contract) 2872 is still there and waiting to get tagged.
Also, I have updated my possible Indian name. In the tribe I shall now be known as Falling Knife.
And his stalwart sidekick, David Bowie! 🙂
As long as price remains above 2800, I would have to consider this move down nothing but bear bait. This is why I love trading spreads in this treacherous market.
I had given up and left for dead SPY 281 puts left over from a bull put credit spread (281/283) expiring to day.
They were literally trading for around 0.07 at the close yesterday.
Glad I held onto ’em! 🙂
Traders who chased the ramp yesterday and remain long are most certainly going to exit on any break of 2800. Things could get really interesting if that happens…
This could be start of Primary 2 down
OR, a massive “C”……
Yep.
So far, they are defending the 2800 pivot.
They now have only two choices.
Re-deploy leverage to defend the pivot, in which case we bounce higher from here, or uwind the leveraged trade that took us past the pivot initially.
Their choice will be obvious…!
Watch SPX 2800. That is the next “Leverage Pivot”.
Rat-a-tat-a-tat!!
RUT appears to be in an ABC 2 down (retracing the Dec low to March high 1). Could hold in the 1500 area, or perhaps the 1475 area where the are multiple overlapped fibo’s.
or maybe it even ends up in a few days down at the 62% around 1396.
The RUT Advance/Decline #’s for the moment are…106-1788.
SPX is 79-423.
NDX is 5-98.
if its gonna turn back up it should be here and now…..
Can’t look at this and not think “this sure appears to be massive churning”. Which is typical at major market tops.
yes, waiting for an a-b-c rally to be short
And it certainly is not gaining upwards momentum as expected in a 3rd wave.
Probably reading is that wave (2) (circled) is not finished, and yesterday was just the top of a B wave.
(I overlap my count in red above Lara’s current hourly chart)
Primary 2 down as an expanding flat. Seems quite possible, very nice.
I like it.
I’m going to publish this idea as an alternate today.
Looking at Lowry’s supply and demand data, it has to be judged to have a low probability. So, an alternate.
Beware the Banksters! 🙂
With this kind of up & down move, seems like some kind of ED in play, maybe it stops this down move in 20s and then another high in 70s…
Think L-E-V-E-R-A-G-E…!
This market is funny ?
With today’s downward gap open and move below 2843, the hourly count will need to be modified. I am not sure what form it will take.
The daily SPX count needs to hold above 2812.43. Any penetration of that level requires an adjustment to the daily count.
Note: I have not said they are or will be invalidated. I have just indicated the hourly needs to be adjusted and the daily will need to be adjusted at 2812.
don’t know about the count but 2822 is a 78% retrace level and has solid potential to turn SPX back around.
the reversal here in RUT is pretty dramatic. That said…it hasn’t busted key swing lows…yet.
Ready to ride wave 3!
They ought to name a roller coaster The Third Wave!