
Downwards movement remains well above the invalidation point and the lower edge of the channel on the main Elliott wave daily chart.
Summary: A close above resistance at 2,815 (November 2018 highs) on an upwards day with support from volume is a classic upwards breakout.
A third wave up may now gather strength. A new mid term target is at 3,010. The final target remains the same at 3,045.
If price breaks below the adjusted base channel on the main daily chart, then consider the possibility that a deeper pullback may be underway. The first target would be at 2,658. The second target would be at 2,540.
New updates to this analysis are in bold.
The biggest picture, Grand Super Cycle analysis, is here.
Last published monthly charts are here. Video is here.
ELLIOTT WAVE COUNTS
WEEKLY CHART
Click chart to enlarge.
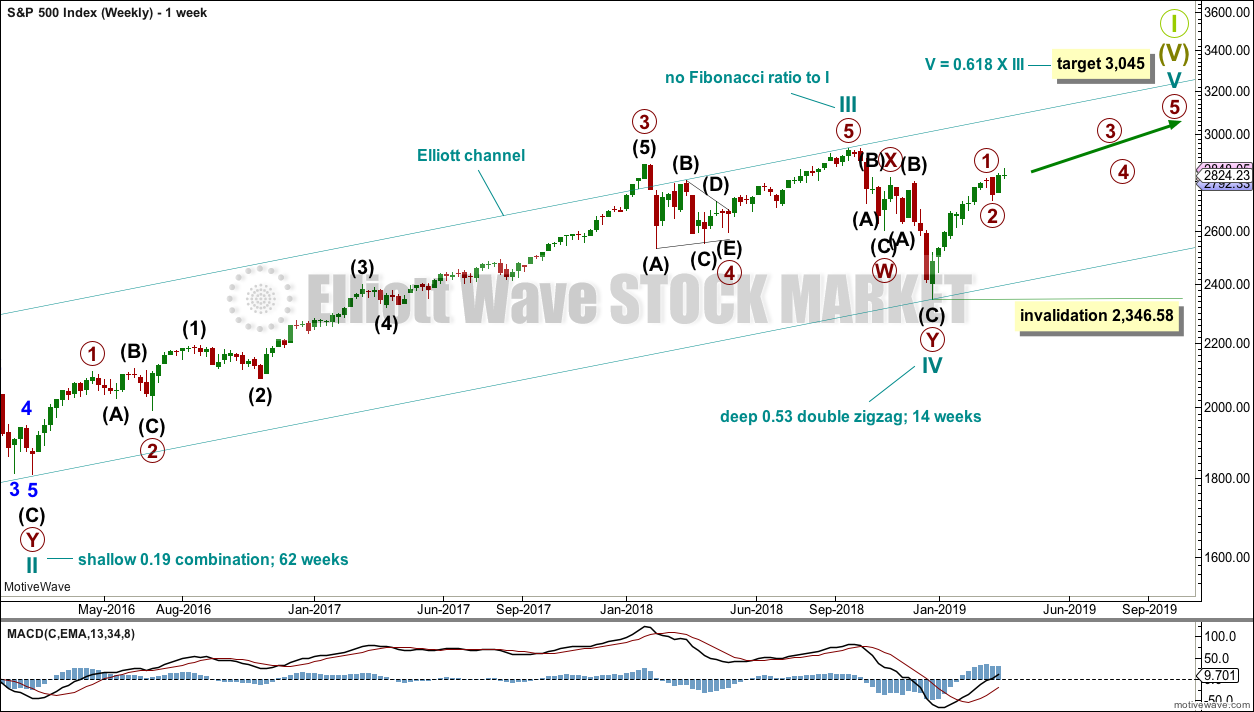
This weekly chart shows all of cycle waves III, IV and V so far.
Cycle wave II fits as a time consuming double combination: flat – X – zigzag. Combinations tend to be more time consuming corrective structures than zigzags. Cycle wave IV has completed as a multiple zigzag that should be expected to be more brief than cycle wave II.
Cycle wave IV may have ended at the lower edge of the Elliott channel.
Within cycle wave V, no second wave correction may move beyond the start of its first wave below 2,346.58.
Although both cycle waves II and IV are labelled W-X-Y, they are different corrective structures. There are two broad groups of Elliott wave corrective structures: the zigzag family, which are sharp corrections, and all the rest, which are sideways corrections. Multiple zigzags belong to the zigzag family and combinations belong to the sideways family. There is perfect alternation between the possible double zigzag of cycle wave IV and the combination of cycle wave II.
Although there is gross disproportion between the duration of cycle waves II and IV, the size of cycle wave IV in terms of price makes these two corrections look like they should be labelled at the same degree. Proportion is a function of either or both of price and time.
Draw the Elliott channel about Super Cycle wave (V) with the first trend line from the end of cycle wave I (at 2,079.46 on the week beginning 30th November 2014) to the high of cycle wave III, then place a parallel copy on the low of cycle wave II. Cycle wave V may find resistance about the upper edge.
It is possible that cycle wave V may end in October 2019. If it does not end there, or if the AD line makes new all time highs during or after June 2019, then the expectation for cycle wave V to end would be pushed out to March 2020 as the next possibility. Thereafter, the next possibility may be October 2020. March and October are considered as likely months for a bull market to end as in the past they have been popular. That does not mean though that this bull market may not end during any other month.
MAIN WAVE COUNT
DAILY CHART
Click chart to enlarge.
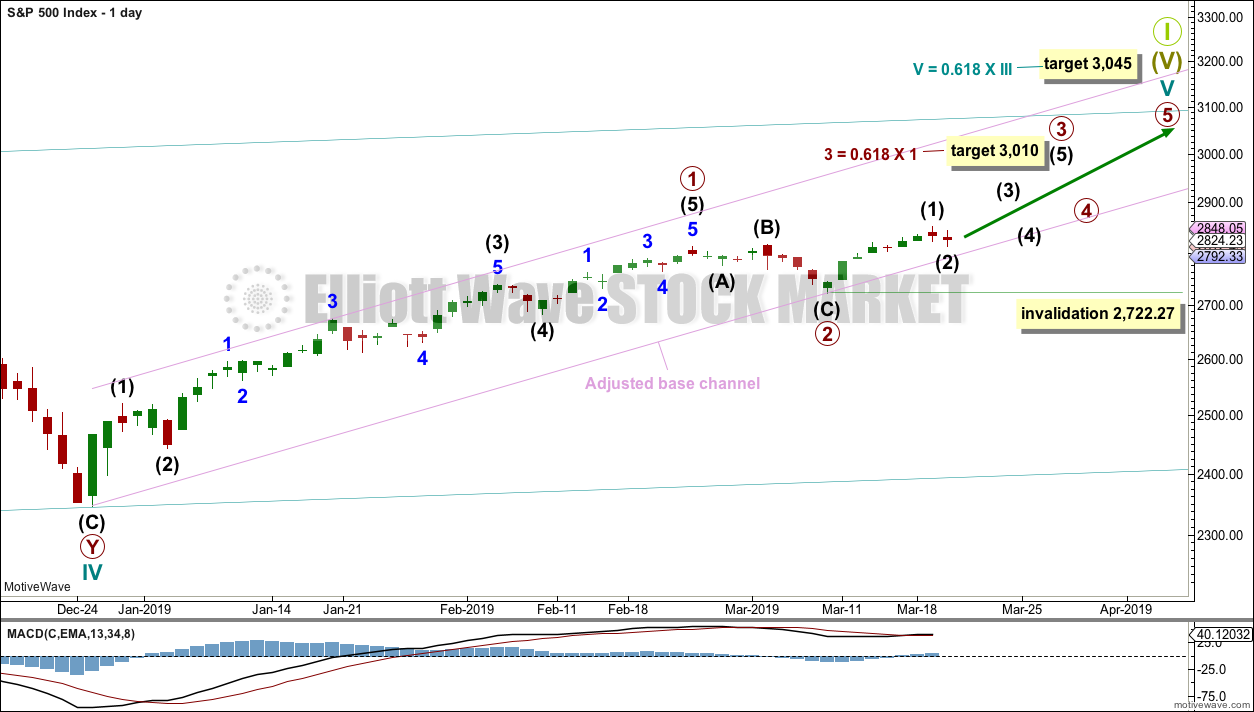
The daily chart will focus on the structure of cycle wave V.
Within Super Cycle wave (V), cycle wave III may not be the shortest actionary wave. Because cycle wave III is shorter than cycle wave I, this limits cycle wave V to no longer than equality in length with cycle wave III at 3,477.39. A target is calculated for cycle wave V to end prior to this point.
Cycle wave V must subdivide as a five wave motive structure, either an impulse or an ending diagonal. An impulse is much more common and that will be how it is labelled. A diagonal would be considered if overlapping suggests it.
Price has closed above resistance, which was about 2,815, on an upwards day with support from volume. This classic upwards breakout above resistance indicates underlying strength. This may be the early stage of a third wave. Primary waves 1 and 2 may both be over. Primary wave 2 may have been a very brief and shallow expanded flat correction.
Primary wave 3 may now exhibit an increase in upwards momentum. A target is calculated that fits with the higher target for cycle wave V to end.
Within primary wave 3, no second wave correction may move beyond the start of its first wave below 2,722.27.
The lower edge of the adjusted base channel may provide support for pullbacks along the way up. If price breaks below the lower edge of this channel, then the alternate wave count below should be considered.
HOURLY CHART
Click chart to enlarge.
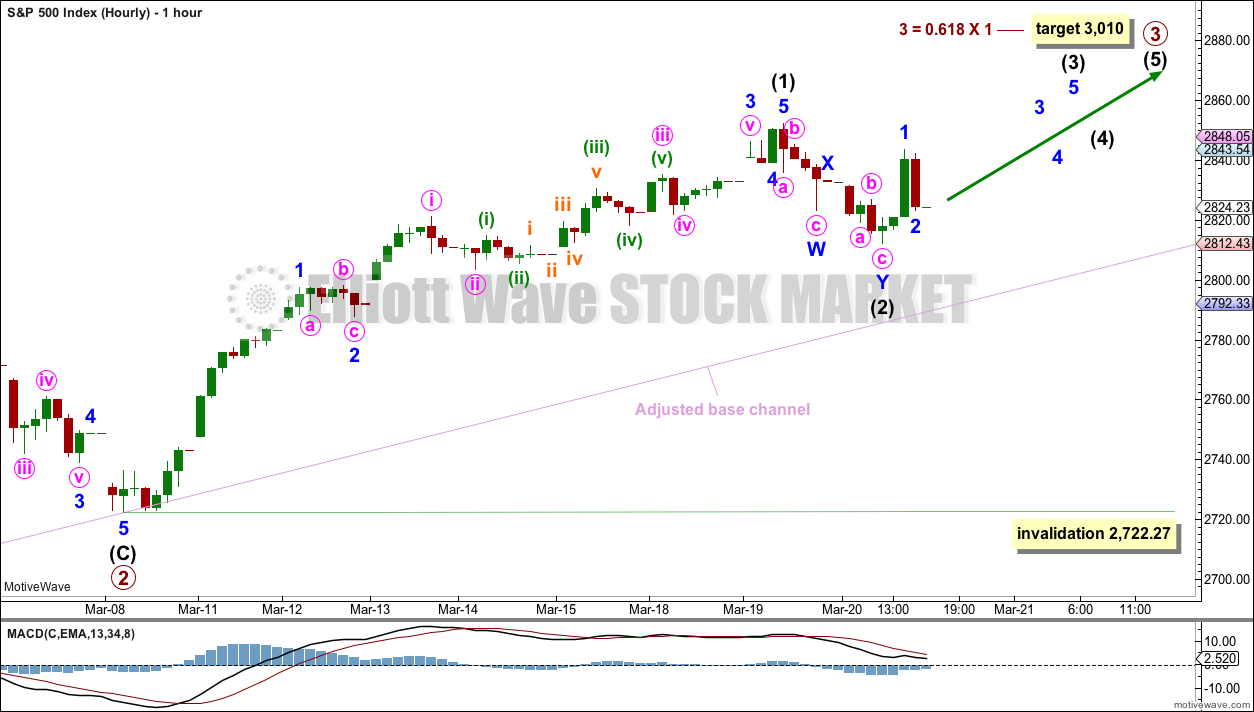
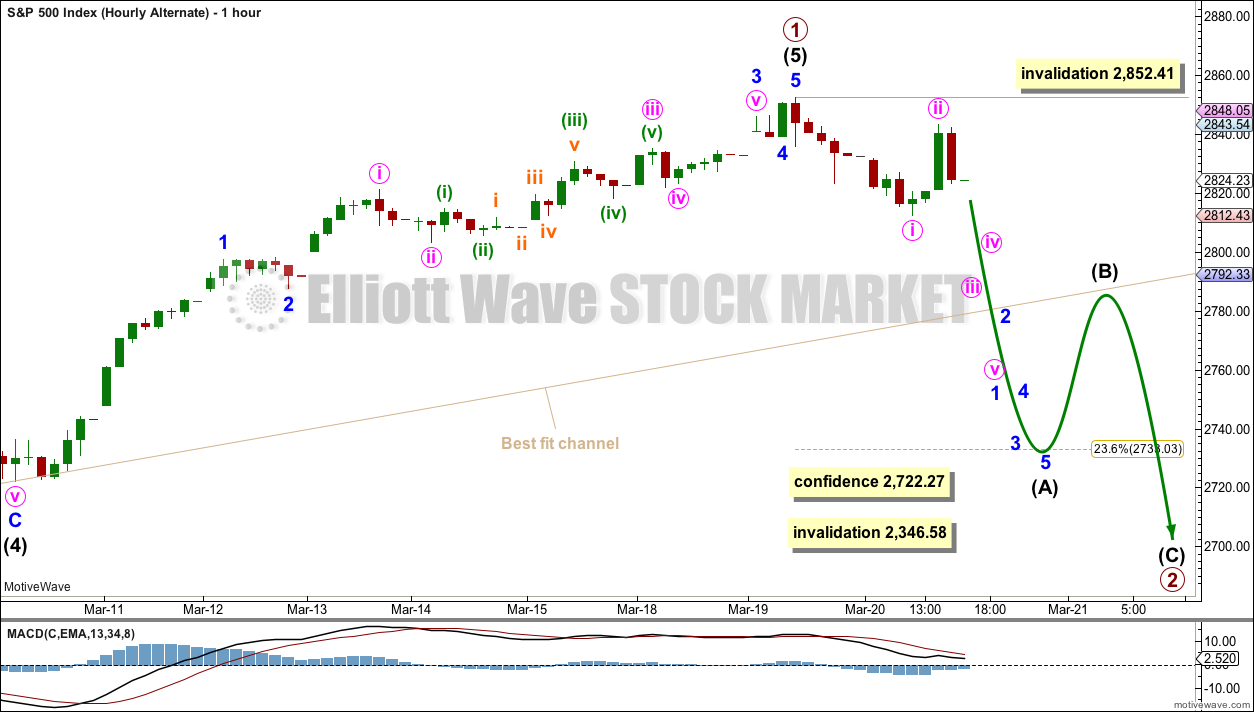
Primary wave 3 may only subdivide as an impulse. Within the impulse, intermediate wave (1) may have been over at yesterday’s high.
It is also possible that intermediate wave (2) is now over as a double zigzag. The subdivisions fit well in the five minute chart and the depth now gives it a reasonable proportion.
This wave count now expects a third wave at three degrees to begin tomorrow.
If intermediate wave (2) continues lower, then it should find strong support about the lower edge of the base channel. A breach of this channel by a full hourly candlestick below and not touching the lower edge may be taken as an indication that this main wave count may be wrong and the alternate below may be right.
Assume the trend remains the same. Assume the upwards trend remains intact until proven otherwise.
ALTERNATE WAVE COUNT
DAILY CHART
Click chart to enlarge.
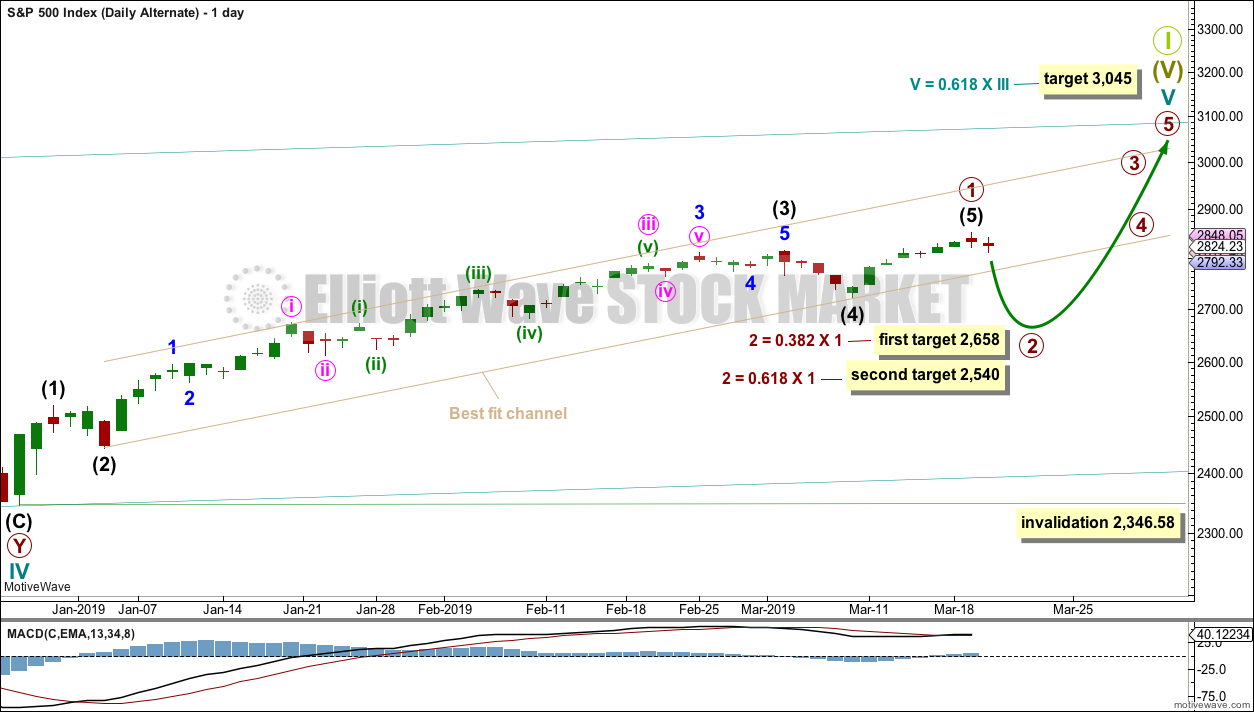
It is possible that primary wave 1 may have been over at yesterday’s high and that primary wave 2 may have begun.
Two targets are calculated for primary wave 2. If price reaches the first target and the structure of primary wave 2 is incomplete, or if price keeps falling through the first target, then the second target may be used.
Primary wave 2 may not move beyond the start of primary wave 1 below 2,346.58.
HOURLY CHART
Click chart to enlarge.
If primary wave 2 has begun, then it should begin with a five down on the hourly chart. Today this is labelled incomplete as minor wave 1. Minor wave 2 may not move beyond the start of minor wave 1 above 2,852.41.
This alternate wave count does not have good support from classic technical analysis. It is presented only as an outside possibility.
TECHNICAL ANALYSIS
WEEKLY CHART
Click chart to enlarge. Chart courtesy of et=”_blank”>StockCharts.com.
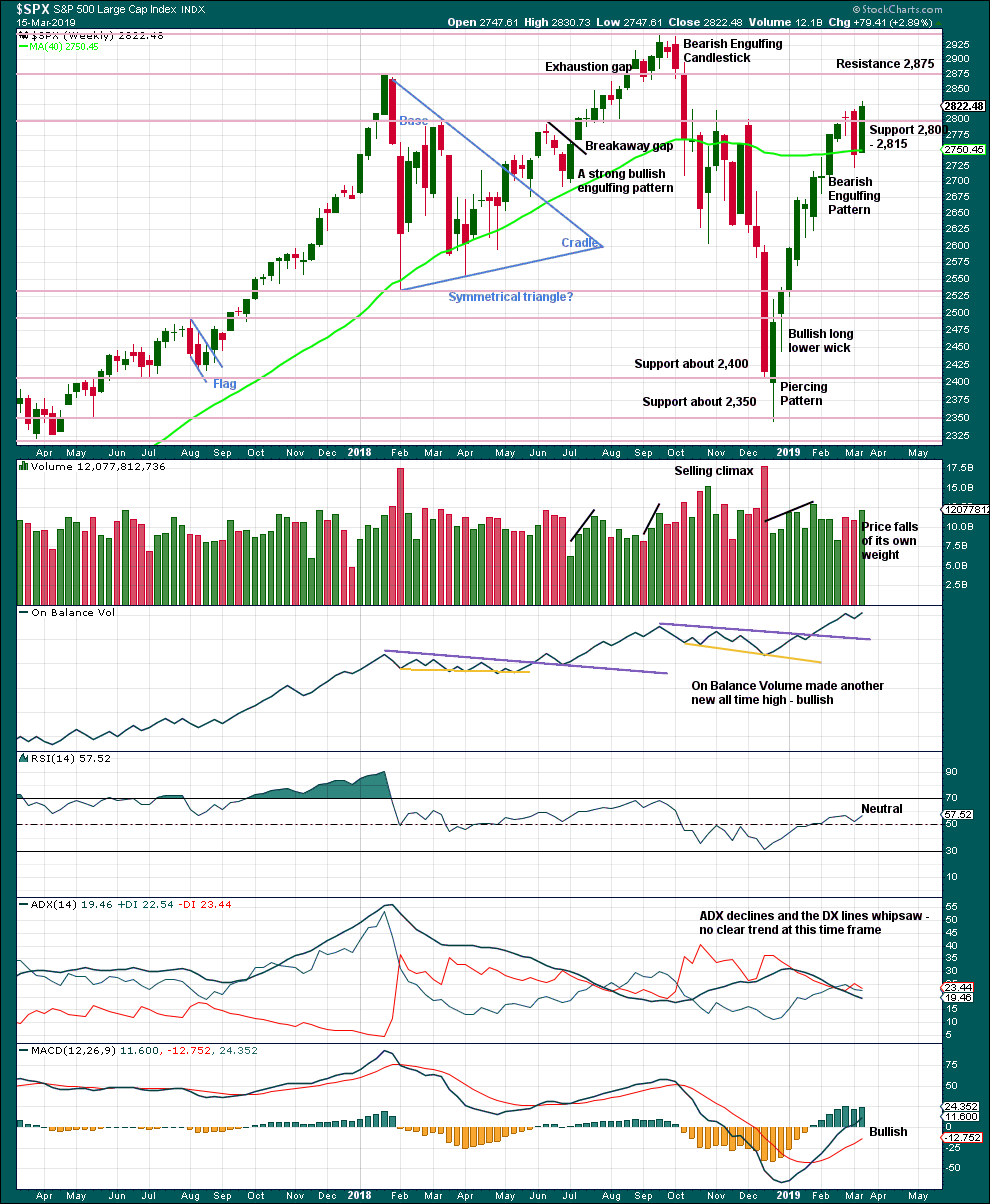
Last week has seen a sharp reversal in price. A very strong bullish candlestick has support from volume, and closes above prior resistance at 2,815. This area may now offer support.
Next resistance is 2,875 and then at 2,940.
DAILY CHART
Click chart to enlarge. Chart courtesy of StockCharts.com.
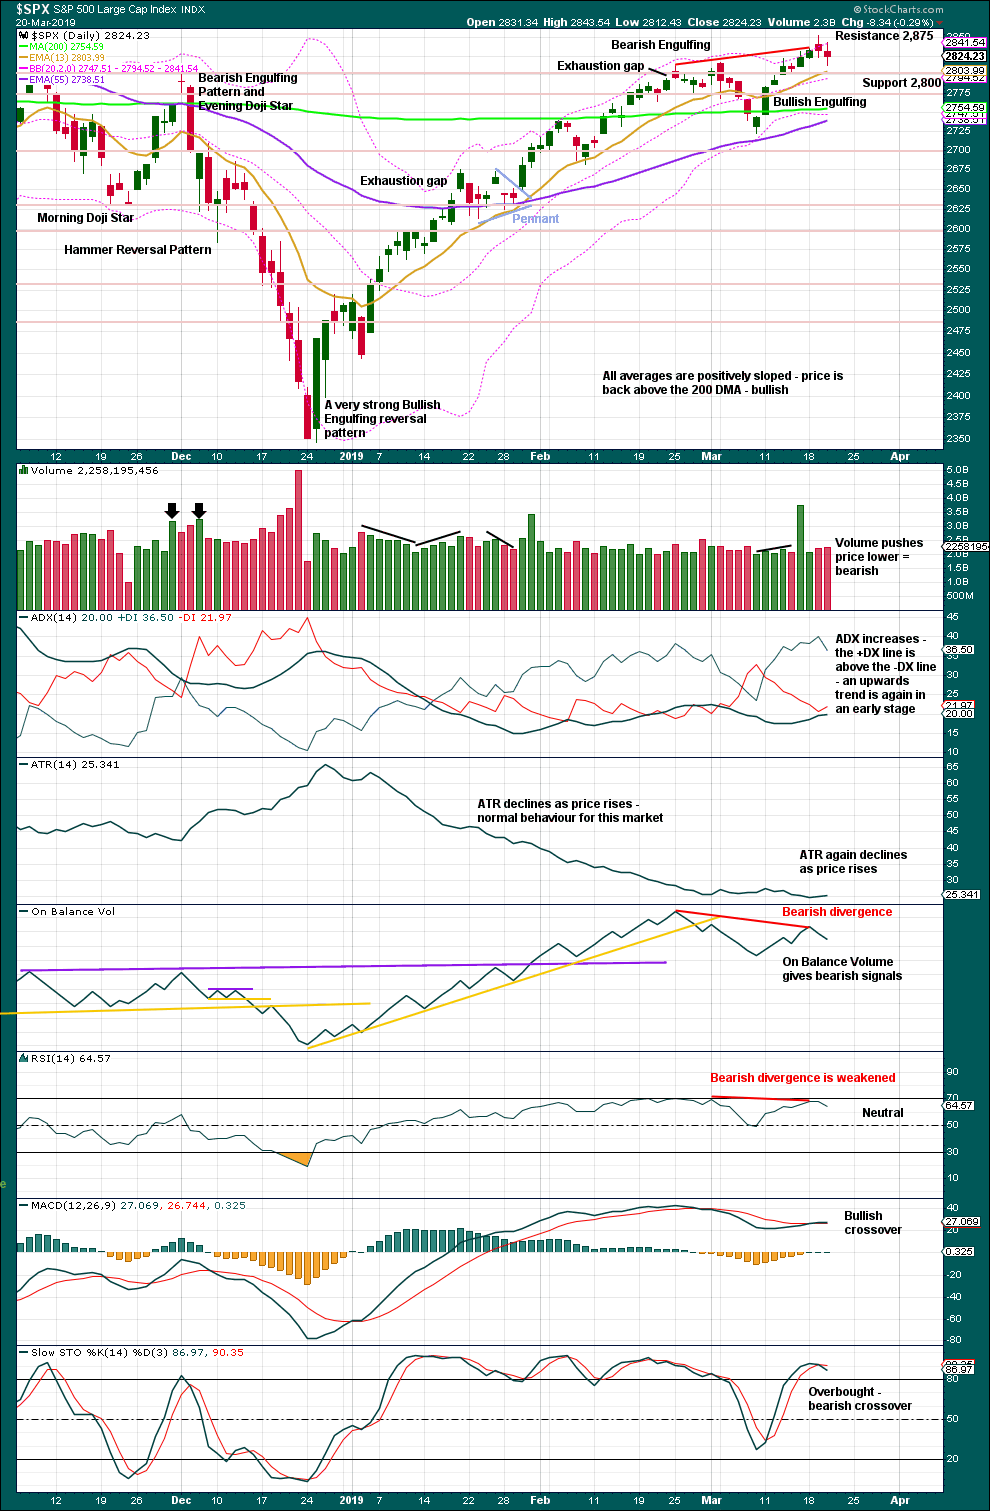
The December 2018 low is expected to remain intact. The two 90% upwards days on 26th December 2018 and 6th January 2019 indicate this upwards trend has internal strength.
A close above resistance at 2,815 on an upwards day, which has support from volume, is significant. Look for support now about 2,815; this may force any pullbacks here to be again brief and shallow.
Bearish divergence between price and both of On Balance Volume and RSI remains; however, the divergence between price and RSI is now very weak and has almost disappeared.
Stochastics may remain extreme for long periods of time when markets trend strongly. Stochastics overbought here does not indicate upwards movement should end.
There is still some room above before price finds next resistance about 2,875.
Although volume offers some support today for downwards movement, the range is small and Lowry’s data indicates no change in selling pressure. This indicates any pullbacks here may continue to be relatively brief and shallow. This supports the main Elliott wave count.
BREADTH – AD LINE
WEEKLY CHART
Click chart to enlarge. Chart courtesy of StockCharts.com. So that colour blind members are included, bearish signals
will be noted with blue and bullish signals with yellow.
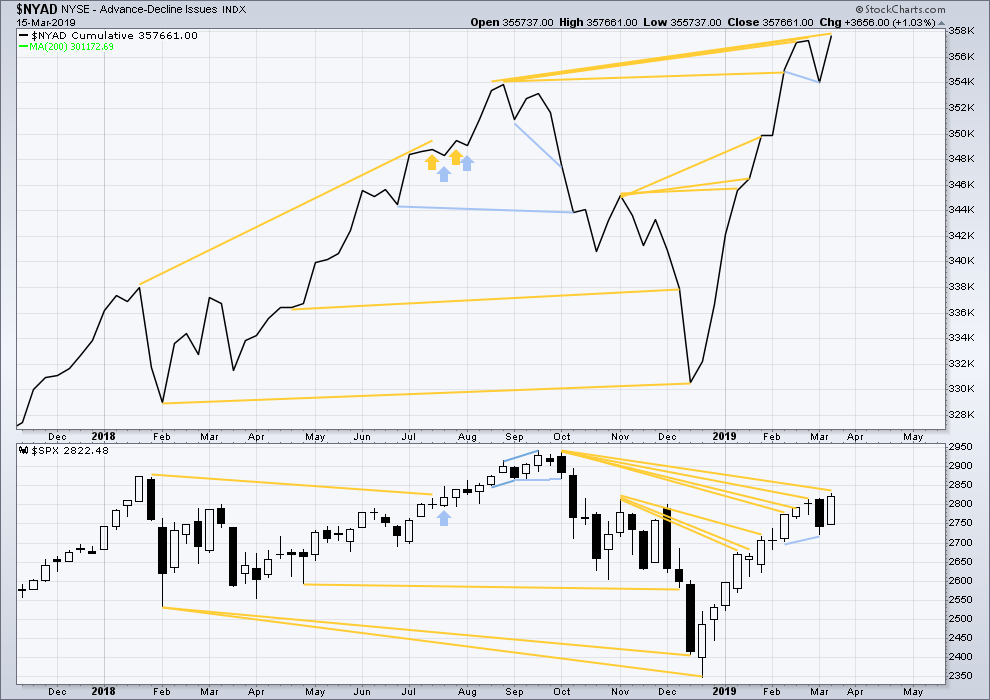
Every single bear market from the Great Depression and onwards has been preceded by a minimum of 4-6 months divergence between price and the AD line. With the AD line making a new all time high again last week, the end of this bull market and the start of a new bear market must be a minimum of 4 months away, which is mid to end June 2019 at this time.
The AD line makes a new all time high last week. Upwards movement has support from rising market breadth, and breath is rising faster than price. This is longer-term bullish divergence.
Only large caps have made new highs last week above the prior high of the 25th of February. Mid and small caps have not. This indicates some weakness in market breadth. The upwards rise may becoming selective. This would be normal towards the end of a bull market run.
DAILY CHART
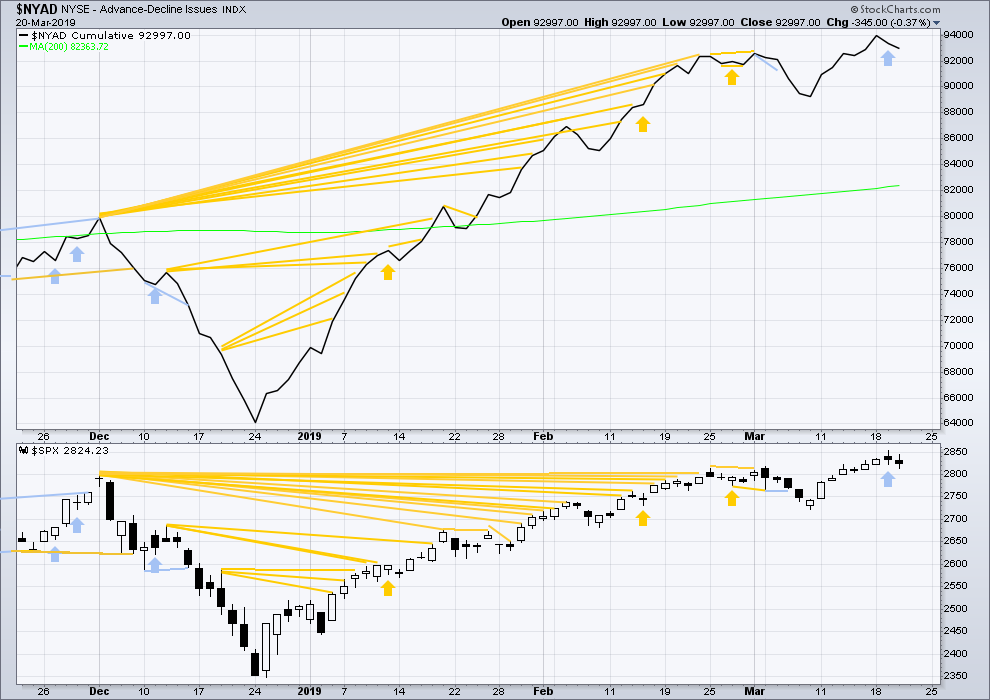
Click chart to enlarge. Chart courtesy of StockCharts.com. So that colour blind members are included, bearish signals
will be noted with blue and bullish signals with yellow.
Breadth should be read as a leading indicator.
Both price and the AD line have moved lower today. Downwards movement has support from declining breadth, but breadth is not falling any faster than price. There is no short-term divergence.
VOLATILITY – INVERTED VIX CHART
WEEKLY CHART
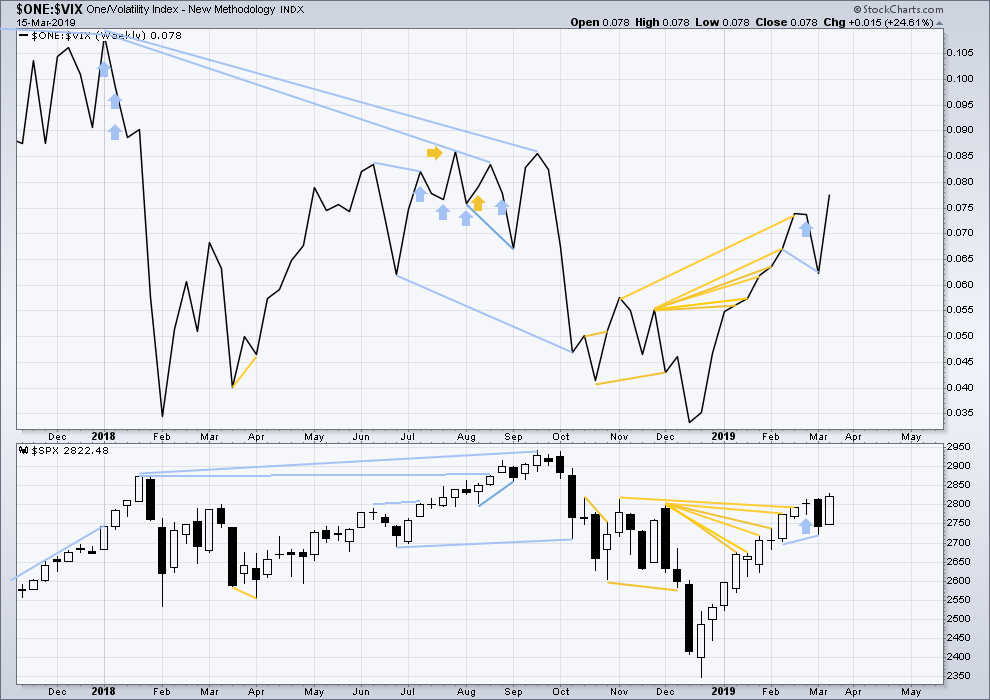
Click chart to enlarge. Chart courtesy of StockCharts.com. So that colour blind members are included, bearish signals
will be noted with blue and bullish signals with yellow.
Inverted VIX has made a new short-term high and a mid-term high along with price. Upwards movement comes with a decline in VIX. There is no short nor mid-term divergence.
Longer-term divergence between price and inverted VIX at the last all time high in September 2018 remains.
DAILY CHART
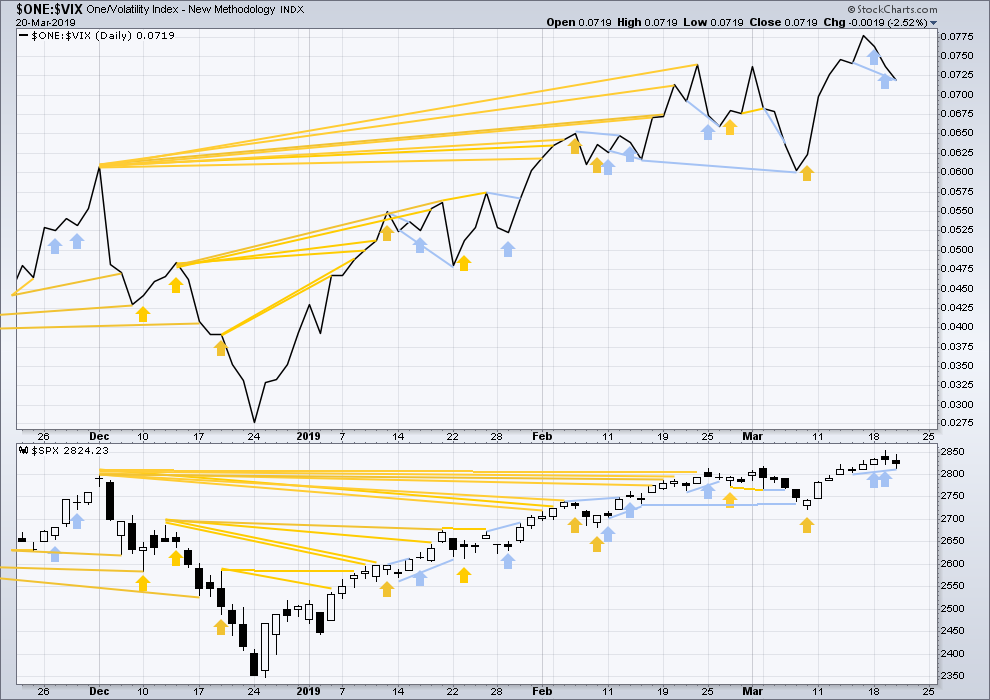
Click chart to enlarge. Chart courtesy of StockCharts.com. So that colour blind members are included, bearish signals
will be noted with blue and bullish signals with yellow.
Both price and inverted VIX have moved lower today. Inverted VIX has made a new short-term low below the prior low of 14th of March, but price has not. This divergence is bearish and short term.
DOW THEORY
Dow Theory confirms a bear market. This does not necessarily mean a bear market at Grand Super Cycle degree though; Dow Theory makes no comment on Elliott wave counts. On the 25th of August 2015 Dow Theory also confirmed a bear market. The Elliott wave count sees that as part of cycle wave II. After Dow Theory confirmation of a bear market in August 2015, price went on to make new all time highs and the bull market continued.
DJIA: 23,344.52 – a close on the 19th of December at 23,284.97 confirms a bear market.
DJT: 9,806.79 – price has closed below this point on the 13th of December.
S&P500: 2,532.69 – a close on the 19th of December at 2,506.96 provides support to a bear market conclusion.
Nasdaq: 6,630.67 – a close on the 19th of December at 6,618.86 provides support to a bear market conclusion.
With all the indices moving now higher, Dow Theory would confirm a bull market if the following highs are made:
DJIA: 26,951.81
DJT: 11,623.58
S&P500: 2,940.91
Nasdaq: 8,133.30.
For the short term, only the S&P500 and Nasdaq have made new highs above the February 25th highs. DJIA and DJT remain lower. There is some divergence: the rise in price for the S&P500 is not mirrored across the indices.
Published @ 10:10 p.m. EST.
—
Careful risk management protects your trading account(s).
Follow my two Golden Rules:
1. Always trade with stops.
2. Risk only 1-5% of equity on any one trade.
I’m curious about everyone’s perspective on how far we have come and the wave we are in and it’s upside potential
Let’s say we hit all time highs at 3050
That’s 200 points
About 6-7% from here
But if this is the last leg of a giant bull market
Isn’t that picking up pennies in front of a bulldozer at this point ?
Granted most all of us are shorter term traders..
But after a 500 point move and in the past couple weeks another 130 point bounce …
When do you start tightening things up and looking for the larger picture move and start layering in preparations in mid time frames 3-6 months for the beginning of the big bear and end of the bull
Or will it just never end?
Will there always be a labeling to be redone that keeps it going on for ever and ever ?
I was just thinking about where this last couple hundred points fits in with folks ….
Especially with the strength and verticality this last impulse is looking like
Always money to be made in very short terms…
But I want to start looking at how to play for the bigger move now…
Scott,
The beautiful thing about this is that we already know where the turn point is.
Lara told us, it’s 3045. How great is that to know!
When big bear happens, there will be plenty of opportunity to get in. Between now and then, I plan to trade clear and logical signals that the market gives off.
Remember Lara has given an Alternate Monthly count which has the next target for the bull market at 3400+ and that itself would not be the end. I favor this alternate for several reasons.
Sometimes…sometimes…
A bit earlier I put on a largish (for me) long trade on SPX via one of the leveraged funds. I use the UPRO/SPXU pair.
Except I entered SPXU instead of UPRO, notice the price seemed “odd”, bought anyway, noticed a bit later that instead of a very small profit showing, there was a very small loss, didn’t investigate…then a bit later a larger loss, and only THEN did I realize that I’m an idiot.
Well, I didn’t lose very much but damn…CHECK, RECHECK, QUESTION EVERYTHING. Make sure it’s right. It’s real money.
Okay, onward…
yeah I keep it simple so as to not mess it up: SPXL and SPXS
Kevin, you are so honest and transparent even when you are showing your boo-boo’s. It happens to the best of us, well, at least to me too. Sometimes, for sure in my case, it indicates a time to head for the mountains and some relaxation. Today has been a good day for me, printing green on all accounts (and I might add, meaningful green).
I actually make sure I do confirmations of each and every trade and position after each execution
To make sure what is in my account is what I thought it was
because of a similar circumstance a while back when I started complex options positions
It’s so easy for errors with strikes and underlying
It’s a good reminder Kevin
Thx for sharing
And especial thanks for all your hard work and contributions
Well played there Rodney, exceptional timing.
I notice volume is on the low side today. Gives this super high momentum action a bit of a short squeeze feel to it. Extremely bullish WC though, and there “should be” follow through.
Yeah man, butterfingers clerical errors. Been there, done that.
Again, the alternate is invalidated. The main wave count is correct.
The invalidation point is moved up. If I move the degree of labelling within intermediate (3) down one degree, and so if minor 1 is completing and then minor 2 is yet to begin, minor 2 may not move beyond the start of minor 1.
Now that resistance is clearly overcome, and a back test is successful, look for upwards movement to gather momentum.
A likely scenario, based on past practice, would be for ES price to plateau around 2867 then back off to around 2857 before the push to 2872 (plus a few higher).
The lesson here is not to panic, and start thinking that the math is wrong, and end up with a not-so-great entry.
see a lot of resistance at 2864, so yes I agree
this shelf of support is a good spot for a pull back to change into a push forward
Another primo pullback level is ES 2849.75. It identified itself as an important level both yesterday and today.
What I have learnt over the last few days, on both gold and the SPX, is that if a wave 2 looks too brief it most certainly is!
Something is setting up. Today’s ES fib chart from daily low to the earlier daily high is what’s happening. The run up, so far, has found resistance at exactly the first fib extension level.
But what interests me is the second fib extension level at ES 2872.25 because my target level is ES 2872. If the ES 2872.25 is reached, then the ES 2872 target will trade.
• Target hit
• Bias flip
• Accumulation of short positions begins
The bull case this morning is looking MUCH healthier 30 minutes in! I got long on the way up a bit…this is /ES hourly w/overnight data.
Price keeps pinging between 78.6% retrace levels. Current one is 2838 in SPX, and maybe it’s going to turn back down here again? Do we have an ABCD with an E down coming? Kind of looks like it to me. This isn’t “supposed” to be a iv structure but there it is. Implying a v up to come…
This maybe…SPX hourly.
Nope, though it could still be a barrier triangle with the top barrier at the top of B around 2844.
Here is one longer term view of IWM. It is just for fun.
Two important levels to watch on a closing basis.
SPX 2800.00
VIX 15.00
Negative divergences abound, so do be careful out there…
I view 2814 (SPX, 2017 or so /ES) as critical today. Breaking below that and I’m getting short. The hourly /ES trend is down and SPX will go to down on such a move (neutral currently).
I think Inter 2 has lower to run.
Foist!
Nyuk Nyuk Nyuk!”
Wise guy, ehh?
C
{ : – )
C